World Journal of Nuclear Science and Technology
Vol.2 No.4(2012), Article ID:23769,6 pages DOI:10.4236/wjnst.2012.24020
Dose-Dependence of Trap Parameters of OSL Decay from Al2O3:C
Faculty of Sciences, Gazi University, Ankara, Turkey
Email: *gunes@gazi.edu.tr
Received June 14, 2012; revised July 15, 2012; accepted July 22, 2012
Keywords: Optically Stimulated Luminescence; Kinetic Parameters; Carbon Doped Aluminum Oxide; Deconvolution
ABSTRACT
Optically Stimulated Luminescence (OSL) trap parameters can only be reliably determined through the detailed analysis of OSL decay curves. In this study the kinetic parameters of a blue-light stimulated luminescence (BLS) decay curve from Al2O3:C sample irradiated at 0.1, 0.15, 0.2, 0.4 and 0.6 Gy beta doses were obtained using the same basic methods with some modifications applied and also by using our suggestion: Active-OSL Approximation (AOSL). The results were compared with those of other studies on the trap parameters of Al2O3:C material.
1. Introduction
The Al2O3:C sample has become an important material as an OSL dosimeter because of its highly sensitive response to ionization radiation. Its use as TL dosimeters was first suggested by Akselrod et al., [1]. Subsequently, many researcher groups [2-10] have investigated the OSL properties of Al2O3:C because of its applications in the field of space, medical therapy and medical diagnostic.
Conventional OSL signals were measured using the illumination source with a constant intensity and luminescence was plotted over time. In many cases there is no mode-based analytical function that is able to describe the shape of the CW-OSL decay curve. In general the experimental data is described as the sum of simple exponential curves and it is often difficult to determine either the number of exponential curves or the number of contributing traps. The evaluation of OSL trap parameters is one of the fundamental requirements in understanding the luminescence mechanism.
Many approaches for determining the trap parameters through the application of various models exist in the literature. The simplest model attempted to explain the luminescence kinetic as consisting of single trap/single recombination centers. Several authors have reported that the decay curve of OSL can be described as the sum of multiple exponentials. Also, it is reported in many works that the OSL decay curves from Al2O3:C samples suggest an overlap of several peaks or even a distribution of traps having different activation energy and frequency factors [11-15].
In the present work the kinetic parameters of OSL decay curves from the Al2O3:C given at different doses were obtained using various known methods to which some modifications were applied. The methods used were: Curve-Fitting of Thermal Analysis, Linear Modulation Technique [16], General Order (GO) [17] Model and Active-OSL (AOSL) Approximation [18,19].
2. Methodology
The methods used in this study for decay curve analysis and their applications are as follows:
2.1. The Curve-Fitting Method
The experimental OSL intensity as the sample preheats temperature increased was fitted to [2,20]:
 (1)
(1)
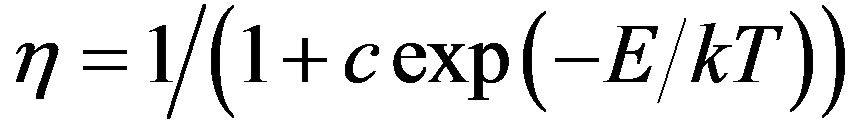
Equation (1) describes the thermal quenching. Where η is luminescence efficiency; c is a dimensionless constant; E, is the activation energy and k is the Boltzman’s constant. In this work, T is the preheat temperature. In first the Al2O3:C aliquot was tested to observe the background luminescence: ~130 - 150 counts/s. The integrated bluelight stimulated luminescence experimental data (0 - 20 s) from Al2O3:C in the range of 295 - 673 K was fitted to the Equation (1). The aliquot was irradiated with 0.1Gy b-dose and measured for 20 s at room temperature (RT): ~295 K. It was bleached by being heated at 400˚C and again exposed to 0.1Gy b-dose/heated at 346 K for 5 minutes, left 30 minutes then measured at RT. These steps were repeated for 373, 398, 423, 448, 473, 498, 523, 548, 573 and 673 K. Then the normalized BLS intensity was plotted against the temperature. These procedures were also repeated for 0.1, 0.15, 0.2, 0.4 and 0.6 Gy beta doses.
2.2. General Order (GO) Technique
According to General Order (GO) technique suggested by Rasheedy [17]
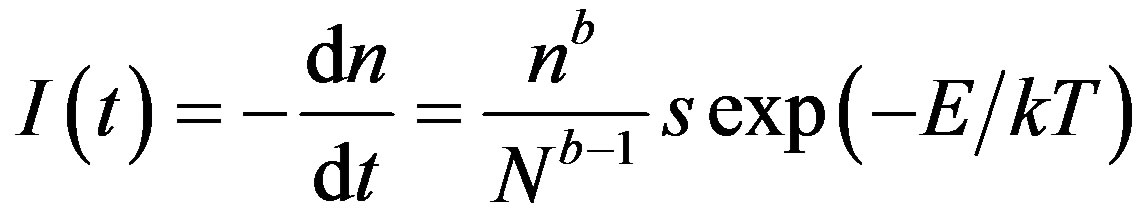
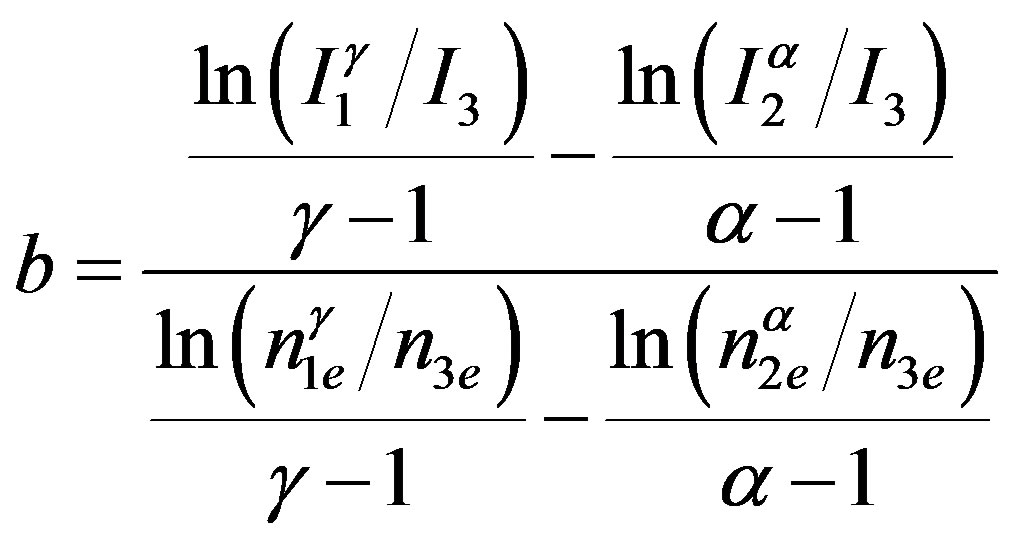
where N is the concentration of the total traps and n is the concentration of filled traps at temperature T. In this model the expression for calculating the order of kinetics b is given as,
 (2)
(2)
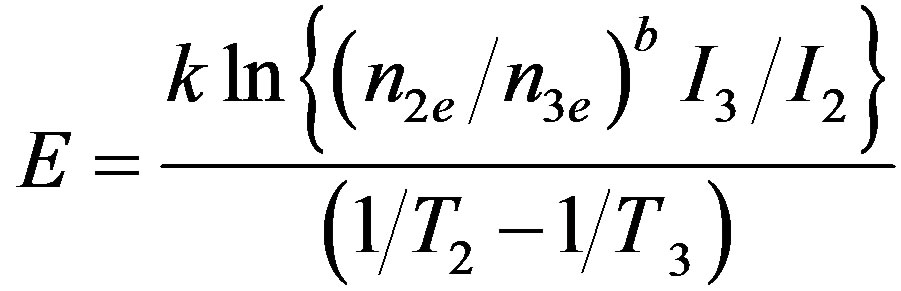
and an expression for calculating E is given as [17] ,
 (3)
(3)
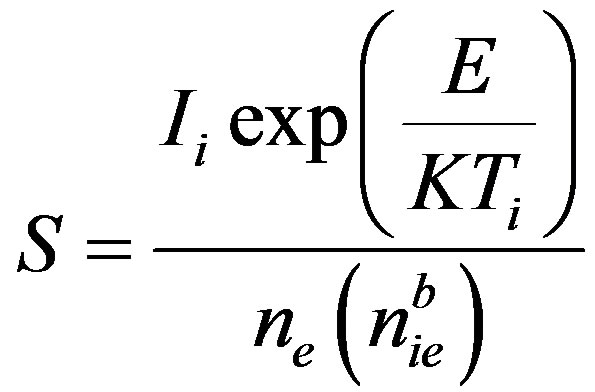 (4)
(4)
where, nie is the area under the glow peak from Ti to the end of the glow peak; ne is the area under the whole glow peak; γ = T1/T3 and α = T2/T3. As far as we know, this method of analysis has only been applied for TL traps not for OSL up to now. The peak-shape form of the decay curve is required to apply this method. To obtain the peak-shape curve, the reduction rate of BSL signal was calculated as percentage of the original signal using the experimental data and plotted versus T [21,22]. In this study three temperature points were selected on PS curve, one of them was on the left side of the peak and the others were on the right side of it. These selected temperature positions have critical importance unlike with Ogunxdare et al., [23,24].
2.3. Linear Modulation Technique (LM-OSL)
LM-OSL technique suggested by Bulur [16] transforms CW-OSL signal to a peak-shape form. The details of the transformation process are given in the study by Bulur [25].
CW-OSL decay curve for the first-order kinetic of a simple solid material that consisting of one trap and one recombination center is described as follow [12]:
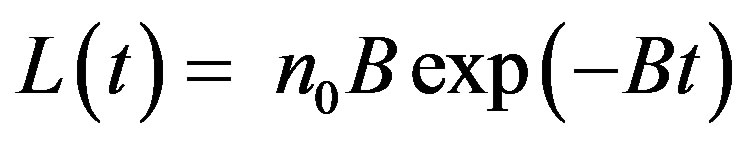 (5)
(5)
where n0 is the initial trap concentration; B is a constant describing the decay of luminescence curve and is proportional to the photoionization cross section and the intensity of light I0 (B = aI0) Bulur [25]. A new independent variable, u, is described to transform the CWOSL curve to LM-OSL.
where u is time in second and P @ 2t.
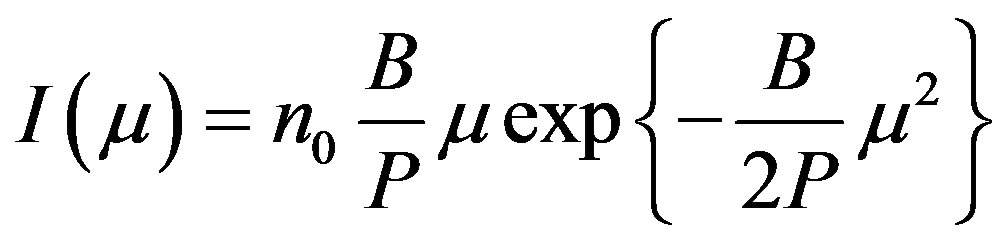 (6)
(6)
Equation (6) is the first order LM-OSL curve.
2.4. AOSL Approximation
The process is similar to the successive decay of a radioactive element but not identical [18,19]. Accordingly, the equations describing the OSL counts and the activity (or OSL intensity) are proposed as follows:
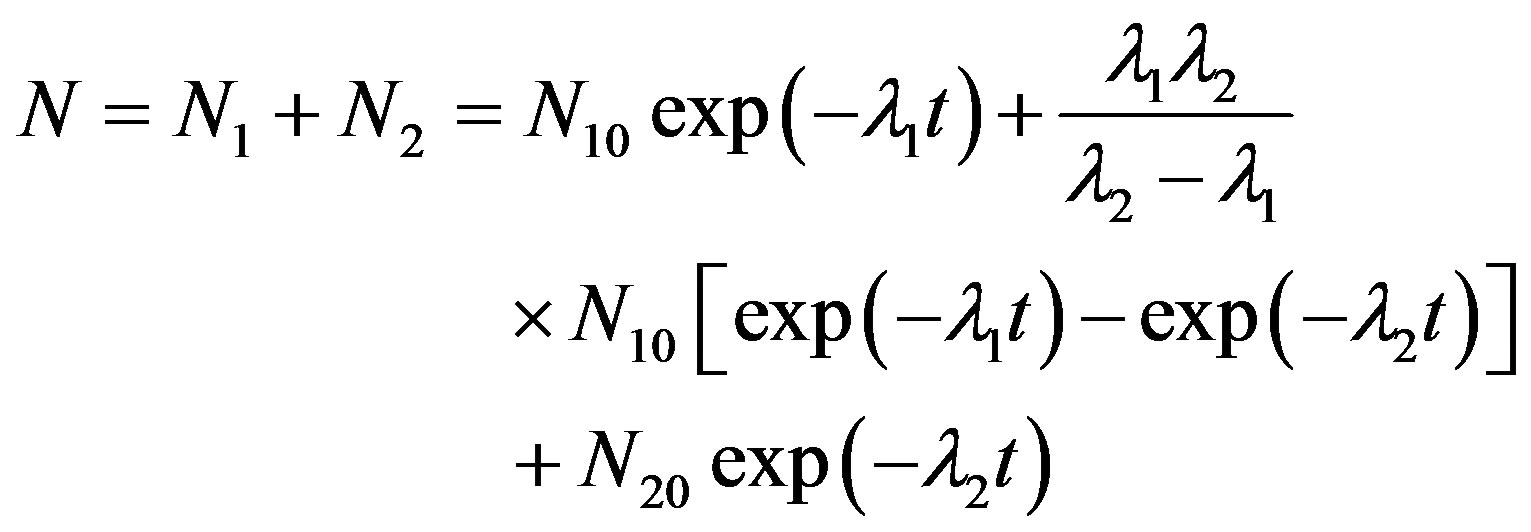 (7)
(7)
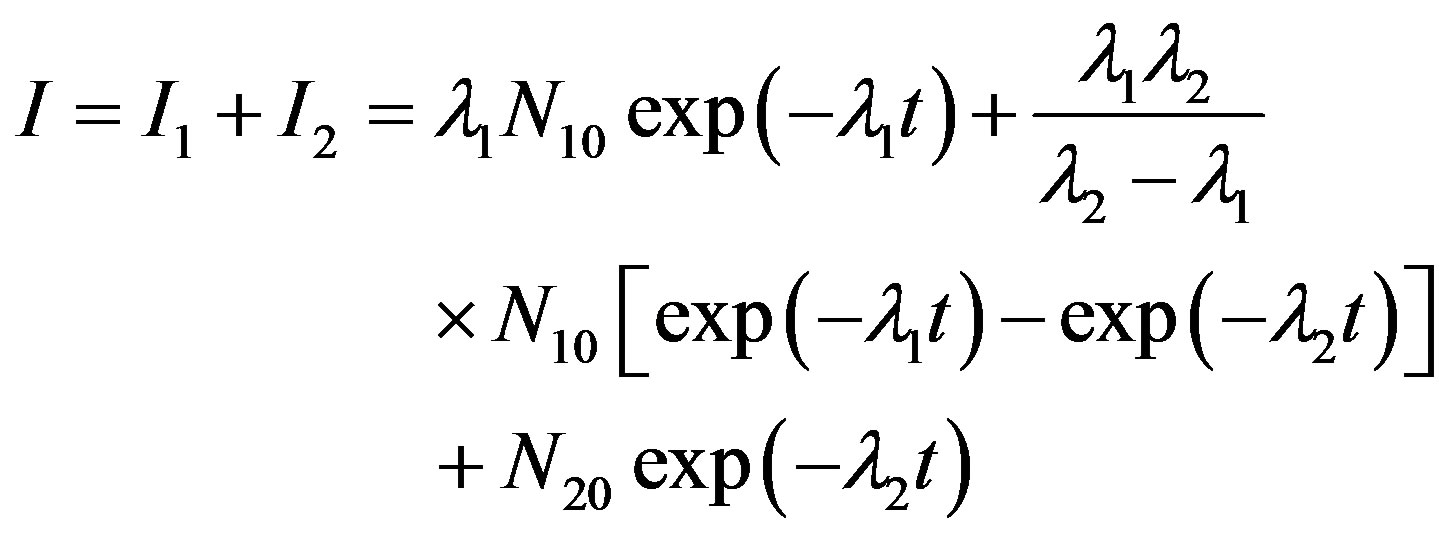 (8)
(8)
Equation (7) describes the luminescence photons counted experimentally over finite time intervals. N1 is the number of atoms in the parent element which decays at λ1 into its daughter element; and N2 is the number of atoms in the daughter element, which decays at a constant decay rate λ2, into a stable element having N3 stable atoms. Assume that at time t = 0, N1 = N10 and N2 = N20. While Equation (7) has been used to plot the OSL decay curves, Equation (8) was found to be applicable to find the kinetic parameters of IRSL. It is important to note here, for the compensation of theoretical and experimental data the term λ2 should be inserted in the numerator of the second term in Equation (7). This situation is different from radioactive decay law. Radioactive decay law of successive disintegration can be found in the book written by Krane [26].
3. Experimental
In this work the apparatus developed by Spooner et al., [27] was used. All measurements were carried out using an automated ELSEC 9010 OSL reader system with a ring of 24 blue-light OSL attachments. These LEDs with blue-light (~ ) from WENRUN were settled to system by us. They have a power output of about 6 cd at 20 mA current and an emission angle of 25˚. A green long-pass Schott GG-420 filter was mounted in front of blue LEDs to minimize the amount of directly scattered blue light reaching the PM photocathode. In 24 diodes, the total power delivered to the sample was measured as 21.6 mW/cm2 at distance of 16 mm. Detection was made through 3 Hoya U-340 filters (3 mm).
A 90Sr-90Y β-source was used for irradiation. The dose rate given to sample was 0.028 Gy∙s–1. Bleaching was carried out by exposing to daylight and checked by measuring the signals from the sample. All the luminescence measurements were made at room temperature (RT). Luminescence was detected using a Thorn-EMI 9235QA PM Tube (with a Schott BG-39 filter) having a dark count rate of about 130 - 150 cps at room temperature. Al2O3:C single crystal discs (diameter 5 mm and thickness 1 mm) were used in the measurements.
4. Results and Discussion
Figure 1 shows the pulse annealing experimental curves for the integrated BSL (0 - 20 s) in the range of 295 - 673 K from α-Al2O3:C. The experimental data was fitted to the Equation (1) and the activation energy values were obtained from this fitted curve:
h = 1/(1 + 4.25 × 10¹⁰exp (–1.15/ (0.000086174 × T))) for 0.1 Gy;
h = 1/(1 + 3.33 × 10¹⁰exp (–1.05/ (0.000086174 × T))) for 0.2 Gy;
h = 1/(1 + 5.60 × 10¹¹exp (–1.07/ (0.000086174 × T))) for 0.4 Gy;
h = 1/(1 + 2.63 × 10⁹exp (–1.066/ (0.000086174 × T))) for 0.6 Gy.
The activation energies and dimensionless constants can be seen from these equations. It can be seen that the activation energy of α-Al2O3:C does not vary with betadose in the range 0.1 - 0.6 Gy and that its mean value is 1.084 eV.
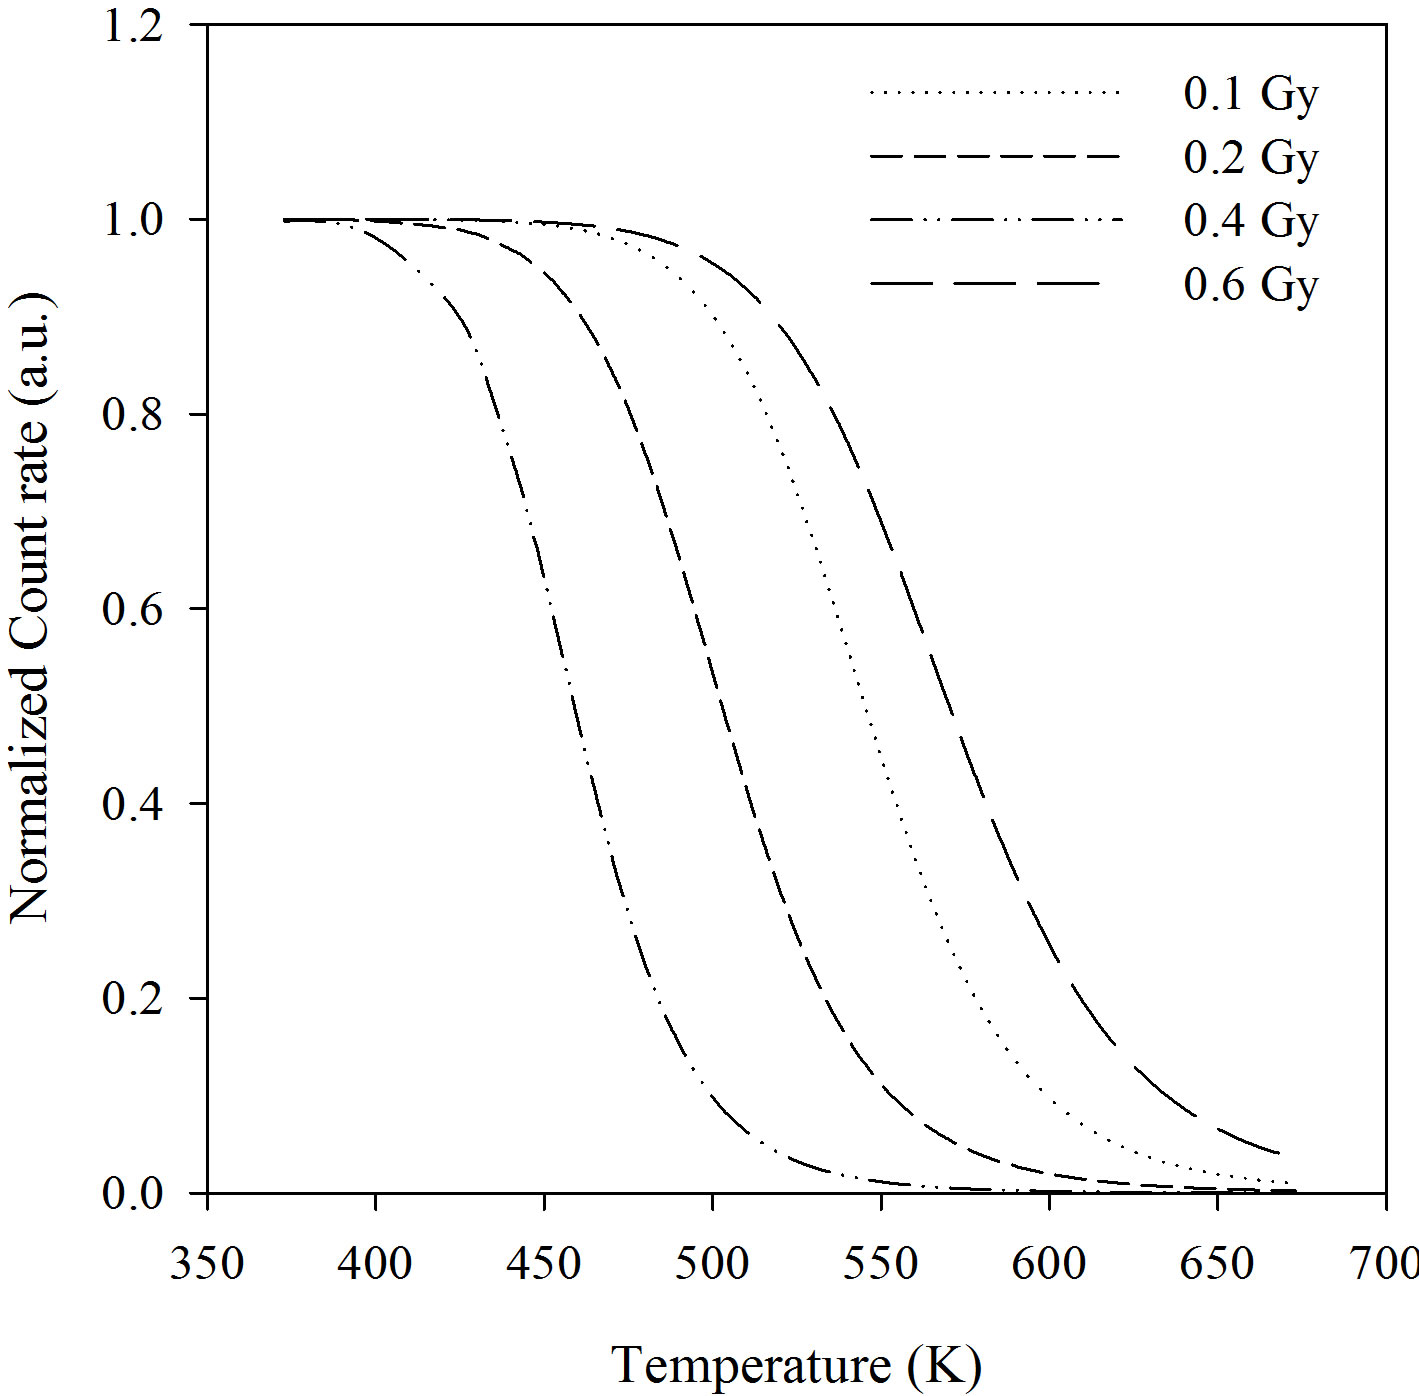
Figure 1. The experimental pulse annealing curves at different beta doses.
Figure 2 was plotted using the fitted data in Figure 1.They are peak-shape (PS) curves for α-Al2O3:C at the doses given. The percentage of reduction in the BSL signals was plotted against annealing temperature. As seen from Figure 2, peak temperatures are different a relationship between dose and peak temperature was not observed.
To apply the GO technique suggested by Rasheedy [17] the three temperature points were selected on the peakshape (PS) plots. For example the data for 0.1 Gy are T1 = 503 K; T2 = 563 K and T3 = 593 K. The value of b, that is the order of kinetics of OSL decay mechanism, was calculated as 1.71 using the Equation (2). The order of kinetics that describes the retrapping number of charges should be the integral number so it is possible to assume as 1.71 @ 2. The results were listed at Table 1 for other doses values. The activation energy was found to be 1.09 ± 0.035 eV using the GO Model for 0.1 Gy beta-dose. In this study, although the GO model was applied for the analysis of the OSL traps, the selected temperature points on the PS curve should not be random; one of them should be selected before the maximum temperature and the others should be selected after the peak temperature. The comparison of trap parameters determined by using GO model and the pulse annealing curve fitting are shown in Table 1. The discrepancy between activation energies at 0.1 Gy and 0.6 Gy was found to be 92% using curve fitting and 99.09% using the GO model. Therefore, it can be seen that the activation energy of α-Al2O3:C does not change with beta dose in the range 0.1 - 0.6 Gy. Bulur et al., [6] reported that the activation energy of Al2O3:C as E = 1.15 eV and Akselrod et al., [28] found to be about 1.08 eV.
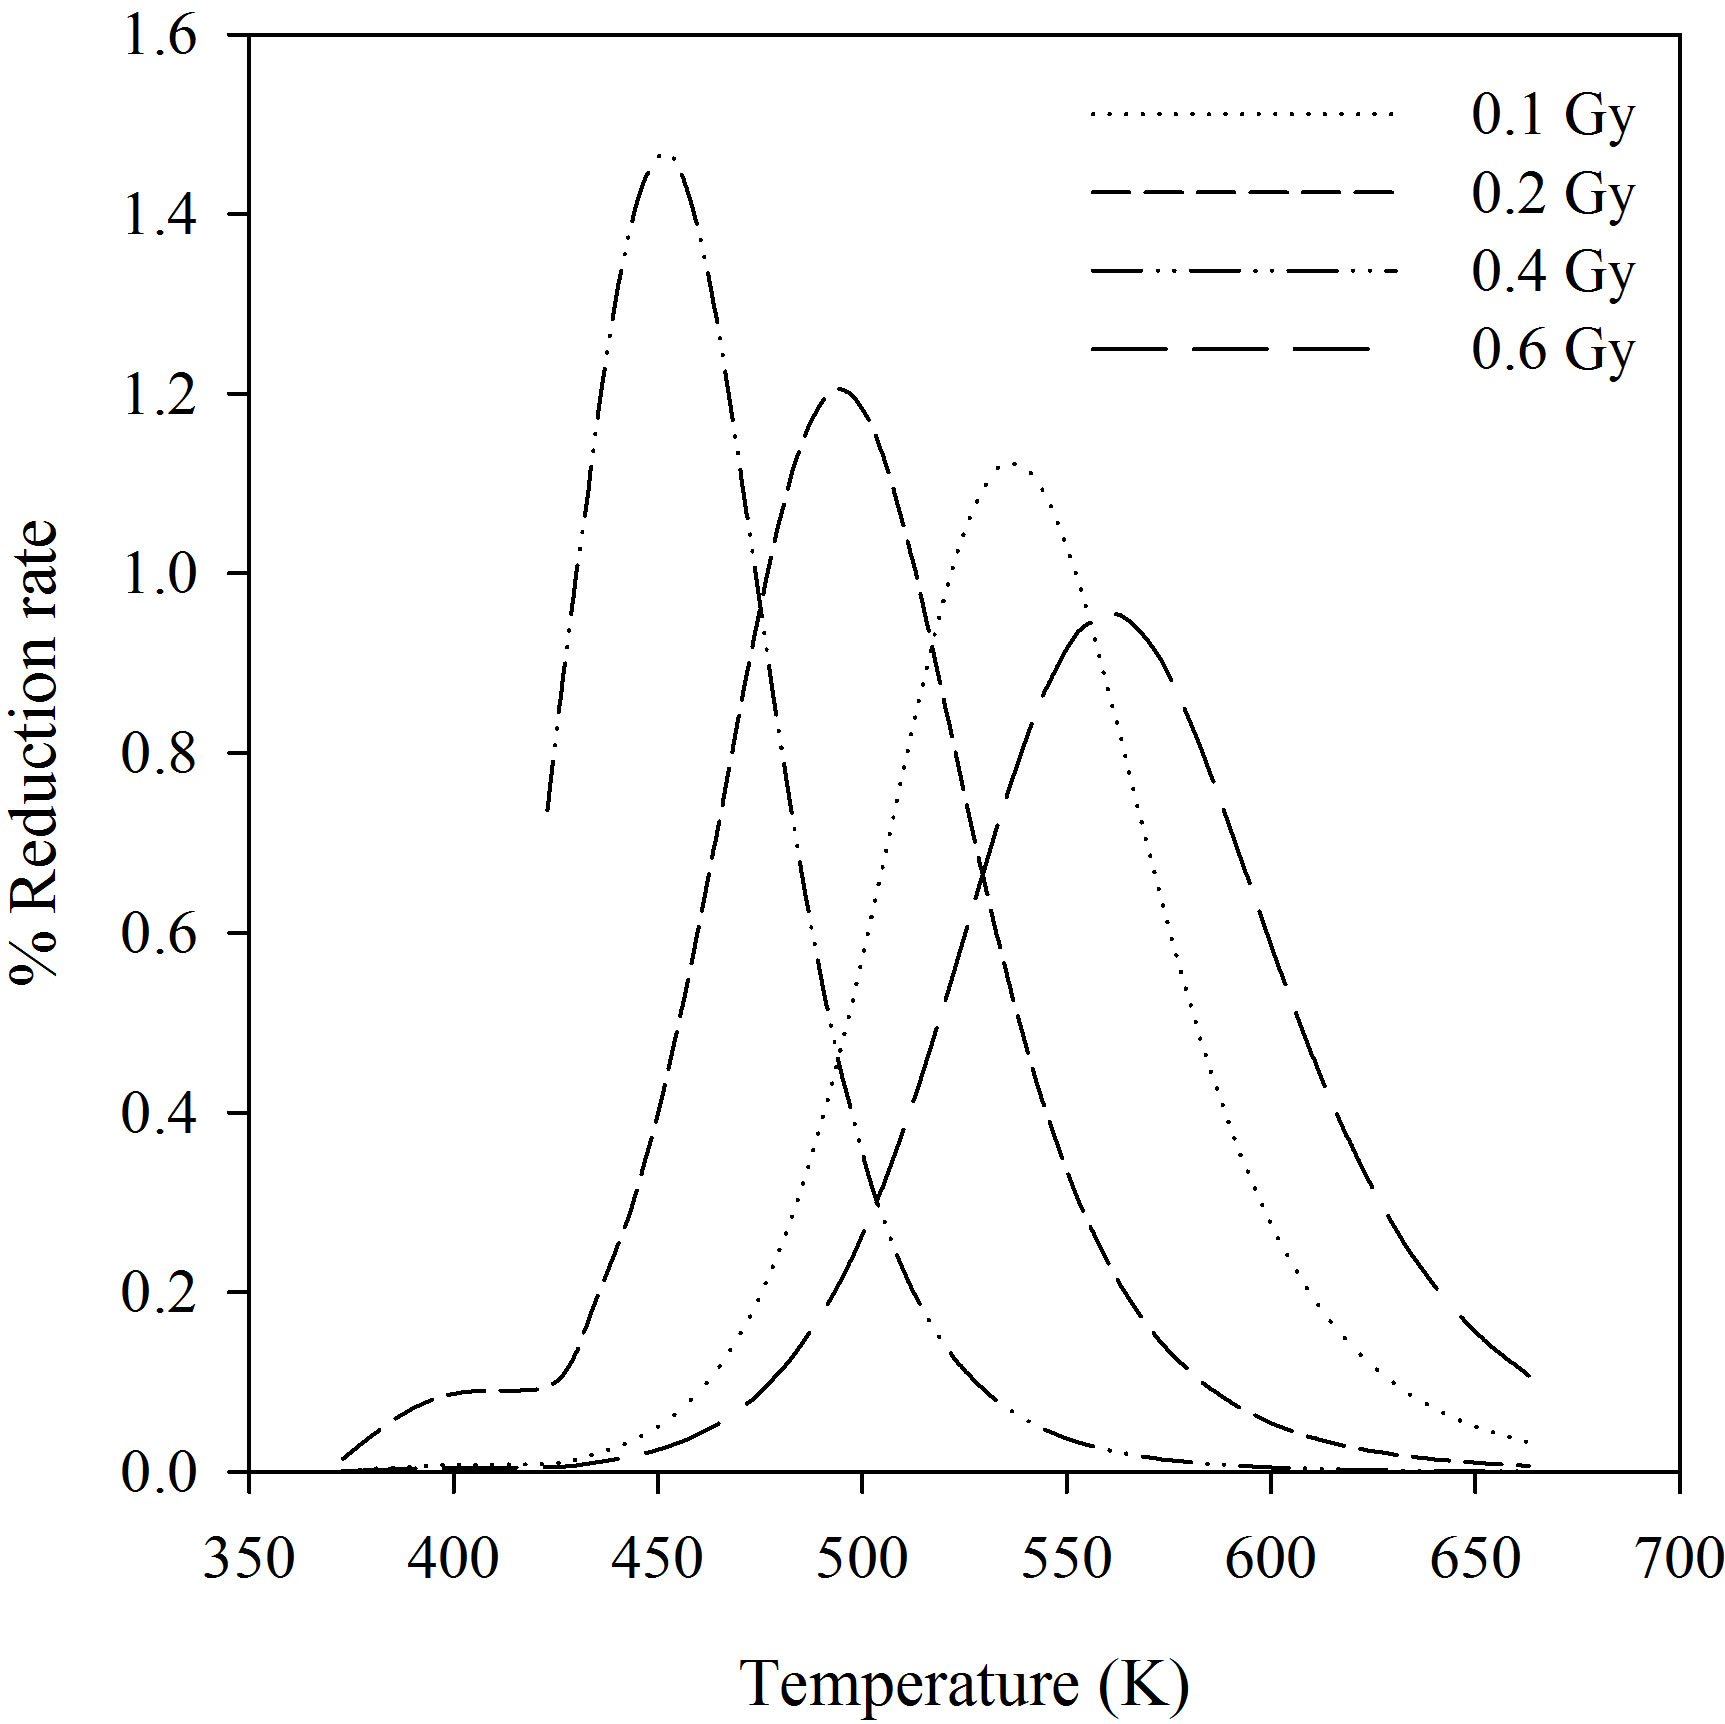
Figure 2. Percentage of the BSL signal reduction plotted against annealing temperature for α-Al2O3:C given different beta-doses.
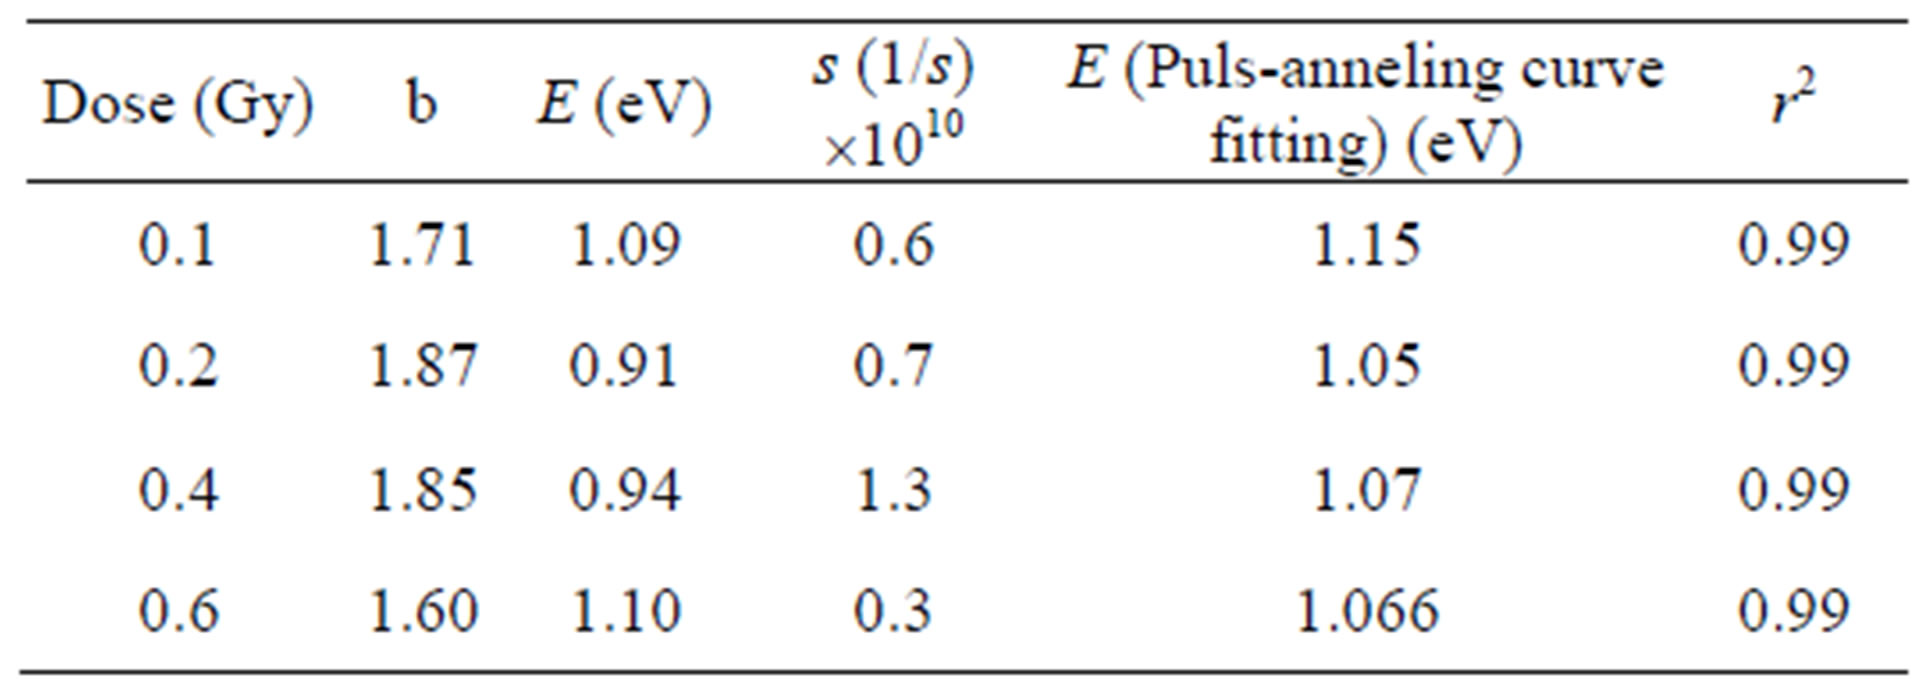
Table 1. Trap parameters of α-Al2O3:C using GO model and pulse annealing curve fitting.
The experimentally measured CW-OSL decay curves from the α-Al2O3:C is shown in Figure 3 for different beta-doses. Their dose dependence can clearly be seen. The total luminescence counts increase as dose increases as expected in the luminescence technique and the increasing dose distorts the shape of the peak. An initial increase was observed in the BSL intensity from Al2O3:C. McKeever and Chen [29] reported that the reason for the initial increase in luminescence intensity was thermally metastable traps. So, in this study the measurements used to calculate the parameters were taken after the maximum intensity. These decay curves were fitted to the sum of two simple exponential functions and the decay constants are shown in the Table 2. These curves were transformed to LM-OSL curves using the transformation equation suggested by Bulur [16] (Figure 4). Although the measured decay curves at 0.1, 0.15 and 0.2Gy of Al2O3:C can be fitted to the sum of two simple exponential functions, the LM-OSL curve cannot clearly display the different two peaks (Figure 4). This situation was also seen in the work reported by Bulur et al., [30].
Figure 5 shows the comparison between the experimental decay curve and the analysis model’s decay curve known as AOSL Approximation. The peak-shaped forms obtained using the AOSL approximations are shown in Figure 6. The two peaks having different decay constants can be clearly seen for a 0.2 Gy dose. The decay curves at 0.4 and 0.6 Gy were fitted to only one simple exponential function. In the AOSL approximation the graph of the logarithm of the luminescence intensity versus the time clearly shows the two decay constants (Figure 7). The decay constants determined from these graphs are also shown in Table 2. However the decay constant, l2, decreases as dose increases but l1 does not change. The line equations for l1 at Figure 7 are as follows:
y = -0.197x + 9.359 (r2 = 0.999) for 0.1 Gy;
y = -0.196x + 9.740 (r2 = 0.999) for 0.15 Gy;
y = -0.192x + 10.046 (r2 = 0.999) for 0.2 Gy.
They are as follows for l2:
y = -0.0699x + 8.6 (r2 = 1) for 0.1 Gy;
y =-0.049x + 8.42 (r2 = 0.999) for 0.15 Gy;
y = -0.0346x + 8.40 (r2 = 0.999) for 0.2 Gy.
Yukihara et al., [13] also observed that the rate of decay increases as dose increases.
5. Conclusions
The determination of OSL trap parameters is one of the fundamental requirements in understanding the lumines-
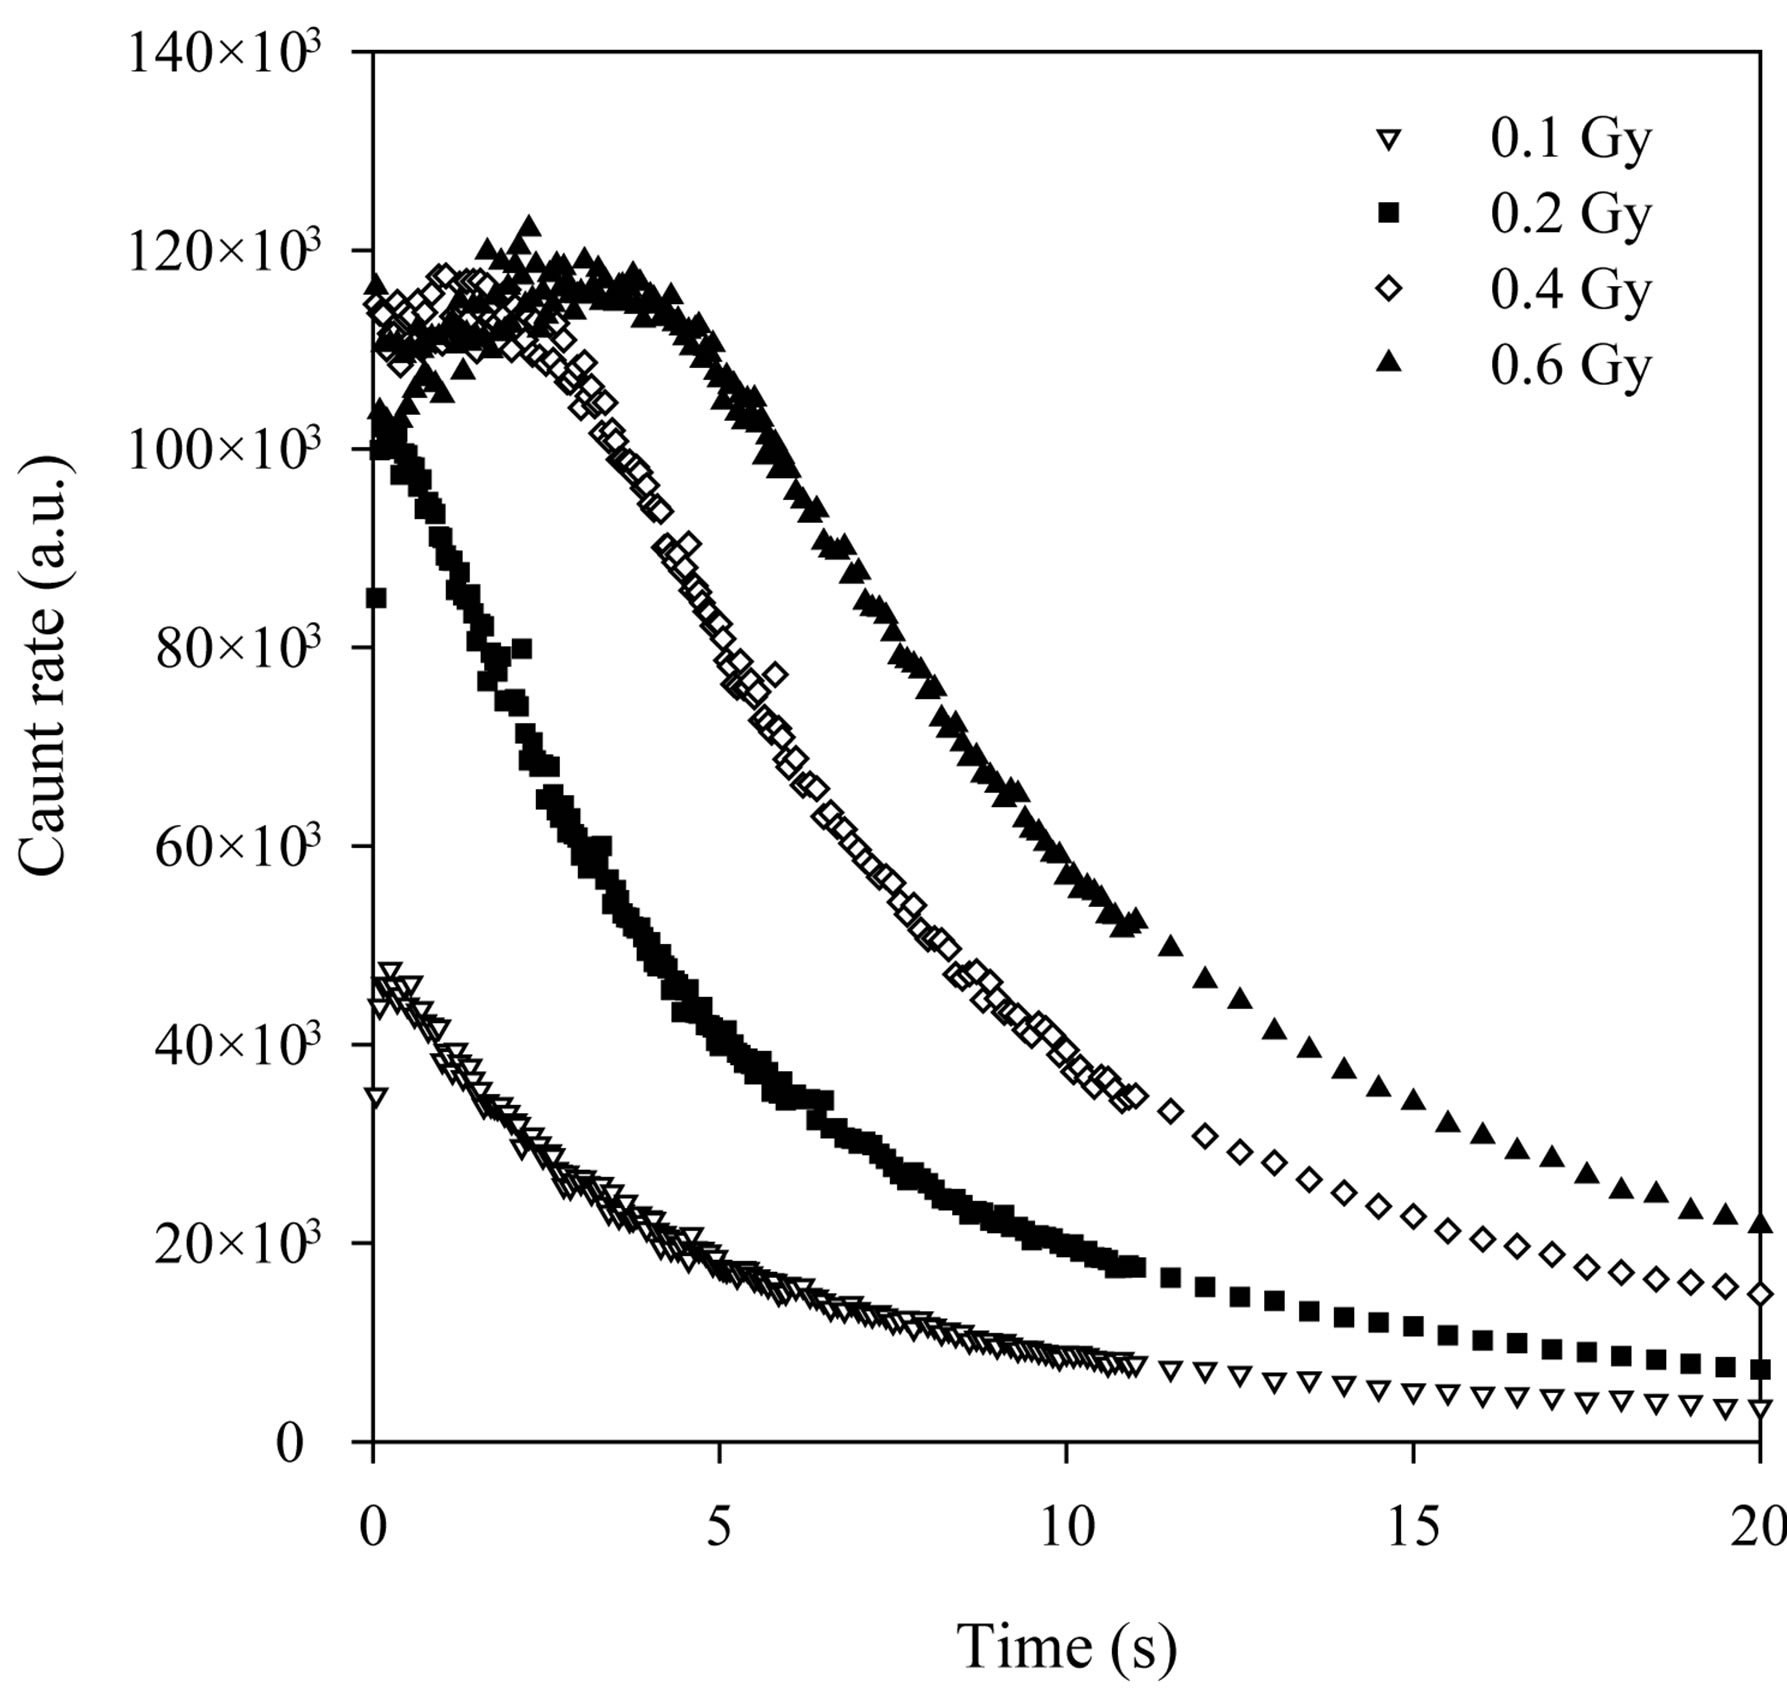
Figure 3. The decay curves measured experimentally.
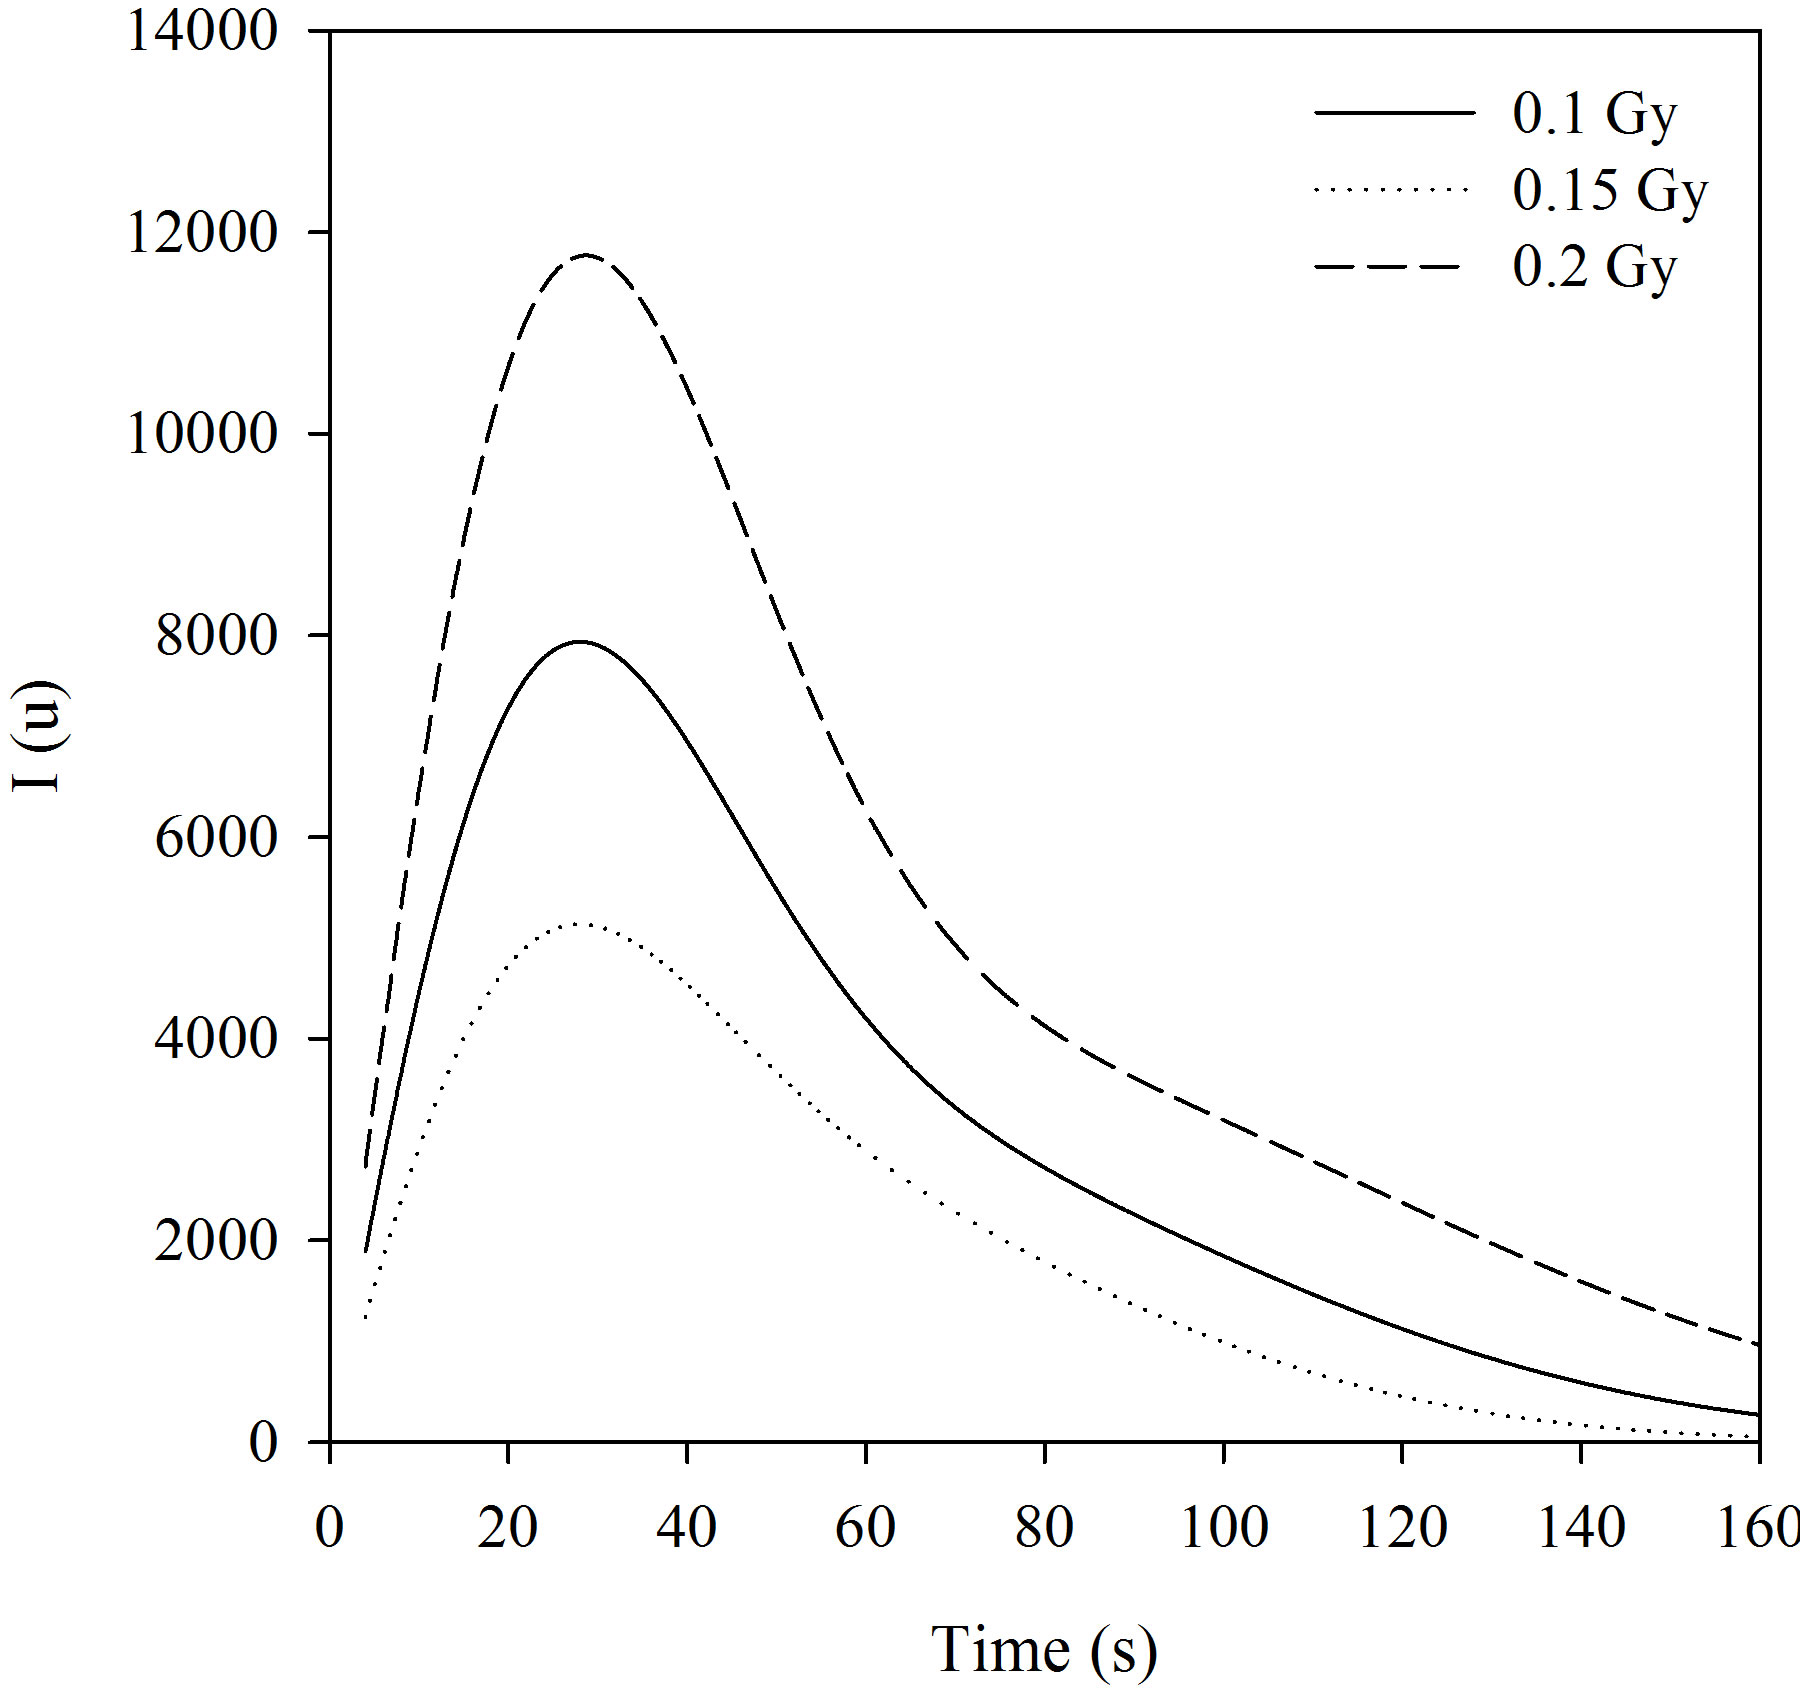
Figure 4. LM-OSL curves.
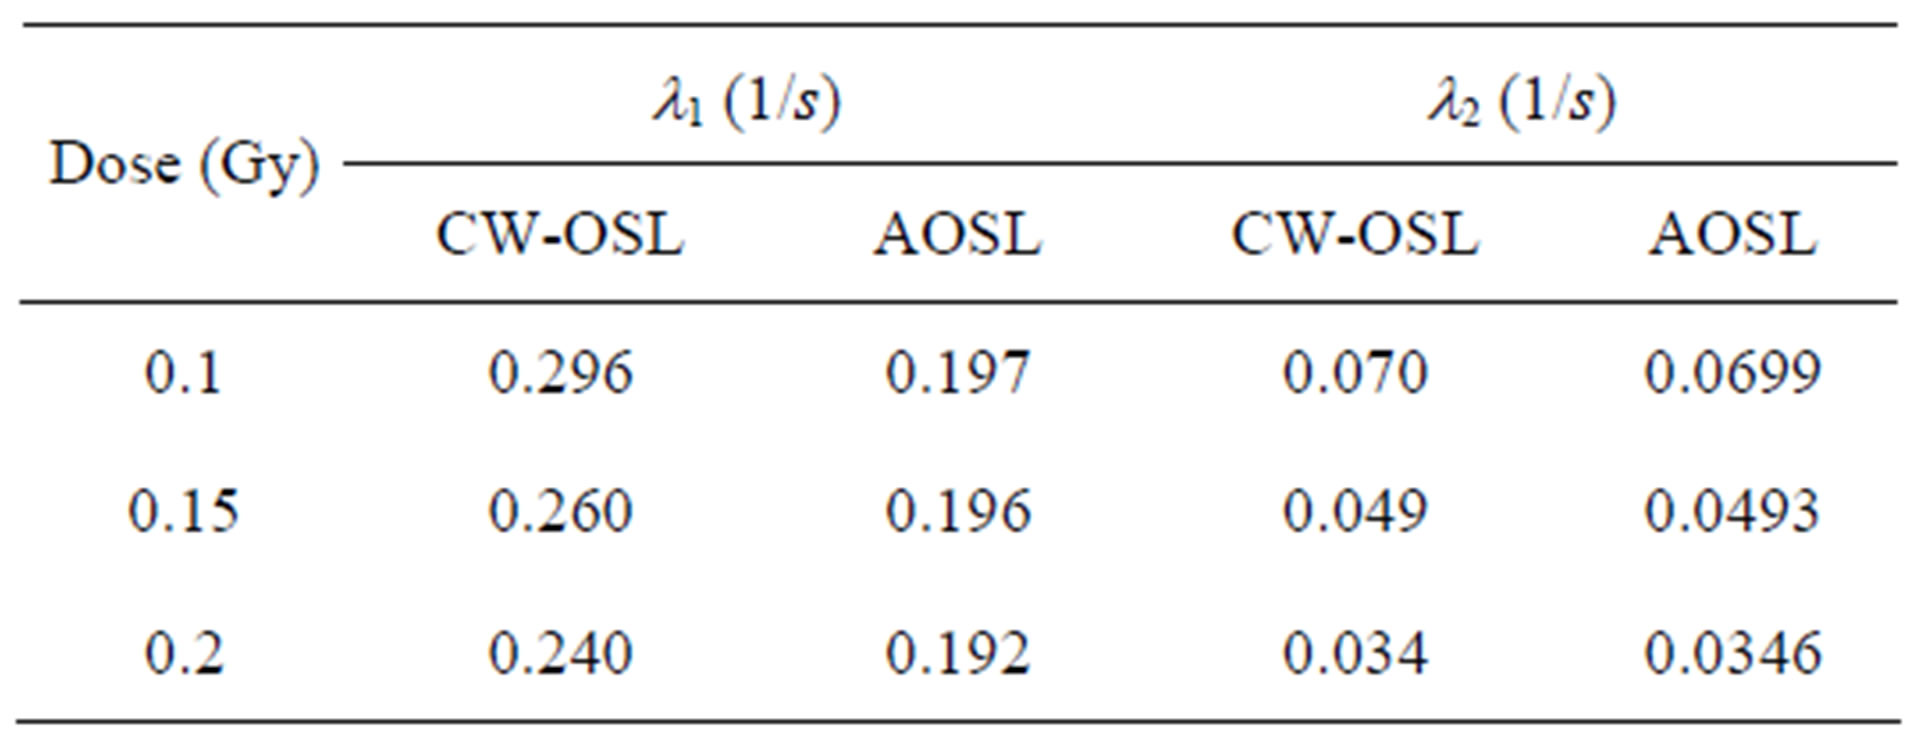
Table 2. The decay constants using CW-OSL curve-fitting and AOSL approximation.
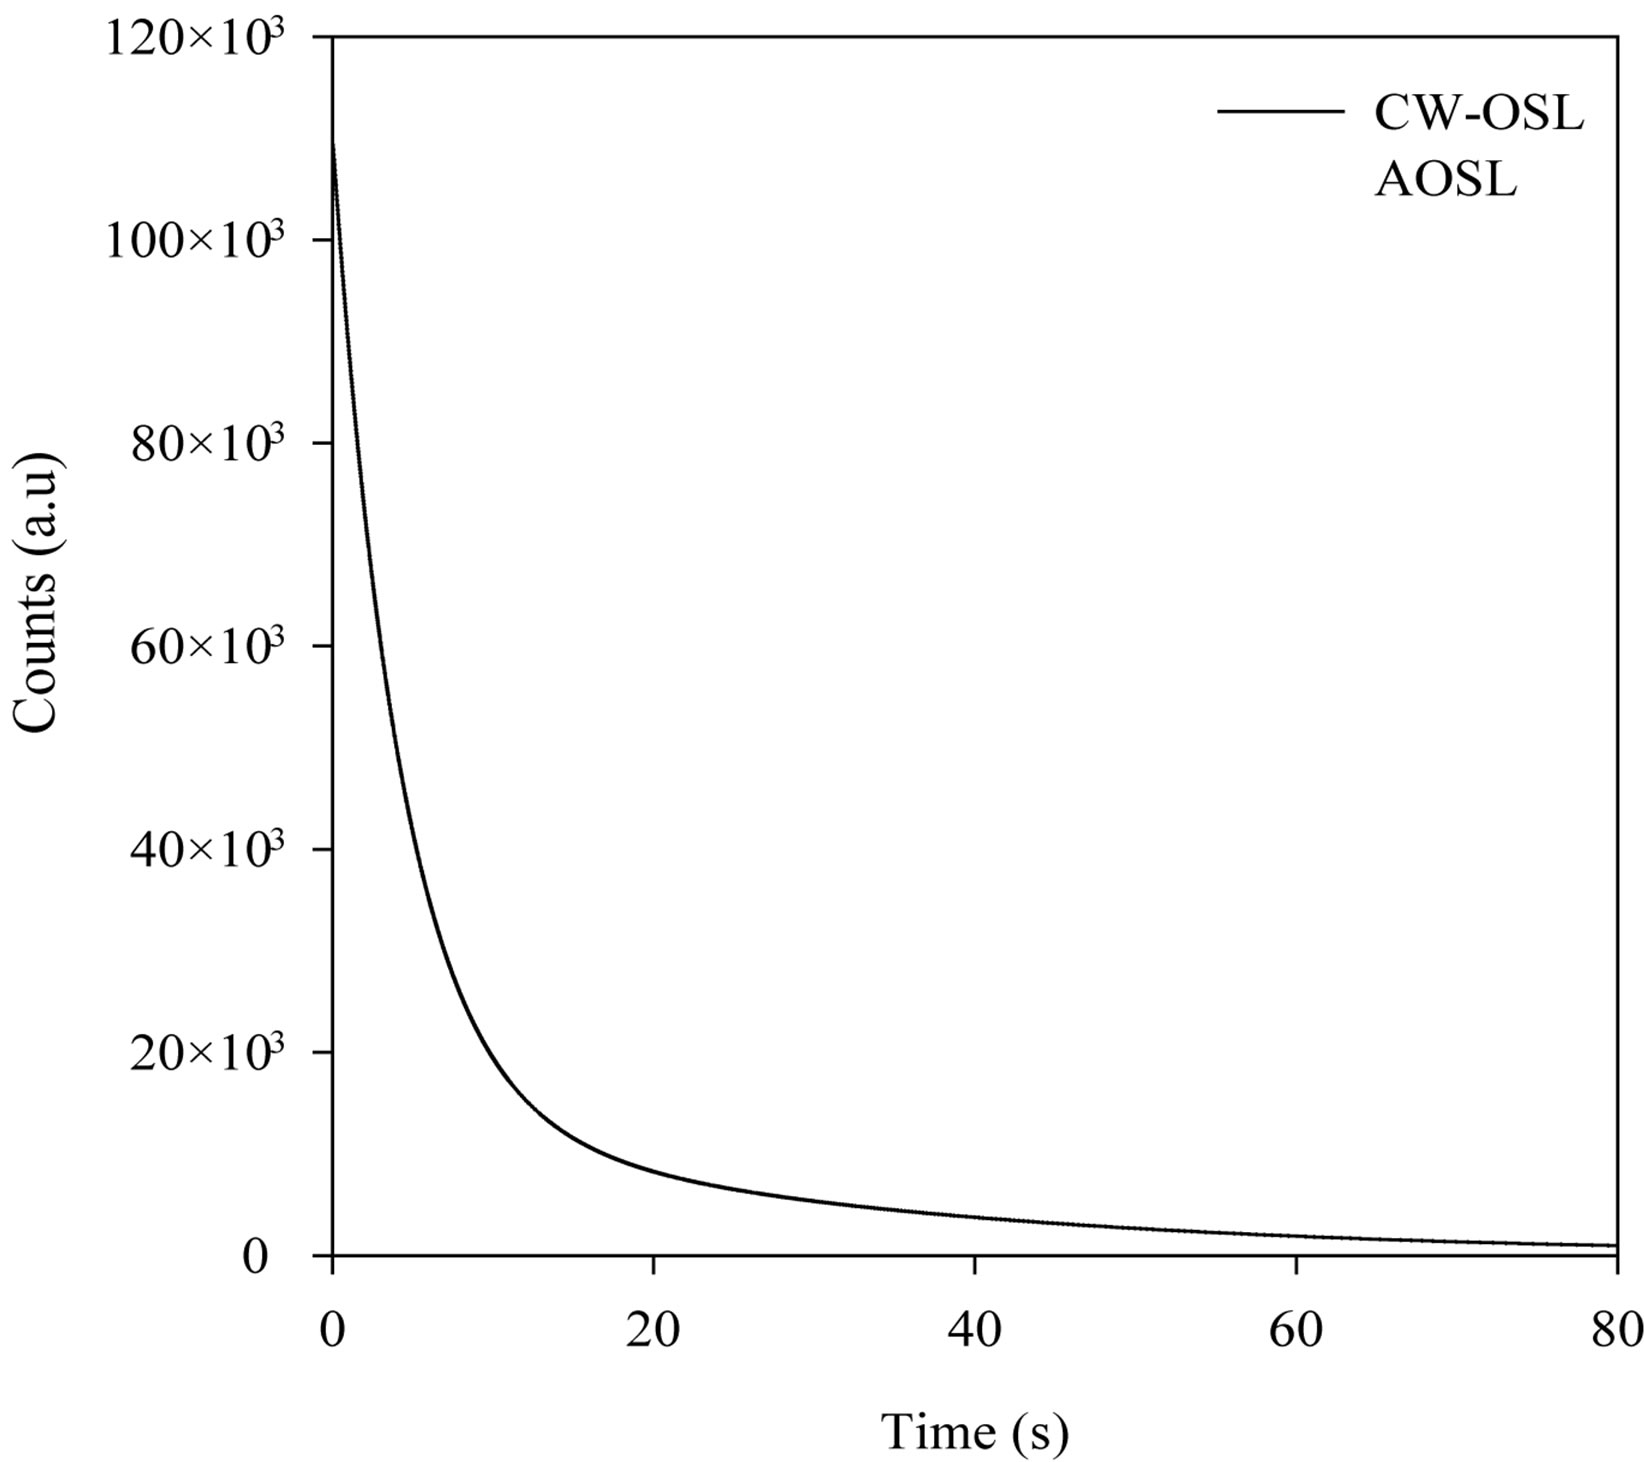
Figure 5. Comparison of decay curves between CW-OSL and AOSL.
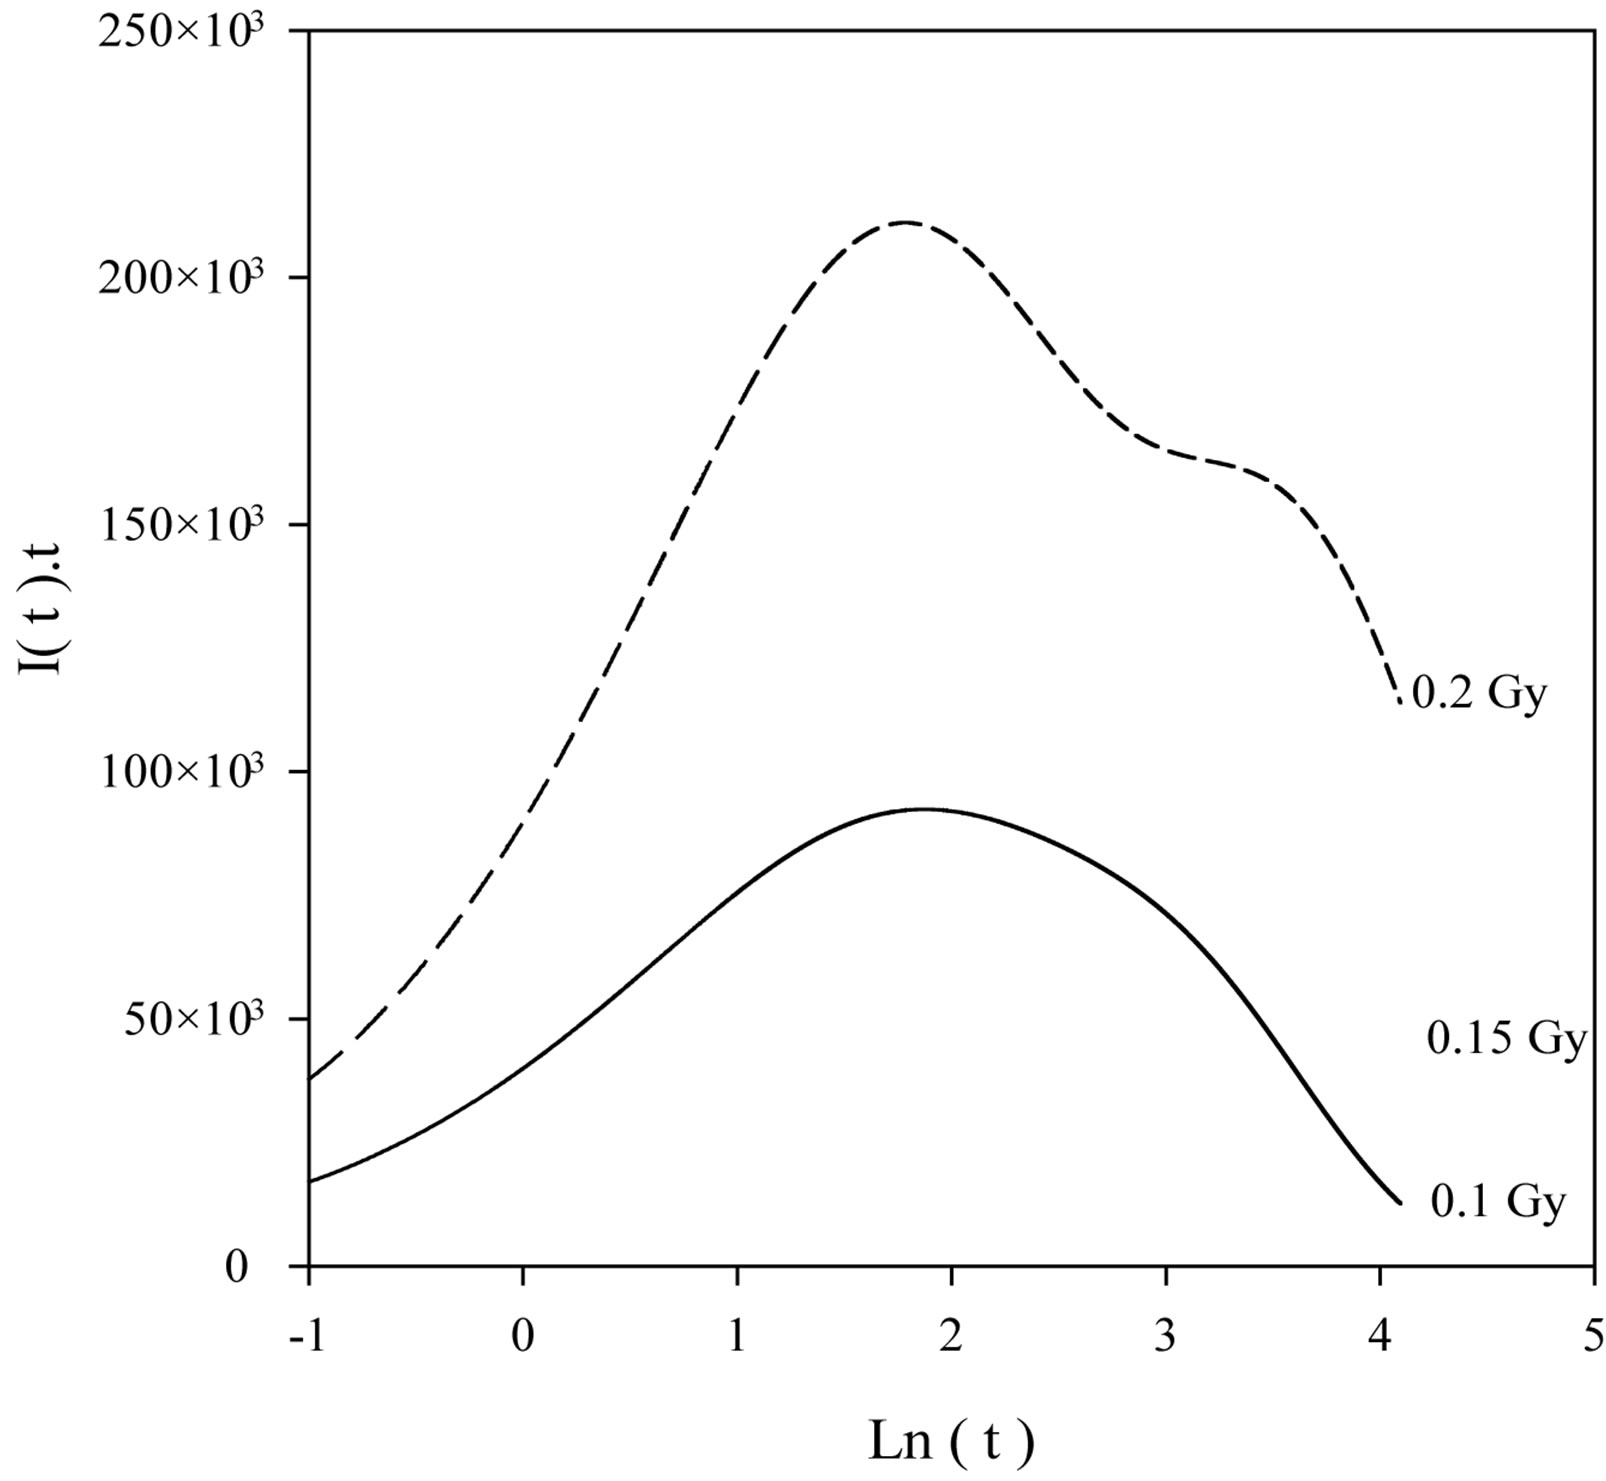
Figure 6. Peak-shape form of luminescence intensity using AOSL approximation.
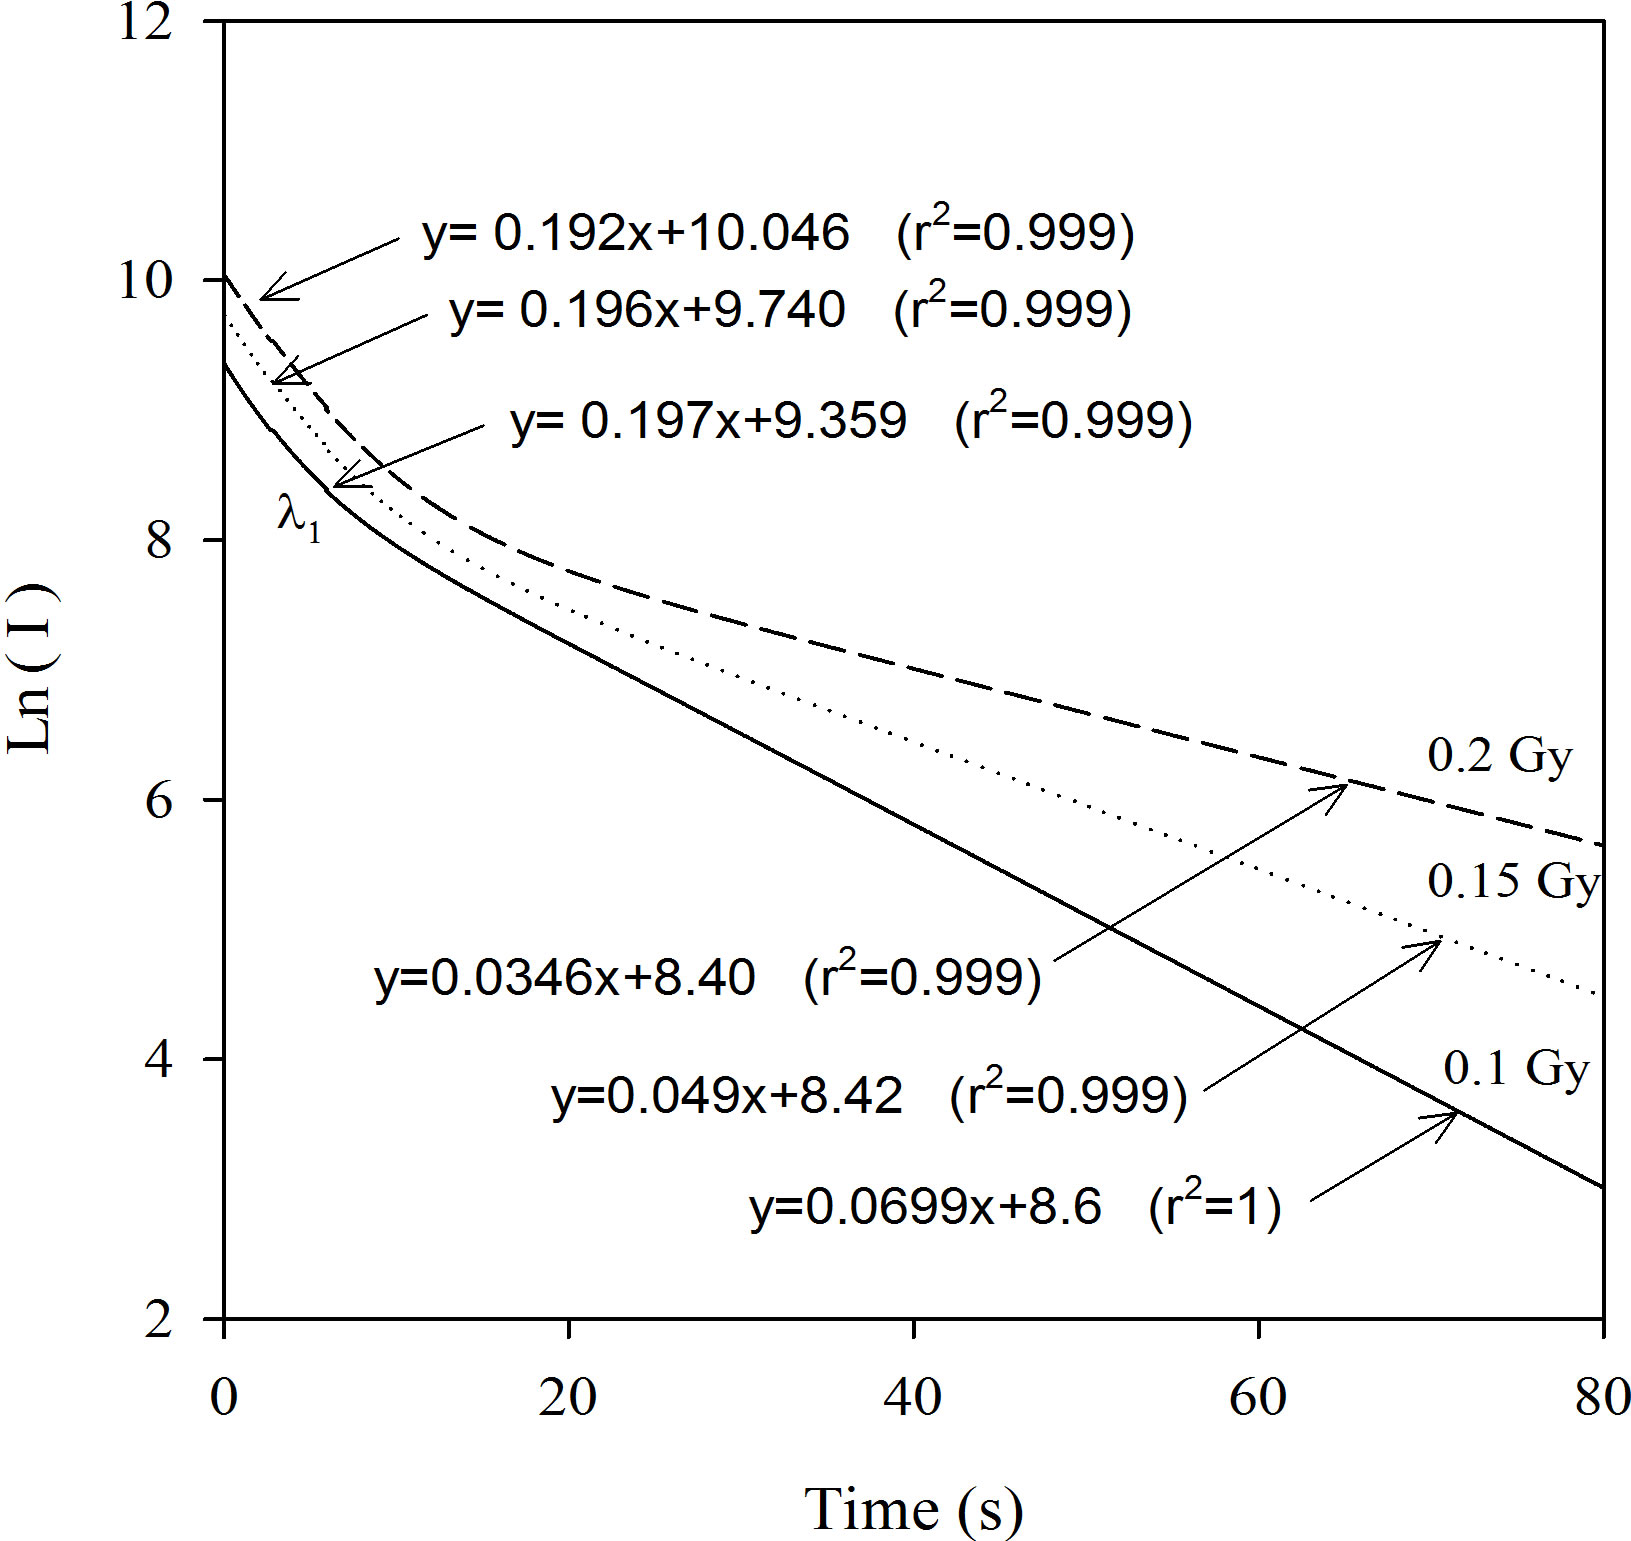
Figure 7. The graph of the logarithm of luminescence intensity versus time using AOSL approximation: The difference between the decay constants was clearly determined.
cence mechanism. Trap parameters of Al2O3:C sample are also important for dating and dosimetric studies using the OSL technique. This study shows that the activation energy of Al2O3:C does not change with beta radiation dose but that its decay constants do change. It may be said that the results of activation energies obtained from different experimental conditions are nearly the same.
The decay curve of Al2O3:C nears a single simple exponential function as the dose increases. AOSL approximation is reliably valid in determining the decay constants.
6. Acknowledgements
We are grateful to Dr. Enver Bulur for his helpful discussions, especially in giving the α-Al2O3:C sample.
REFERENCES
- M. S. Akselrod, V. S. Kortov, D. J. Kravetsky and V. I. Gotlib, “Highly Sensitive Thermoluminecent Anion-Defective α-Al2O3:C Single Crystal Detector,” Radiation Protection Dosimetry, Vol. 32, 1990, pp. 15-29.
- A. E. Akselrod and M. S. Akselrod, “Correlation between OSL and the Distribution of TL Traps in Al2O3:C,” Radiation Protection Dosimetry, Vol. 100, No. 1-4, 2002, pp. 217-220.
- L. Bøtter-Jensen, L. N. Agersnap, B. G. Markey and S. W. S. McKeever, “Al2O3:C as a Sensitive OSL Dosemeter for Rapid Assessment of Environmental Photon Dose Rates,” Radiation Measurements, Vol. 27, No. 2, 1997, pp. 295-298. doi:10.1016/S1350-4487(96)00124-2
- L. Bøtter-Jensen, D. Banarjee, H. Jungner and A. S. Murray, “Retrospective Assessment of Environmental Dose Rates Using Optically Stimulated Luminescence from Al2O3:C and Quartz,” Radiation Protection Dosimetry, Vol. 84, No. 1-4, 1999, pp. 537-542. doi:10.1093/oxfordjournals.rpd.a032793
- E. Bulur and H. Y. Göksu, “Pulsed Optically Stimulated Luminescence from α-Al2O3:C Using Green Light Emitting Diodes,” Radiation Measurements, Vol. 27, No. 3, 1997, pp. 479-488. doi:10.1016/S1350-4487(97)00015-2
- E. Bulur, H. Y. Göksu and W. Wahl, “Infrared (IR) Stimulated Luminescence from α-Al2O3:C,” Radiation Measurements, Vol. 29, No. 6, 1998, pp. 625-638. doi:10.1016/S1350-4487(98)00076-6
- J. M. Edmund and C. E. Andersen, “Temperature Dependence of the Al2O3:C Response in Medical Luminescence Dosimetry,” Radiation Measurements, Vol. 42, No. 2, 2007, pp. 177-189. doi:10.1016/j.radmeas.2006.11.006
- E. G. Yukihara and S. W. S. McKeever, “Ionization Density Dependence of the Optically And Thermally Stimulated Luminescence from Al2O3:C,” Radiation Protection Dosimetry, Vol. 119, No. 1-4, 2006, pp. 206-217. doi:10.1093/rpd/nci591
- V. H. Whitley and S. W. S. McKeever, “Linear Modulation Optically Stimulated Luminescence and Thermoluminescence Techniques in Al2O3:C,” Radiation Protection Dosimetry, Vol. 100, No. 1-4, 2002, pp. 61-66.
- R. H. Biswas, M. K. Murari and A. K. Singhv, “DoseDependent Change in the Optically Stimulated Luminescence Decay of Al2O3:C,” Radiation Measurements, Vol. 44, No. 5-6, 2009, pp. 543-547. doi:10.1016/j.radmeas.2009.04.010
- B. G. Markey, S. W. S McKeever, M. S. Akselrod, L. Bøtter-Jensen, L. N. Agersnap and L. E. Colyott, “The Temperature Dependence of Optically Stimulated Luminescence from α-Al2O3:C,” Radiation Protection Dosimetry, Vol. 65, No. 1-4, 1996, pp. 185-189. doi:10.1093/oxfordjournals.rpd.a031617
- S. W. McKeever, “Optically Stimulated Luminescence Dosimetry,” Nuclear Instruments and Methods in Physics Research Section B, Vol. 184, No. 1-2, 2001, pp. 29-54. doi:10.1016/S0168-583X(01)00588-2
- E. G. Yukihara, V. H. Whitley, S. W. S. McKeever, A. E. Akselrod and M. S. Akselrod, “Effect of High-Dose Irradiation on the Optically Stimulated Luminescence of Al2O3:C,” Radiation Measurements, Vol. 38, No. 3, 2004, pp. 317-330. doi:10.1016/j.radmeas.2004.01.033
- V. Pagonis, R. Chen and J. L. Lawless, “A Quantitative Kinetic Model for Al2O3:C TL Response to Ionizing Radiation,” Radiation Measurements, Vol. 42, No. 2, 2007, pp. 198-204. doi:10.1016/j.radmeas.2006.07.006
- D. R. Mishra, S. Anuj, N. S. Rawat, M. S. Kulkarni, B. C. Bhatt and D. N. Sharma, “Method of Measuring Thermal Assistance Energy Associated with OSL Traps in α-Al2O3:C Phosphor,” Radiation Measurements, Vol. 46, No. 8, 2011, pp. 635-642. doi:10.1016/j.radmeas.2011.05.069
- E. Bulur, “An Alternative Technique for Optically Stimulated Luminescence (OSL) Experiment,” Radiation Measurements, Vol. 26, No. 5, 1996, pp. 701-709. doi:10.1016/S1350-4487(97)82884-3
- M. S. A. Rasheedy, “New Evaluation Technique for Analyzing the Thermoluminescence Glow Curve and Calculating the Trap Parameters,” Thermochimica Acta, Vol. 429, No. 2, 2005, pp. 143-147. doi:10.1016/j.tca.2005.03.006
- G. Tanır and M. H. Bolukdemir, “An Alternative View on the Kinetics of Optical Stimulated Luminescence Decay,” Journal of Radioanalytical and Nuclear Chemistry, Vol. 285, No. 3, 2010, pp. 563-568. doi:10.1007/s10967-010-0553-1
- G. A. Tanır and M. H. Bolukdemir, “Application of Active-OSL Approximation to Some Experimental Optical Stimulated Luminescence Decay,” Turkish Journal of Physics, Vol. 35, 2011, pp. 265-272.
- D. Curie, “Luminescence in Crystals,” Wiley, New York, 1963. doi:10.1051/jphys:01963002406035300
- M. S. Akselrod, A. C. Lucas, J. C. Polf and S. W. S. McKeever, “Optically Stimulated Luminescence of Al2O3,” Radiation Measurements, Vol. 29, No. 3-4, 1998, pp. 391- 400. doi:10.1016/S1350-4487(98)00061-4
- G. Kitis, I. Liritzis and A. Vafeiadou, “Deconvolution of Optical Stimulated Luminescence Decay Curves,” Journal of Radioanalytical and Nuclear Chemistry, Vol. 254, No. 1, 2002, pp. 143-149. doi:10.1023/A:1020862102754
- Y. Kirsh and R. Chen, “Analysis of the Blue Phosphorescence of X-Irradiated Albite Using a TL-Like Presentation,” Nuclear Track Radiation Measurements, Vol. 18, No. 1-2, 1991, pp. 37-40. doi:10.1016/1359-0189(91)90089-Z
- F. O. Ogundare, F. A. Balogun and L. A. Hussain, “Evaluation of Kinetic Parameters of Traps in Thermoluminescence Phosphors,” Radiation Measurements, Vol. 41, No. 7-8, 2006, pp. 892-896. doi:10.1016/j.radmeas.2006.06.014
- E. Bulur, “A Simple Transformation for Converting CW-OSL Curves to LM-OSL Curves,” Radiation Measurements, Vol. 32, No. 2, 2000, pp. 141-145. doi:10.1016/S1350-4487(99)00247-4
- I. K. S. Krane, “Introductory Nuclear Physics,” John Wiley and Sons, New York, 1988, p. 161.
- N. A. Spooner, M. A. Aitken, B. W. Franks and C. McElroy, “Archaeological Dating by Infrared Stimulated Luminescence Using a Diode Array,” Radiation Protection Dosimetry, Vol. 34, No. 1-4, 1990, pp. 83-86.
- M. S. Akselrod, L. N. Agersnap, V. Whitley and S. W. S. McKeever, “Thermal Quenching of F Centre Luminescence in Al2O3:C,” Radiation Protection Dosimetry, Vol. 84, No. 1-4, 1999, pp. 39-42. doi:10.1093/oxfordjournals.rpd.a032763
- S. W. S. McKeever and R. Chen, “Luminescence Models,” Radiation Measurements, Vol. 27, No. 5-6, 2007, pp. 625-661. doi:10.1016/S1350-4487(97)00203-5
- E. Bulur, L. Botter-Jensen and A. S. Murray, “LM-OSL Signals from Some Insulators: An Analysis of the Detrapping Probabilty on Stimulation Light Intensity,” Radiation Measurements, Vol. 33, No. 5, 2001, pp. 715-719. doi:10.1016/S1350-4487(01)00089-0
NOTES
*Corresponding author.