American Journal of Operations Research
Vol.3 No.1(2013), Article ID:27515,23 pages DOI:10.4236/ajor.2013.31003
Balanced Scorecard and Efficiency: Design and Empirical Validation of a Strategic Map in the University by Means of DEA
Department of Finance and Accounting, University of Cádiz, Cádiz, Spain
Email: teresa.garcia@uca.es
Received November 27, 2012; revised December 28, 2012; accepted January 14, 2013
Keywords: Balanced Scorecard; Efficiency; Data Envelopment Analysis; University
ABSTRACT
The principal objective of the research reported in this article is to validate a Balanced Scorecard (BSC) model and a Strategic Map for the University by studying the relationships of efficiency between its dimensions. Subsequently, the validation is completed by establishing hypotheses of efficiency relationships between the perspectives proposed, employing Data Envelopment Analysis (DEA). Empirical evidence has been obtained on the validity of the proposed BSC for a unit of academic management in the university. The first contribution of this work is the establishment of a framework of analysis of the hypothetical cause-effect relationships in the BSC in university institutions. The second contribution is to obtain the determining factors of the performance in this type of institution and, therefore, the Strategic Map. Specifically, these factors are: the participation of teaching staff in innovation activities; the number of doctorate-level staff; the academic subjects and credits in the Virtual Campus; and the scores in the surveys of student satisfaction. With respect to research, the determining factors of the performance are: the research sexennials; the funding obtained from contracts with companies; the number of research projects obtained; their financing; and the participation of teachers in these projects.
1. Introduction
Evaluation of the performance of public management is central to the concerns of decision-makers in public institutions, particularly in the universities. Demands for the optimization of efficiency and effectiveness in the use of resources, and for generating and strengthening the mechanisms of transparency and accountability to the users of publicly-funded services, and to the associated interest groups, are the basic reasons that have driven government at various levels to give priority to the development of systems of measurement and performance indicators in the Institutions of Higher Education.
One of the methodologies that can be used for measuring performance is the system known as the Balanced Scorecard (BSC). However, despite the abundant literature, there are few references to its development and practical implementation in universities, where the activities of research and teaching are both considered to be strategic activities, for the individual academic Departments and for the University as a whole. Moreover, there are very few studies in the literature on management control in the public sector, in which relationships are established between the returns from these activities, measured using the BSC, and the efficiency with which they are performed. For this reason, the first objective of this study is to put forward a framework for the analysis of these relationships, in which one endpoint is to establish the factors that determine performance or returns in the Universities; for this we focus on academic units, i.e. on the University Departments.
The indicators utilized in the analysis of efficiency have been extracted both from the current public financing model for the universities of Andalusia, Spain, and from the models of Program Contracts agreed between the Departments and the Rector’s Office of the University of Cádiz, in Spain. We employ the DEA (Data Envelopment Analysis) method for this analysis of efficiency.
We have structured this paper in two main parts: in the first part, we analyse various previous experiences of developing and implementing the BSC in the University, and the measurement of efficiency by means of DEA; in the second part, we present the objectives of the study and the methodology employed both in the development of the model proposed and in the determination of the levels of efficiency in research and teaching. Lastly, the results obtained are analyzed and the conclusions are presented.
2. The Balanced Scorecard as an Instrument of Measurement of Performance in the University
The need to measure the performance of the activities carried out in universities is demonstrated by the multitude of indicators used in practice and suggested in the specialist literature, among others. The fundamental problem lies in the lack of consensus on the choice of a single system of measurement or set of indicators as the most appropriate for measuring these activities. On this point there is clear evidence regarding the widespread discontent of those responsible for running universities about the performance measurements currently in use; one reason for this discontent, among others, is that proper account is not taken of the persons affected by the implementation of these performance measurement systems [1]. Another reason is that the measurements proposed tend to be defined very narrowly, for measuring such a complex concept; they are centred too much on short-term factors, and important longer-term matters are ignored. With respect to the measurement of the university performance by means of indicators, [1] have conducted a survey among those with the highest level of responsibility for universities in Spain; those authors have reached a conclusion on which indicators are the most valued and most frequently employed in the task of internal assessment of the institution, not only by those surveyed but also by the external evaluating agencies in this country. That study has been of considerable assistance to us in the final choice of the indicators proposed for the BSC in the University, although we have modified the strategic perspective, drawing on the model used for the financing of the public universities of Andalusia.
Perhaps one very important factor in explaining the proliferation of different performance measurements in the University, and the lack of consensus on these, is that, while it is recognized that the two main areas of activity, teaching and research, should be aligned with the strategy of the Institution [2-5], in practice, few contributions have been published in respect of the measurement of academic research output that display its full complexity and show how it can, in fact, be aligned with the strategy of the organisation.
To avoid this situation it is necessary to establish measurements that permit both the processes by which R & D activities are carried out and the results of those processes to be evaluated. In recent years, the Balanced Scorecard (BSC) has not figured very prominently in studies of the context of activities of this type, even given the clear need for management tools that would enable managers to control the resources and results achieved by the universities, from a strategic rather than a merely operating perspective. In other words, as a general rule, after studying the indicators proposed in the literature and applied in practice, many authors have concluded that integrated measurements of output are needed, owing to the complexity of the concept to be measured [6,7].
Deploying the BSC for the Departments of a university will help to achieve the integration of the planning with the strategy of the institution. [5] reviewed the literature and reports on measurements of R & D performance; they advised the joint use of traditional techniques of measurement of returns focussed on controlling the costs of this type of activity, with strategic measurements in the longer term. For this process of integration, the application of a BSC is suggested.
[8] analysed eight organisations in the USA and Canada that are leaders in scientific research, with the object of identifying the attributes that define quality of management in research units or departments. Their approach was based on the BSC model of [9], since the authors consider the BSC to be a starting point for identifying the attributes of organisations of high performance in research; however, they modified the four dimensions established by [9], to adapt them to a typical research organisation; thus the adaptation or transition would be as shown in Figure 1.
Starting from the four dimensions that encompass those established by [9] the authors obtained ten attributes that characterise high-performance research organisations; this was done by taking into account those attributes that the managers of the eight companies leaders in research considered to be important, observable and measurable: People, Leadership, Management, Organizational Performance.
With respect to the preceding attributes, universities, as organisations based on the generation of knowledge, increasingly attend to their human resources and to their leaders, and increasingly manage more efficiently the resources necessary for research. These three attributes are related positively to enhanced performance in institutions dedicated to research, as proposed by [8].
[10] justify the need to implement a BSC model in various organisations, among them universities, by the major changes that have taken place in recent years. The rate of growth seen in university departments has been spectacular, with the result that problems of visibility are being generated. Those responsible for policy feel that the basic decisions that were taken relatively easily years ago have now become extraordinarily difficult. In the opinion of [10], when there is a lack of visibility from the top down, problems are created from the bottom up; this
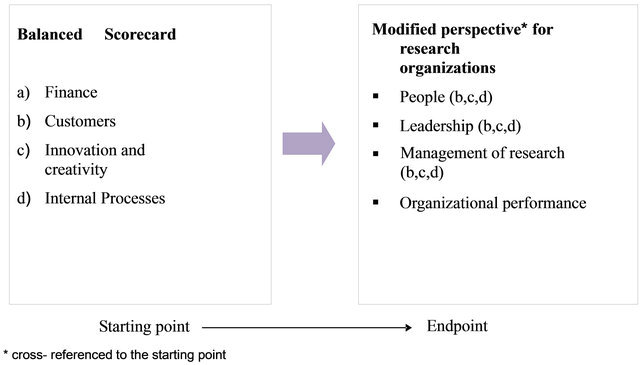
Figure 1. Transition of the BSC to the dimensions adapted for research organisations [8].
is because, from the operating level, it is difficult have a clear strategic vision of the organisation and its objecttives. This has generated problems for the measurement of performance in the universities. The response necessary to this crisis is to strive for better management of both teaching and research activities; a need exists for Departments to be accountable for their activities, and for their operational objectives to be focussed on contributing to the strategy of their parent Institution, to enable the decision-makers to identify and justify the rewards for these activities.
When the BSC is established as an integral part of university management, it is an effective tool for setting-up and making operational the culture of quality and enhanced performance in all the activities undertaken by these public entities (see, for example, [11-17]). The BSC has already been implemented successfully in many educational institutions [18-20].
From the review conducted on the measurement of performance of teaching and research activities in the university, and the models used for this, the literature points to the lack of definition of the institution’s strategy in the planning of these activities; the BSC is put forward as the instrument that would help to achieve this objective. We certainly find a lack of homogeneity in the consideration of the relevant indicators of performance, since each university develops them in a different way, making it materially impossible to undertake any type of research that relates the advantages of the use of this technique with other parameters that could be available to those concerned. However, in the Autonomous Region of Andalusia, in Spain, there exists a set of indicators incorporated in the financing model of the Junta de Andalucía [21], which is employed for the distribution of the region’s total budget among all 10 of the public universities of Andalusia. This model is reviewed in the part 4 of this study.
The validation of content of the BSC employed has enabled us to measure the relationships of efficiency between the four perspectives of the BSC; the applications of this particular aspect found in the literature are commented on in part 3 of the paper.
3. Measuring and Relating Efficiency to the Balanced Scorecard
In the field of Higher Education, the use of management indicators, in addition to the customary economic and financial indicators, is currently restricted to a few other significant variables (several insufficient variables refer to the students, teaching staff, graduates, infrastructures, and work teams in general). In the light of this, the adoption of the BSC implies advancing in decisions not only to use indicators for the measurement of what is tangible, evident and objective (and to do this in a rigorous and complete way), but also to develop measurements of those factors that are to some extent intangible, specific to academic activities and, particularly, to science, technology and innovation [22-24]. In short, the utilization of BSC as a methodology of management of indicators promotes self-regulation and positive feedback for the whole system of performance assessment that may be implemented.
There are relatively few examples of the development and setting up of the BSC for measuring the output or results of teaching and research activities; but there are even fewer studies dealing with the relationship of the BSC with measures of efficiency in carrying out these activities. As has been demonstrated in this study, although the success of these types of activity must be measured multi-dimensionally, a deeper analysis of the factors determining success is necessary and the study must be widened to include other variables that are crucial for these organisations: efficiency.
The concept of efficiency, when translated to university activities, presents the same difficulties as those noted in respect of measuring its performance. In this case, efficiency should be identified with success in the achievement of the objectives and results pursued by these institutions in carrying out their teaching and research activities, but these objectives and results need to be related to the optimum allocation of the corresponding human and material resources. In performing these activities, a series of inputs are consumed; didactic and scientific processes are carried out, and a series of outputs are obtained, derived from these inputs and processes, which are essential for the growth and success of the organisation.
However, in this study we wish to expand the concept of efficiency and relate it to those perspectives of the BSC that are associated with the final results, on the one hand, and with the drivers or inputs of those results, ultimately, on the other. Therefore, what we understand by efficiency is the relationships that hypothetically should apply between the perspectives of the BSC: the final results (Financial and Users), related to their corresponding inputs (Internal Processes and Learning and Growth). Hence, following the reasoning of cause-effect relationships that underlies the BSC concept, we consider it appropriate to measure the internal efficiency of the process by relating, in a separate model of efficiency, the two perspectives of internal processes and of learning and growth.
From a review of the literature on the subject, we find that the assessment of efficiency has been approached from various different points of view. Thus, efficiency is normally measured with the object of determining whether the services provided by an organisation have been produced at a reasonable cost and with the maximum quality possible [25]. With respect to the evaluation of the efficiency of research activities using the DEA model, the relevant studies are those by [26,27], in which a methodology for the selection of R & D projects is developed and utilised. In this context, in the study of [28], an illustration is given of how DEA can be employed by companies for the analysis, ranking and selection of R & D projects. Cook and Green by reference [29] also apply DEA in the selection of R & D projects, considering resources as the limiting factor.
Another important part of the literature on efficiency in performing R & D concerns the utilisation of the DEA model to determine the factors related to inefficiency in R & D activities, starting from the key success factors in activities of this type, and the resources employed in carrying out these activities. On this point, it is found that most of the studies have been conducted in the framework of public research centres, [30-32], but few in companies. In the study of [33], the result of the performance of the BSC is evaluated by calculating different ratios of efficiency by means of DEA, but in no case have previous authors validated the content of the BSC employed, nor have they orientated it to university activities.
Of the various studies analysed in the literature on DEA and BSC, the work of [34] comes closest to the objectives of the study described here. In that study, after validating the content of the BSC, the efficiency relationships between the proposed perspectives in the validated BSC are analysed employing DEA; and a framework for the analysis of the hypothetical cause-effect relationships in the BSC is established.
With respect to the studies that relate the BSC and efficiency by means of DEA, some very recent studies are found applied to various sectors of industrial activity, and also to the public sector. However, there are very few articles in the literature on management accounting; some can be found that evaluate, in a very general way, the suitability of the BSC [33] or that correlate efficiency and performance [35-37].
Nevertheless, we have reviewed the most important and recent studies that combine the BSC and DEA, in order to devise our proposed validation method. These studies increasingly report the utilization of DEA in the measurement of performance by means of the indicators of the BSC. In this context, it is not crucially important whether or not a production function is used in the measurement of performance, since it concerns an empirical production function. The studies on which we have based our approach apply to various different sectors of activity, in particular the studies of [38-56].
With respect to Institutions of Higher Education, the most significant studies that relate efficiency by means of BSC and DEA are those of [57,58]. These two studies describe the integral monitoring and control of teaching programs in universities employing BSC and DEA. In particular, in the work of [59], this methodology is applied in the integral control of the management of Programs in Schools of Engineering in Colombia. The efficiency of the teaching processes is measured by means of DEA, and the best practices are identified, together with directions for the improvement of each teaching course, and reference values for the strategic variables that are incorporated in the proposed BSC.
4. Empirical Validation of a BSC Model for the University
One of the principal objectives of this study is the design and empirical validation of a model BSC for application in universities, with the object of establishing the factors that determine or affect the performance of the universities of Andalusia, and the nature of the relationships between the different indicators that comprise the BSC developed (i.e. the Strategic Map). Rather than attempt to measure an entire university, or even an entire faculty, we have decided to take as our basic unit the Department, which is the academic unit “par excellence” in terms of the organisation of activity. To meet this objective, and given the linkage in the universities of Andalusia between performance in Teaching and Research and the financing received, we have taken the indicators currently employed in the model now in force for financing the universities of the Autonomous Region of Andalusia, and have incorporated these indicators into the structure of a proposed BSC model. Subsequently, to check that this model is valid, we have utilized the DEA method of measuring efficiency. In this part of the paper the objectives, method and results obtained in the process of validation of the BSC for the University are presented.
4.1. Objectives of the Study
To achieve the objective of this study, the validation of a BSC model for teaching and research in universities, we study the relationships between the dimensions of the BSC by developing various different efficiency models, and start from the following sub-objectives:
Validation of the content of the BSC model by means of the identification of the principal dimensions and elements of the BSC. The indicators already employed in the model for the financing of the universities of Andalusia, and those used in the Program Contracts agreed in the particular university studied (Cádiz), have been appropriately assigned to the various perspectives of the BSC model proposed, in respect of both the individual departments and the universities in general.
Measurement of the efficiency of the teaching and research activities carried out, using DEA. This sub-objective consists in establishing, starting from the hypothetical cause-effect relationships between the perspectives of the BSC, the various efficiency models to be studied.
4.2. Validation of Content of the Balanced Scorecard
In the process of validation of content of the BSC, one of the phases of the complete methodology on validation of scales, the validation of content, will be applied, and for this the following stages will be considered:
First stage: A bibliographic review was done, from which we were able to identify the appropriate dimensions and indicators, based on the four perspectives of the BSC. Each group of empirical indicators was assigned to the corresponding perspective of the BSC: the Financial, Users, Internal Processes, and Learning and Growth Dimensions.
Second stage: These indicators have already been validated for all the universities of Andalusia, since they form part of the reports currently employed for determining the distribution of the total budget among the institutions.
4.3. Dimensions of the Balanced Scorecard
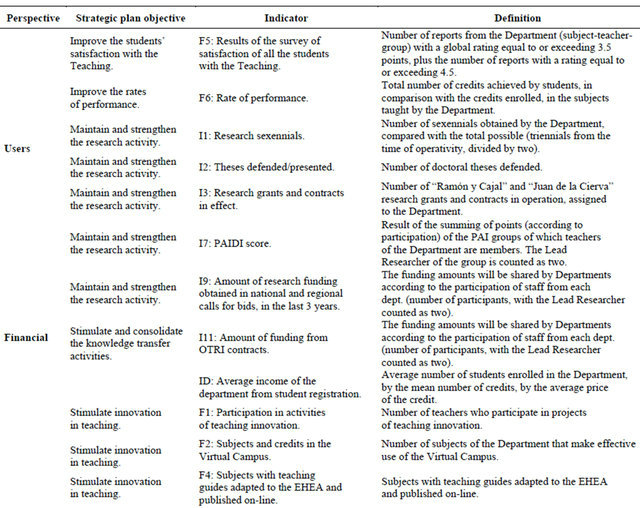
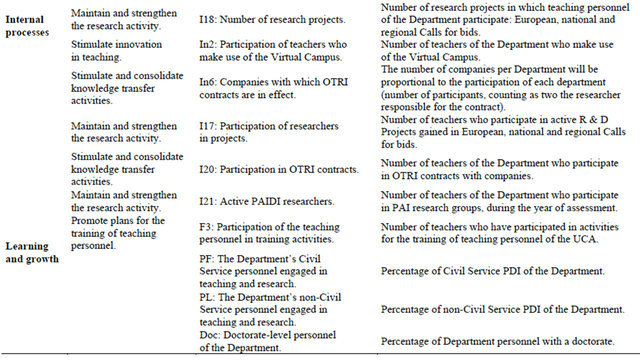
In accordance with the literature on management control in universities, we put forward the following BSC for the Departments of the University of Cadiz (From the Figure 2 we can see the BSC for teaching and the Figure 3 represent the BSC for research), specifically for all 47 Departments. The definition of each of these indicators is given in the Annex 2.
Financial Perspective: Strategies and lines of action aimed at improving the financial situation of the University, the image of the institution, its relationships with the local community and society in general, and external communication.
Perspective of the Users: Strategies and lines of action directed towards activities in the university’s various different “markets”, such as: expansion of our field of action, loyalty to the users of our services, and increasing their satisfaction with these services. Achieving the strategic objectives at this level will contribute to achieving the objectives of the Financial perspective.
Perspective of Internal Processes: Strategies and lines of action aimed at improving all the internal processes in the functioning of the institution. Having first identified the needs of employers, students, all the other users of the services provided, including the local community and society, the university must improve its provision of products and services, the processes by which its teaching and research activities are organized, and processes for the management of the institution and its activities. Achieving the strategic objectives at this level will contribute to achieving the objectives of the Users perspective.
Perspective of Learning and Growth: Strategies and lines of action aimed at improving the human and material resources, the competences and motivation of the personnel, and the working climate in general. These lines of action will form the basis for the achievement of the strategic objectives of the perspective of Internal Processes, since optimizing the human and material resources and the competences of the personnel will contribute to improving how the institution functions, i.e. all its internal processes.
5. Validation of Criterion of the BSC
5.1. Objectives
The next objective of this study is to validate the BSC model, and to establish the theoretical hypotheses in respect of the model. The results of the application of the
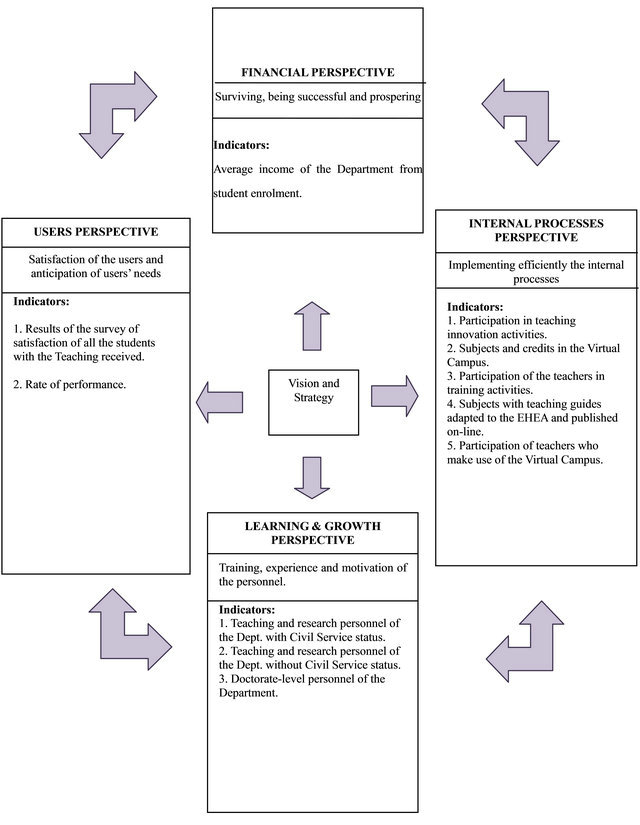
Figure 2. Balanced scorecard for teaching (adapted from the model of financing of the public universities of andalusia (2007-2011) [21].
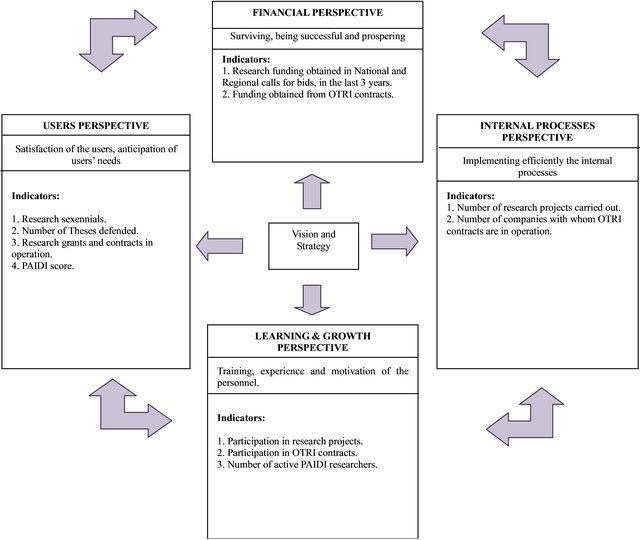
Figure 3. Balanced scorecard for research (adapted from the model of financing of the public universities of andalusia (2007-2011) [21]).
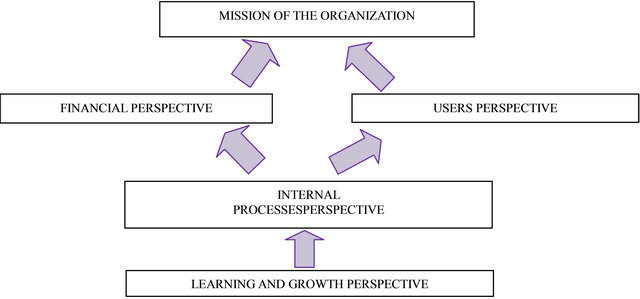
Figure 4. Balanced scorecard model proposed by [9] for public institutions.
BSC, together with the foreseeable results that the departments will achieve in the Financial and Users perspectives if they develop and achieve good results in the Internal Processes and Learning and Growth perspectives, leads us to propose the following efficiency models. From the Table 1 we can see the Efficiency Models for Teaching and Research.
First model (US + FI-IP): the objective is to measure the efficiency obtained by the Departments analyzed, considering the indicators of the Users and Financial perspectives as results (or outputs), and the indicators of the Internal Processes perspective as inputs.
Second model (IP-LG): in this model the performance achieved in the Internal Processes of teaching and research activities is related to the efficiency of the human and material resources employed. The indicators measured in the perspective of Internal Processes are considered as indicators of results, i.e. as output, while the indicators of the Learning and Growth perspective are taken to be the motors driving those results, i.e. as the inputs Lastly, to complete the circular analysis, in the third model (US + FI-LG), the efficiency is evaluated by relating the results achieved in the Financial and Users perspectives (as output) to the Learning and Growth perspective, the human and material resources employed in the teaching and research activities (as inputs).
We combine the Users and Financial perspectives following the model proposed by [9] for the public sector, on the grounds that the Financial perspective complements that of the Users (as we can see in the Figure 4) since the goal of the organisation in question is not to maximize profits but to provide services of high-quality, with efficacy and employing the minimum amount of resources. Improvements in the training, experience and motivation of the personnel lead to improvements in the way that the internal processes of the university function. Conversely, however, the improvement of these processes does not lead to an improvement in the satisfaction of the shareholders (the main objective of the financial perspective in the traditional BSC model proposed for a company); instead, such improvements in the capacities of the personnel lead to improvement in the capturing of finance for research or for university teaching through student enrolments registration. But these latter improvements lead, in turn, to improvements in the results for the users at both the teaching and research levels.
Hypotheses:
The development of these efficiency ratios will enable us to test the following hypotheses, which, in turn, would enable us to validate the BSC developed in this study:
H1: The Departments that maximize their efficiency values in Teaching in the IP-LG model also maximize the efficiency values in the US + FI-IP model.
H2: The Departments rated as efficient in Teaching in the IP-LG and US + FI-IP models are also rated as efficient in the US + FI-LG model.
H3: The Departments that maximize their efficiency values in Research in the IP-LG model also maximize the efficiency values in the US + FI-IP model.
H4: The Departments rated as efficient in Research in the models IP-LG and US + FI-IP are also rated as efficient in the US + FI-LG model.
5.2. Methodology
Presented in Figure 5 are the elements and indicators of the BSC designed. For their validation we have employed the methodology based on the development of non-parametric boundaries of production, known as the DEA model. This method provides an assessment of efficiency by means of the comparative study between the inputs and outputs obtained by each unit (e.g. each department) to be evaluated. This type of analysis can be performed provided the units consume the same types of input in order to obtain the same types of output.
For each unit the model makes a transversal comparison of the various inputs and outputs of each of the efficiency models proposed, against all the other units. Each unit is evaluated by comparing it with the rest of the units
Table 1. Efficiency models for teaching and research.
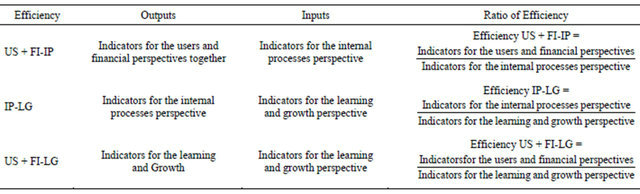
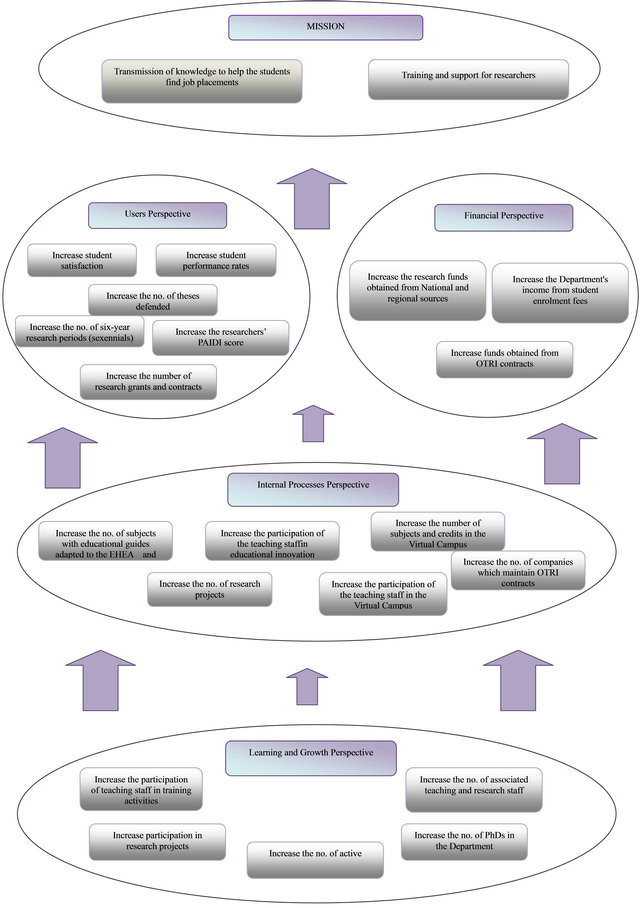
Figure 5. BSC strategy map for the departments of the University of Cádiz.
studied, and from this an indicator of relative efficiency is obtained.
DEA is a method of estimation that traces the outer boundary for the set of data observed. The points on this boundary represent the units that reachvalues of efficiency equal to 1 in relation to the set, whereas those units that do not reach this boundary, with values of less than one, are considered inefficient.
The formulation of this model in the form of fractional programming [59] is as follows:
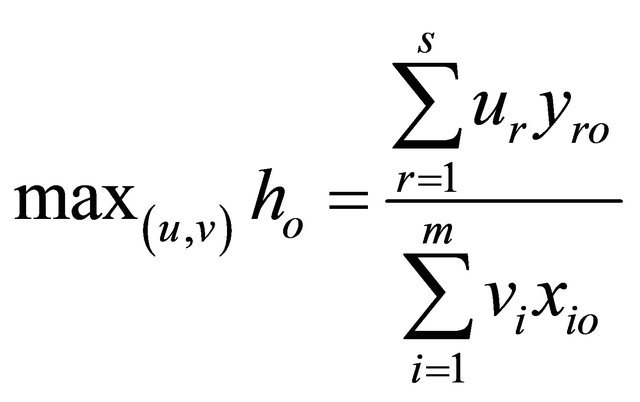 (1)
(1)
Subject to:
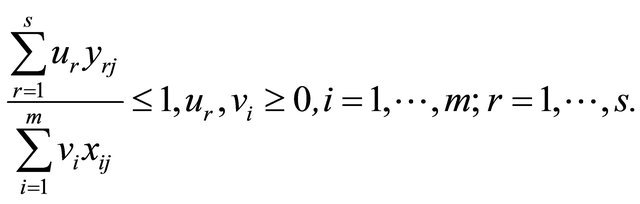
where yrj and xij are, respectively, the observed values of the outputs and inputs of the “j” units of the sample; yro and xio are the observable values of the unit being tested; the weighting variables, or solutions of the model, would be ur for the outputs and vi for the inputs. The optimisation produces a set of positive or null values, denominated  and
and , that will generate the optimum
  1 only if the unit evaluated is efficient. Thus, the objective function will always take values between 0 and 1 for the various units studied; the closer the value is to 1 the more efficient the unit will be.
The formulation of the model employed in this study corresponds to the model of [59], orientated to the input.
 (2)
(2)
Subject to:
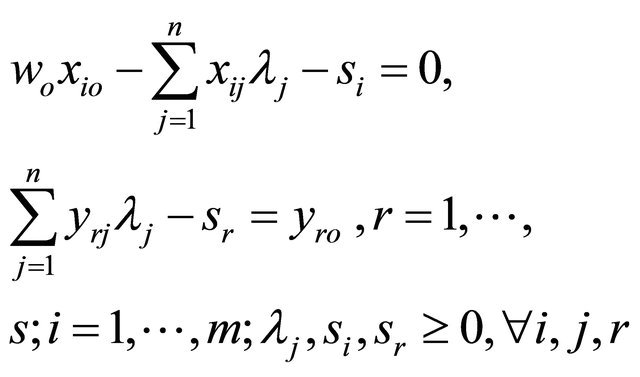
where yrj and xij are, respectively, the observed values of the outputs and inputs of the various Departments of the University; yro and xio are the values of the Unit that we are testing.
The optimisation produces a set of positive or null values that we denominate  and
and , which will generate the optimum
  only if the Department evaluated is efficient. Thus, the objective function will always take values between 0 and 1, for the different units studied.
In our study we employ the information related to the scores of efficiency or inefficiency (ho) in Equation (1), and the weightings that the model assigns to each indicator, whether of output (ur) or input (vi). These two solutions enable us, first, to situate the Department with respect to the sample analysed using the BSC; and, second, to determine the factors that affect most significantly the changes of efficiency in each perspective. Further, with the object of studying the association between the perspectives of the BSC, we analyse the relationship between the efficiency ratios corresponding to the different models described; we utilize the momentproduct correlation coefficient of Pearson and study the better-related perspectives by means of exploratory factorial analysis.
The general procedure is as follows:
The first model (US + FI-IP) is formed, for the case of the output, by the indicators of the of Users and Financial perspectives; specifically, these indicators are: the results of the survey of satisfaction of all the students with the Teaching; the rate of return; research sexennials; theses defended; research grants and contracts in effect; score of the Andalusian research group; amount of research funding obtained in National and Regional calls for bids, in the last 3 years; amount of funding from OTRI contracts; and average income of the Department from student registration. For the case the inputs, the indicators are those included in the perspective of Internal Processes, which are: participation in activities of teaching innovation; subjects and credits in the Virtual Campus; subjects with teaching guides adapted to the EHEA and published on-line; number of research projects; participation of teachers who make use of the Virtual Campus; and companies with which OTRI contracts are in operation.
The second model (IP-LG) is formed, for the case of the output, by the indicators of the perspective of Internal Processes; specifically, the indicators are: participation in activities of teaching innovation; subjects and credits in the Virtual Campus; subjects with teaching guides adapted to the EHEA and published on-line; number of research projects; participation of teachers who make use of the Virtual Campus; and companies with which OTRI contracts are in operation. For the case of the inputs, the indicators included in the perspective of Learning and Growth are: participation in research projects; participation of the teaching personnel in training activities; participation in OTRI contracts; researchers active in the research groups; the Department’s civil service personnel engaged in teaching and research; the Department’s noncivil service personnel engaged in teaching and research; and doctorate-level personnel of the Department.
With respect to the third model (US + FI-LG), the outputs are formed by the indicators of the Users and Finance perspectives, which are: the results of the survey of satisfaction of all the students with the Teaching; the rate of return; researchsexennials; theses defended; research grants and contracts in effect; score of the Andalusian research group; amount of research funding obtained in National and Regional calls for bids, in the last 3 years; amount of funding from OTRI contracts; and average income of the Department from student registration. The inputs are the indicators of the perspective of Learning and Growth: Participation in research projects; participation of the teaching personnel in training activeties; participation in OTRI contracts; researchers active in the research groups; the Department’s civil service personnel engaged in teaching and research; the Department’s non-civil service personnel engaged in teaching and research; and doctorate-level personnel of the Department.
This can be seen schematically in Figure 6, which shows the dimensions and elements of the BSC for Teaching and Research in University Departments, and the associated efficiency models.
6. Results
To determine the relationship between the various efficiency models we analyse the frequency of efficiency values obtained, ranging from 1, signifying maximum efficiency, to less than 1, signifying decreasing efficiency, i.e. relative inefficiency. These data are presented in Table 2 for Research, and Table 3 for Teaching.
Tables 4 and 5 present the correlations between the efficiency models for research and teaching, for the 2007/2008 and 2008/2009 courses. As can be observed in the Table 4, a correlation exists between the three efficiency models analysed. In the 2007/2008 course the relationships between the IP-LG and US + FI-LG models are notable. This means that those Departments that have been efficient in the US + FI-LG model have also been efficient in the utilization of their human and materials resources, which has resulted significantly in the improvement of the internal processes in research (IP-LG model). For the 2008/2009 course the correlations are higher, and the relationship between the US + FI-IP model and the US + FI-LG model is notable. To corroborate the above results, the factorization method of principal components analysis has been applied.
The results for the Research efficiency models are presented in the Table 6 for the 2007/2008 and 2008/2009 courses; and for the Teaching efficiency models in the Table 7 for the 2007/2008 and 2008/2009 courses. The Table 8 present the weight of the rotated factor (Factorial Analysis) for the Teaching efficiency models in 2007/ 2008 and 2008/2009 courses. What stands out is the existence of one single factor common to the three Research efficiency models. These results confirm that the factor F1, in both cases, binds together the three models, with values exceeding 0.5. For the 2007/2008 course, this factor explains 51.163% of the variance as we can see in the Table 9 and for the 2008/2009 course, 60.935% of the variance, as we can see in the Table 10. This confirms the hypotheses formulated, and would signify the empirical validity of the BSC model proposed.
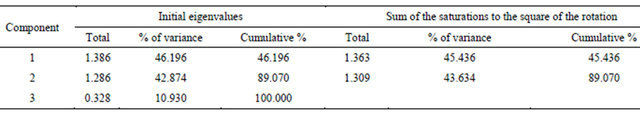
Table 5 presents the correlations between the efficiency models for teaching, for the 2007/2008 and 2008/ 2009 courses, respectively. It can be observed that, for the two courses studied, a correlation exists between the three efficiency models. The inverse relationship existing between the IP-LG and US + FI-IP models, for both courses, is significant; those Departments that have employed their resources available in the Learning and Growth perspective to improve their Internal Processes do not have to behave more efficiently in the model that relates these same resources with the results obtained in the Users and Financial perspectives. To corroborate these results a factorial analysis of principal components is applied, rotating the factors and transforming the solutions using the Varimax method of rotation. Two factors are obtained (Table 8) for the 2007/2008 course that explain 91.588% of the variance (Table 11).
The first of the factors binds together the IP-LG, US + FI-LG and US + FI-IP models, as we can see in the Table 8. This means that those Departments that employ more efficiently their resources in Learning and Growth to improve their Internal Processes also employ them to improve the satisfaction of their Users and their Financial performance. A second factor, which only binds the first model, US + FI-IP, indicates that, in Teaching, the performance of efficient teaching processes is as important as, or more important than, the level of training of the teachers or their profile. For the 2008/2009 course two factors are also obtained in the Table 8 that explain 89.070% of the variance, as we can see in the Table 12. In this case, the first factor binds together the IP-LG and US + FI-LG models, as is also found for the previous course; however, in this case the models correlated by second factor are different. In particular, a closer correlation is obtained between the efficiency of the Departments in the US + FI-IP and US + FI-LG models. In this case, the three perspectives remain perfectly related, which confirms our working hypotheses: correlation exists between the three efficiency models proposed in this study, which provides evidence of the empirical validity of the BSC proposed for university departments.
With the values of the above weightings, the factors can be obtained that affect each of the measurements of performance in each dimension of the BSC for the university
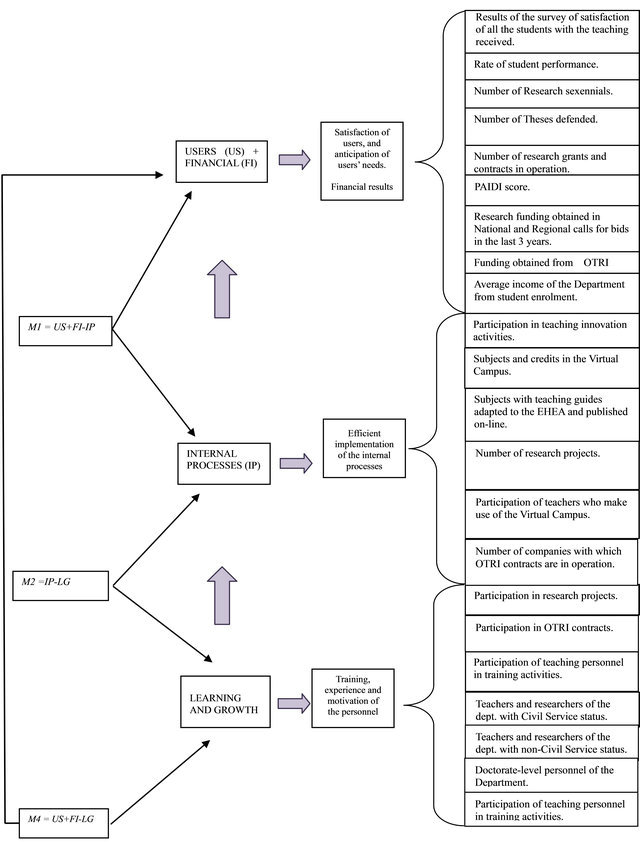
Figure 6. Efficiency model in four phases according to the dimensions, elements and indicators of the BSC.
Table 2. BSC for research: efficiency values for each model analyzed (table of frequencies).
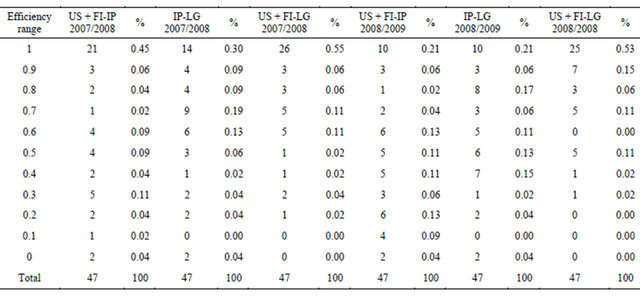
Table 3. BSC for Teaching: efficiency values for each model analyzed (table of frequencies).
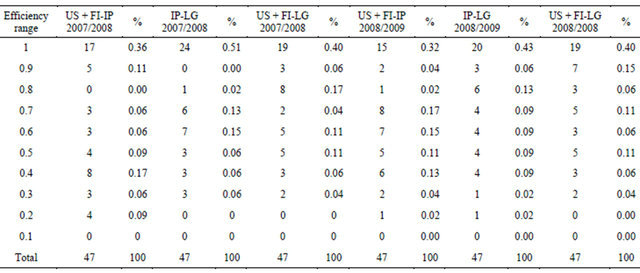
Table 4. Matrix of correlations of the research efficiency models, 2007/2008 and 2008/2009 courses.
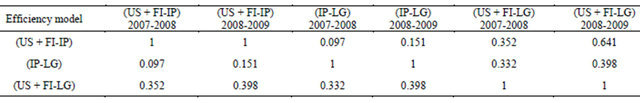
Table 5. Matrix of correlations of the teaching efficiency models, 2007/2008, 2008/2009 courses.

Table 6. Factor weight (factorial analysis) for the research efficiency models, 2007/2008, 2008/2009 courses.
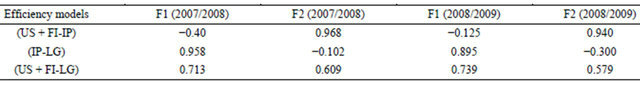
Table 7. Factor weight (factorial analysis) for the teaching efficiency models, 2007/2008, 2008/2009 courses.
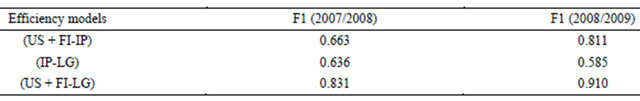
Table 8. Weight of the rotated factor (factorial analysis) for the teaching efficiency models, 2007/2008, 2008/2009 courses.
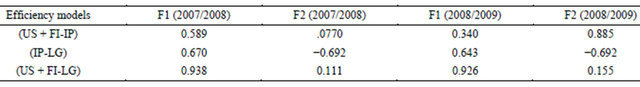
Table 9. Total variance explained by the factors for the research efficiency models, for the 2007/2008 course.
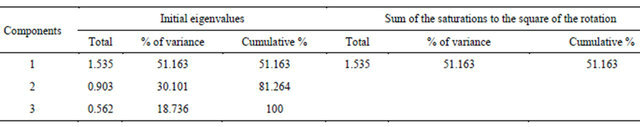
Table 10. Total variance explained by the factors for the research efficiency models, for the 2008/2009 course.
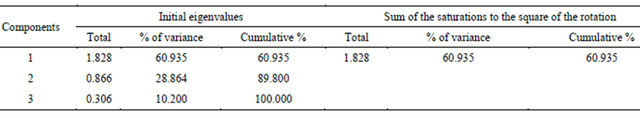
Table 11. Total variance explained by the factors for the teaching efficiency models, for the 2007/2008 course.
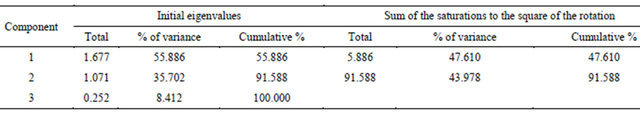
Table 12. Total variance explained by the factors for the teaching efficiency models, for the 2008/2009 course.
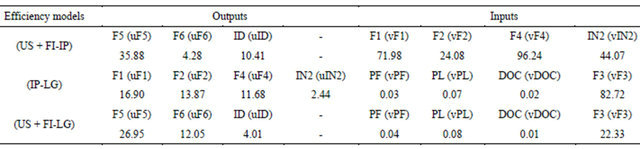
departments. The factors that add more efficiency in each dimension have been extracted of the information provided by the weights assigned by the DEA to the outputs and inputs in each model developed, in this case for each perspective of the BSC. The specific output variables with most weight (ur)—Equation (1)—in each model, and the input variables with least weight (vi)—Equation (1)—in each model have been considered. We can see these factors in the Tables 13-16.
The determining factors of the performance in Teaching in the university departments are: (IP-LG model): F1, F2, DOC; (US + FI-IP model): F5, F2; (US + FI-LG model): F5, DOC.
F1: Participation in activities of teaching innovation.
Doc: Doctorate-level personnel of the Department.
F2: Subjects and credits in the Virtual Campus.
F5: Results of the survey of satisfaction of all the students with the Teaching.
The factors that determine the Research performance in the university departments are: (IP-LG model): I8, I21, I17; (US + FI-IP model): I9, I17, I7, In6; (US + FI-LG model): I1, I11, I7, I20.
Table 13. Average weights of the indicators of the research efficiency models, for the 2007/2008 course.
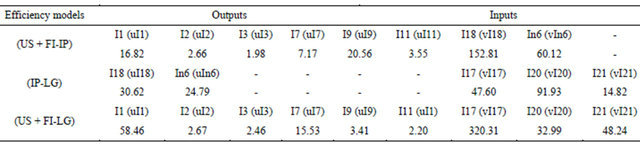
Table 14. Average weights of the indicators of the research efficiency models, for the 2008/2009 course year.
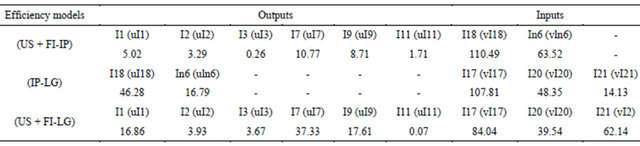
Table 15. Average weights of the indicators of the teaching efficiency models, for the 2007/2008 course.
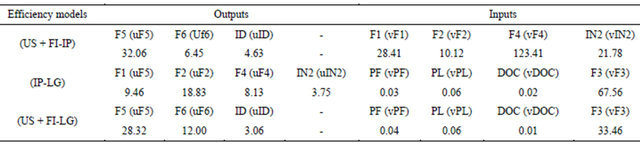
Table 16. Average weights of the indicators of the teaching efficiency models, for the 2008/2009 course.
I1: Research sexennials.
I11: Funding from OTRI Contracts.
I18: Number of research projects.
I21: Active PAIDI researchers.
I9: Research funding obtained in National and Regional calls for bids, in the last 3 years.
I7: PAIDI score.
I17: Participation in research projects.
I20: Participation in OTRI contracts.
In6: Companies with which OTRI contracts are in operation.
Using all the preceding information, the Strategic Map for the Departments of a public university in Spain has been developed and validated. Represented in the Figures 7 are the Strategic Maps for Teaching and Research efficiency, included in which are the factors that determine efficiency in each perspective, the weights for each indicator obtained by means of DEA, and the relationships between each of these factors.
7. Conclusions
The objective of this study is to validate a BSC model for
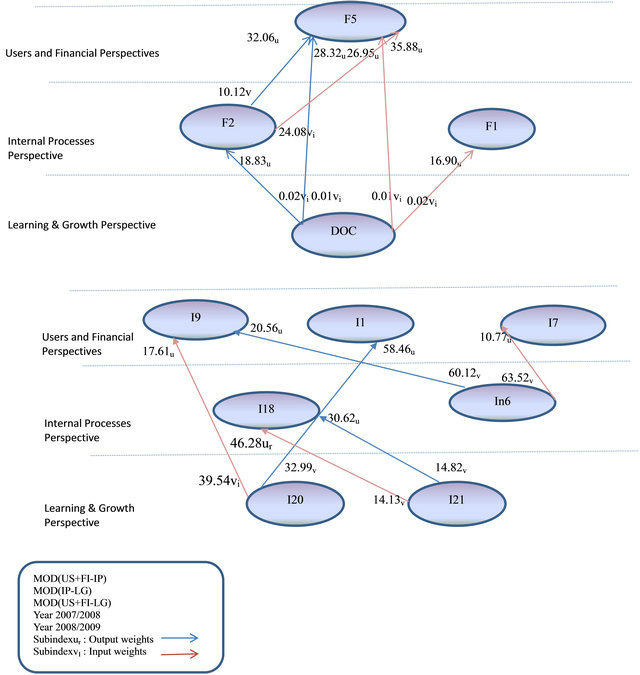
Figure 7. Strategic map of models of teaching and research efficiency.
the Departments of the University by means of the indicators of efficiency associated with each of the traditional perspectives. For this, we have reviewed those previous studies that have dealt directly or indirectly with the problems of measuring activities of this type. Given the dispersion found in the literature consulted on the choice of suitable indicators, our proposal is set within the framework of the methodology on validation of scales. We have utilised the results of previous studies undertaken by our research group in the framework of the content validation of an instrument of measurement for the effectiveness of R & D activities generally.
This methodology enables the interrelated factors to be valued in the most appropriate way under the perspectives of the Balanced Scorecard in the University.
In the first phase the content of the BSC has been validated, and this model has then had to be validated in a subsequent phase, working from the starting point of the hypothetical relationships between its perspectives. These relationships are clearly efficiency relationships and, for this reason, various efficiency models have been proposed, whose input and output variables have been taken from the model for the financing of the universities of Andalusia, and from the indicators of the program contracts signed by the Departments with the Rector’s Office of the University of Cadiz. These efficiency models, calculated using DEA, have allowed us to test the hypotheses put forward in the study.
The result has been the establishment of the framework of analysis of the relationships between the perspectives of the BSC in the University. Specifically, the Departments that have maximized their values of efficiency in the US + FI-IP models are also able to maximize the efficiency values in the IP-LG model. In these tests it has also been shown that those Departments that have been efficient in their activities under the US + FI-IP and IP-LG models have also been efficient in the US + FI-LG model.
All the work described above represents confirmation that relationships exist between the perspectives of the BSC developed, and this validates the model proposed.
As the practical application of this work, it is considered that the BSC model proposed is suitable for use by the Departments of a University in the measurement of their internal performance or output, and the relationship of this output to the resources employed. It is, therefore, a study that defines the framework for analysing the strategic performance of university Departments.
Firstly, one of the objectives of the work has been to validate empirically the hypothetical causal relationships between the perspectives of a Balanced Scorecard model in the University, and to design a Strategic Map of causeeffect relationships between the dimensions and indicators of the model.
We have provided empirical evidence about its dimensional structure, and the structure of the causal relationships between its perspectives. Positive and significant relationships have also been obtained between the five perspectives that comprise the model. Secondly, the relationships between perspectives have been demonstrated starting from the weightings obtained for both the inputs and outputs in each model.
We have also demonstrated the relationships of causality existing between the dimensions included in the perspective of Learning and Growth, and those included in the perspective of Internal Processes; and between the dimensions included in the perspective of Internal Processes and those included in the joint perspectives of Users and Financial performance.
The first important contribution of this study can be found in the development of a Strategic Map of causal paths, from the positive and significant relationships obtained. This Strategic Map, validated in this study, has enabled us to demonstrate the incidence of each of the measurements indicative of the performance, on the source measurements.
The second contribution of this work is to advance knowledge of the factors driving the performance or returns obtained from the Research and Teaching activities in the University; for this we employ the network of hypothetical cause-effect relationships that underlie the structure of a Balanced Scorecard. In this case, and associated with the first contribution of this work, we have located the factors that exert the most effect on each of the dimensions that form this Balanced Scorecard and that, therefore, ultimately affect the performance of the University as a whole. These factors are, for teaching, the participation of personnel in activities of teaching innovation; the proportion of Doctorate-level personnel of the Department; and the number of subjects and credits in the Virtual Campus. With respect to the research performance, the most important factors are: the number of research sexennials; the financing obtained through OTRI contracts; the number of research projects; the number of researchers active in the research plans of the Autonomous Region of Andalusia (PAI); the financing obtained for research in National and Regional calls for bids in the last 3 years; the scores of the PAIDI; and the number of teachers who participate in research projects and OTRI contracts.
With respect to quality in R & D activities, the crossfunctional capabilities of the R & D personnel, together with their experience and level of qualification are the factors giving rise to higher quality ratings in the performance of these activities. An important factor in policy decisions with respect to expenditure on R & D is the degree of trans-cultural capability shown by the R & D personnel; factors of secondary importance are the crossfunctional capabilities of these employees, their experience, and the use of work teams. To summarize, the various capabilities and experience of the research personnel are the resources to which considerable importance is attached when decisions on R & D expenditure are taken.
Lastly, it can be stated that the principal novelty of this study is that a Strategic Map applied to particular type of organization, the public university has been developed and empirically validated. Therefore, the practical application of the model developed is clear. It can also be developed as a general model for performance measurement in any type of organization, a line of work that has now been opened by our research group, and for which applications are foreseen in the aeronautical manufacturing sector in Spain.
With respect to the weaknesses of the study, mention should be made of the lack of information on some of the indicators utilised by the Junta de Andalucía for the financing of the public universities of this autonomous region. For future work we propose to study further the various factors that affect university performance in all the universities of Andalusia.
8. Acknowledgements
This research has been financed under project ECO2009- 10389/ECON of the General Subdirectorate of Research of the Spanish Ministry of Science and Innovation.
REFERENCES
- A. García-Aracil and D. Palomares-Montero, “Indicadores Para la Evaluación de Las Instituciones Universitarias: Validación a Través del Método Delphi,” Revista Española de Documentación Científica, Vol. 35, No 1, 2012, pp. 119-144. doi:10.3989/redc.2012.1.863
- W. J. Spencer and D. D. Triant, “Strengthening the Link between R & D and Corporate Strategy,” The Journal of Business Strategy, Vol. 10, No. 1, 1989, pp. 38-42. doi:10.1108/eb039281
- S. Kivisaari, “Management of Innovation in the Modern Corporation: Dilemmas in the Corporate Control of R & D,” Scandinavian Journal of Management, Vol. 7, No. 3, 1991, pp. 219-228. doi:10.1016/0956-5221(91)90035-Y
- Z. Liao and P. F. Greenfield, “The Synergy or Corporate R & D and Competitive Strategies: A Exploration Study in Australian High-Technology Companies,” The Journal of High Technology Management Research, Vol. 11, No. 1, 2000, pp. 93-107. doi:10.1016/S1047-8310(00)00025-0
- A. W. Pearson, W. Nixon and I. C. Kerssens-Van Drongelen, “R & D as a Business—What Are the Implications for Performance Measurement?” R & D Management, Vol. 30, No. 4, 2000, pp. 355-364. doi:10.1111/1467-9310.00190
- J. W. Tipping, E. Zeffren and A. Fusteld, “Assessing the Value of Your Technology,” Research Technology Management, Vol. 38, No. 5, 1989, pp. 22-31.
- B. M. Werner and W. E. Souder, “Measuring R & D Performance—State of the Art,” Research Technology Management, Vol. 40, No. 2, 1997, pp. 34-43.
- G. A. Neufeld, P. A. Simeoni and M. A. Taylor, “HighPerformance Research Organizations,” Research Technology Management, Vol. 44, No. 6, 2001, pp. 42-52.
- R. S. Kaplan and D. P. Norton, “The Balanced Scorecard for Public-Sector Organizations,” Harvard Business School Publishing, Boston, 1999.
- G. Li and D. Dalton, “Balanced Scorecard for I + D,” Pharmaceutical Executive, Vol. 23, No. 10, 2003, pp. 84- 90.
- O. Amat and P. Soldevilla, “La Aplicación del Cuadro de Mando Integral. Un Ejemplo en la Unidad de Relaciones Internacionales de una Universidad,” Auditoría Pública, Vol. 17, No. 2, 1999, pp. 40-45.
- S. M. Young, “Implementing Management Innovations Successfully: Principles for Lasting Change,” Journal of Cost Management, Vol. 11, No. 5, 1997, pp. 16-20.
- A. M. Zbinden, “Introducing a Balanced Scorecard Management System in a University Anesthesiology Department,” Anesthesia & Analgesia, Vol. 95, No. 6, 2002, pp. 1731-1738. doi:10.1097/00000539-200212000-00049
- S. Johnson, “EFQM and Balanced Scorecard for Improving Organizational Performance. A Research Report,” 2004. http://www.som.cranfield.ac.uk/som/cbp/pma/Balanced%20Scorecard%20and%20EFQM.pdf
- J. Cullen, J. Joyce, J. Hassall and M. Broadbent, “Quality in Higher Education: From Monitoring to Management,” Quality Assurance in Education, Vol. 11, No. 1, 2003, pp. 5-14. doi:10.1108/09684880310462038
- H. Rohm, “Improve Public Sector Results with a Balanced Scorecard: Nine Steps to Success,” The Balanced Scorecard Institute, 2003.
- J. Cáceres and M. J. González, “Hacia una Gestión Estratégica de los Departamentos Universitarios: Propuesta de un Cuadro de Mando Integral,” Auditoría Pública, Vol. 35, No. 1, 2005, pp. 55-72.
- University of California San Diego, “A University Business Model Based on the Balanced Scorecard 1999, Mexico/USA University Discussion,” 2006. http://www-vcba.ucsd.edu/mexico-usa/sld026.htm
- O. Amat and P. Soldevilla, “Optimización del Control de Gestión en las Universidades Públicas con el Cuadro de Mando Integral,” 2012. http://www.google.es/search?sourceid=navclient&aq=&oq=pompeu+fabra+cuadro+de+mando&hl=es&ie=UTF-8&rlz=1T4ADBF_esES291ES326&q=pompeu+fabra+cuadro+de+mando&gs_l=hp...0i8i30.0.0.0.378343...........0.7VRl7kBpDWc
- Universitat Jaume I, “El Cuadre de Comandament Instituciona,” 2000. http://www.uji.es/bin/infoinst/projectes/peuji/pdf/cap3.pdf
- Acuerdo de 10 de Julio de 2007, del Consejo de Gobierno, por el que se Aprueba Elmodelos de Financiación de las Universidades Públicas de Andalucía, (2007-2011). http://departamentos.uca.es/C112/convocatorias/contratoprograma2008/documentotecnico2007
- J. Johnes and J. Taylor, “Performance Indicator in Higher Education,” SRHE, Open University Press, Buckingham, 1990.
- R. Nowaczyk and D. Underwood, “Possible Indicators of Research Quality for College and Universities,” Educational Policy Analysis Archives, Vol. 3, No. 20, 1995, p. 830.
- J. Vidal, “Indicadores en la Universidad: Información y Decisiones,” Consejo de Universidades, Madrid, 1999.
- S. Gattoufi, M. Oral and A. Reisman, “A Data Envelopment Analysis: A bibliography Update (1951-2001),” SocioEconomic Planning Sciences, Vol. 38, No. 2-3, 2004, pp. 159-229.
- S. Thore and G. Rich, “Prioritizing a Portfolio of R & D Activities, Employing Data Envelopment Analysis,” In: S. Thore, Ed., Technology Commercialization: DEA and Related Analytical Methods for Evaluating the Use and Implementation of Technical Innovation, Kluwer Academic Publishers, Boston, 2002, pp. 53-74. doi:10.1007/s00122-002-0978-1
- S. Thore and L. Lapao, “Prioritizing R & D Projects in the Face of Technological and Market Uncertainty: Combining Scenario Analysis and DEA,” In: S. Thore, Ed., Technology Commercialization: DEA and Related Analytical Methods for Evaluating the Use and Implementation of Technical Innovation, Kluwer Academic Publishers, Boston, 2002, pp. 87-104.
- J. D. Linton and S. T. Walsh and J. Morabito, “Analysis, Ranking and Selection of R & D Projects in a Portfolio,” R & D Management, Vol. 32, No. 2, 2002, pp. 139-148. doi:10.1111/1467-9310.00246
- W. D. Cook and R. H. Green, “Project Prioritization: A Resource-Constrained Data Envelopment Analysis Approach,” Socio-Economic Planning Sciences, Vol. 34, No. 2, 2000, pp. 85-99. doi:10.1016/S0038-0121(99)00020-8
- T. G. Valderrama and T. Groot, “Controlling the Efficiency of University Research in the Netherlands,” In: S. Thore, Ed., Technology Commercialization: DEA and Related Analytical Methods for Evaluating the Use and Implementation of Technical Innovation, Kluwer Academic Publishers, Boston, 2002, pp. 147-182.
- P. Korhonen, R. Tainio and J. Wallenius, “Value Efficiency Analysis of Academic Research,” European Journal of Operational Research, Vol. 130, No. 1, 2001, pp. 121-132. doi:10.1016/S0377-2217(00)00050-3
- N. Avkiran, “Investigating Technical and Scale Efficiencies of Australian Universities through Data Envelopment Analysis,” Socio-Economic Planning Science, Vol. 35, No. 1, 2001, pp. 57-80. doi:10.1016/S0038-0121(00)00010-0
- R. C. Rickards, “Setting Benchmarks and Evaluating Balanced Scorecards with Data Envelopment Analysis,” Benchmarking, Vol. 10, No. 3, 2003, pp. 226-246. doi:10.1108/14635770310477762
- T. G. Valderrama, E. MuleroMendigorri and D. R. Bordoy, “Relating the Perspectives of the Balanced Scorecard for R & D by Means of DEA,” European Journal of Operational Research, Vol. 196, No. 3, 2009, pp. 1177- 1189.
- A. H. C. Tsang, A. Jardine and H. Kolodny, “Measuring Maintenance Performance: A Holistic Approach,” International Journal of Operations & Production Management, Vol. 19, No. 7, 1999, pp. 691-715. doi:10.1108/01443579910271674
- P. Rouse, M. Putterill and D. Ryan, “Integrated Performance Measurement Design: Insights from an Application in Aircraft Maintenance,” Management Accounting Research, Vol. 13, No. 2, 2002, pp. 229-248. doi:10.1006/mare.2002.0180
- R. D. Banker, H. Chang, S. N. Janakiraman and C. A. Konstans, “Balanced Scorecard Analysis of Performance Metrics,” European Journal of Operational Research, Vol. 154, No. 2, 2004, pp. 423-436. doi:10.1016/S0377-2217(03)00179-6
- T. Y. Chen and L. H. Chen, “DEA Performance Evaluation Based on BSC Indicators Incorporated: The Case of Semiconductor Industry,” International Journal of Productivity and Performance Management, Vol. 56, No. 4, 2007, pp. 335-357. doi:10.1108/17410400710745333
- I. Van der Weijden, D. De Gilder, P. Groenewegen and E. Klasen, “Implications of Managerial Control on Performance of Dutch Academic (Bio)medical and Health Research Groups,” Research Policy, Vol. 37, No. 7, 2008, pp. 1616-1629. doi:10.1016/j.respol.2008.06.007
- H. Eilat, B. Golany and A. Shtu, “R & D Project Evaluation: An Integrated DEA and Balanced Scorecard Approach,” Omega, Vol. 35, No. 5, 2008, pp. 895-912. doi:10.1016/j.omega.2006.05.002
- T. Y. Chen, C. B. Chen and S. Y. Peng, “Firm Operation Performance Analysis Using Data Envelopment Analysis and Balanced Scorecard: A Case Study of a Credit Cooperative Bank,” International Journal of Productivity and Performance Management, Vol. 57, No. 7, 2008, pp. 523- 539. doi:10.1108/17410400810904010
- H. Min, H. Min and S. J. Joo, “A Data Envelopment Analysis-Based Balanced Scorecard for Measuring the Comparative Efficiency of Korean Luxury Hotels 2,” International Journal of Quality and Reliability Management, Vol. 25, No. 4, 2008, pp. 349-365. doi:10.1108/02656710810865249
- E. Najafi, M. B. Aryanegad, F. H. Lotfi and A. Ebnerasould, “Efficiency and Effectiveness Rating of Organization with Combined DEA and BSC,” Applied Mathematical Sciences, Vol. 3, No. 25-28, 2009, pp. 1249- 1264.
- C. Y. Chiang and B. Lin, “An Integration of Balanced Scorecards and Data Envelopment Analysis for Firm’s Benchmarking Management,” Total Quality Management and Business Excellence, Vol. 20, No. 11, 2009, pp. 1153-1172. doi:10.1080/14783360903248286
- C. Y. Huang, H. Chen, G. H. Tzeng and K. H. Hu, “Enhancing the Performance of a SOC Design Service Firm by Using a Novel DANP Based MCDM Framework on the Balanced Scorecard,” 40th International Conference on Computers and Industrial Engineering: Soft Computing Techniques for Advanced Manufacturing and Service Systems, 2010. http://ieeexplore.ieee.org/stamp/stamp.jsp?tp=&arnumber=5668419
- E. Kongar, J. M. Pallis and T. M. Sobh, “Non-Parametric Approach for Evaluating the Performance of Engineering Schools,” International Journal of Engineering Education, Vol. 26, No. 5, 2010, pp. 1210-1219.
- F. H. Lotfi, S. J. Sadjadi, A. Khaki and E. Najafi, “A Combined Interval Net DEA and BSC for Evaluating Organizational Efficiency,” Applied Mathematical Sciences, Vol. 4, No. 36-39, 2010, pp. 1975-1999.
- F. R. Roodposhti, F. H. Lotfi and M. V. Ghasemi, “Acquiring Targets in Balanced Scorecard Method by Data Envelopment Analysis Technique and Its Application in Commercial Banks,” Applied Mathematical Sciences, Vol. 4, No. 69-72, 2010, pp. 3549-3563.
- F. H. Roodposhti, F. HosseinzadehLofti and M. V. Ghasemi, “Performance Evaluation through Data Envelopment Analysis Technique and Balanced Scorecards Approach and Its Application in Bank,” Applied Mathematical Sciences, Vol. 4, No. 69-72, 2010, pp. 3537- 3547.
- H. Wang, L. Zheng and J. Liu, “Measuring the Performance of Information Systems Using Data Envelopment Analysis,” International Journal of Digital Content Technology and Its Applications, Vol. 4, No. 8, 2010, pp. 92- 101.
- G. J. Van Helden, H. Aardema, H. Ter Bogt and T. Groot, “Knowledge Creation for Practice in Public Sector Management Accounting by Consultants and Academics: Preliminary Findings and Directions for Future Research,” Management Accounting Research, Vol. 21, No. 2, 2012, pp. 83-94. doi:10.1016/j.mar.2010.02.008
- H. Wang, Y. Liu, M. Zhou and S. He, “DEA-Based Measurement of Information System Performance,” Key Engineering Materials, Vol. 467-469, 2011, pp. 597-602. doi:10.4028/www.scientific.net/KEM.467-469.597
- R. Ramanathan and U. Ramanathan, “A Performance Measurement Framework Combining DEA and Balanced Scorecard for the UK Health Sector,” International Journal of Operational Research, Vol. 12, No. 3, 2011, pp. 257-278. doi:10.1504/IJOR.2011.042916
- C. A. F. Amado, S. P. Santos and P. M. Marques, “Integrating the Data Envelopment Analysis and the Balanced Scorecard Approaches for Enhanced Performance Assessment,” Omega, Vol. 40, No. 3, 2012, pp. 390-403. doi:10.1016/j.omega.2011.06.006
- C. Fu and S. Yang, “The Combination of DependenceBased Interval-Valued Evidential Reasoning Approach with Balanced Scorecard for Performance Assessment,” Expert Systems with Applications, Vol. 39, No. 3, 2012, pp. 3717-3730. doi:10.1016/j.eswa.2011.09.069
- M. Vaez-Ghasemi, F. H. Lotfi and L. Taghizadeh, “MultiComponent Balanced Scorecard for Perspectives Efficiency Measurement,” Applied Mathematical Sciences, Vol. 6, No. 9-12, 2012, pp. 403-410.
- E. M. Quiroga, P. Hernán and D. Visbal, “Evaluación Docente Mediante BSC y DEA,” Revista Educación en Ingeniería, Vol. 2, No. 70, 2006, pp. 70-86.
- Y. Wu and C. Li, “Research on Performance Evaluation of Higher Education Based on the Model of BSC-DRFDEA,” IEEE 16th International Conference on Industrial Engineering and Engineering Management, Beijing, 21- 23 October 2009, pp. 2030-2034.
- A. Charnes, W. W. Cooper and E. Rhodes, “Measuring the Efficiency of Decision Making Units,” European Journal of Operational Research, Vol. 2, No. 6, 1978, pp. 429-444.
Annex 1: Indicators Employed in the Model for the Financing of the Public Universities of Andalusia, and of the Program Contracts
One of the most important characteristics of the Financing model for the public universities of Andalusia (2007-2011) is the relationship that is established between them, a relationship adapted to the diversity of institutional profiles. The universities should assume more responsibility for their own financial sustainability in the long term, particularly in respect of the financing of their research activities: this implies a proactive diversification of their sources of finance through collaboration with companies (also in the form of cross-border consortia), foundations and other private sources.
The financing of the universities of Andalusia must find the correct equilibrium between basic financing, competitive financing, and that based on the results (supported on a solid assurance of quality) for higher education superior and of university-based research. The competitive financing must be based on systems of institutional assessment and on diversified indicators of performance, with clearly-defined objectives.
In the financing model of the universities of Andalusia it is considered that the university must be financed for three pre-eminent reasons or purposes: training, research and innovation. These concepts encompass the functions entrusted to the university in Andalusia: sharing and transferring knowledge with society, and strengthening the dialogue with all interested parties.
The financing of each of these concepts requires proper attention, following principles of the capacity available to the institution, the activities undertaken, the quality of those activities, and the degree to which they meet objectives of progressive improvement.
this target model seeks the full incorporation of a system for innovation in teaching; participation in national and/or european community research programs with an annual growth of 10% and 20% respectively; the full insertion in employment of those who have successfully completed their course of studies, within two years of graduating; and consolidation of the entrepreneurial capacities of teachers and students. in respect of the latter target, in particular, within three years of graduating, 30% of those leaving with a qualification should create their own company, and 20% of the teaching staff should participate in collaborations with the productive fabric of the economy on a stable basis.
Other important goals sought are the full incorporation of the advanced Information and Communications Technologies in everything the university does in education and training, research and management; and putting the Virtual Campus fully into operation. Increasing the globalization of the teaching and research activities is another key objective: the targets are for 10% of the teaching staff and 15% of the student body to be from other countries. It is intended to develop and implement the system of management by processes and by competences. In respect of finance, efforts will be made to increase the funds originating from the private sector so that they account for 25% of the total financing of the university system. Lastly, it is also planned to enhance the participation of women in the organs of direction and management of the University, with particular targets of exceeding the threshold of 20% for the number of women Full Professors and women Principal Researchers of projects.
The new model of operational financing will be centred on three main chapters, with the following weights specific: Teaching: 60%; Research: 30%; and Innovation: 10%.
1.1. Indicators Associated with the Structure of Education and Training
1) Number of degrees offered in each university, classified by course length (short and long course, and 2nd course only), typology and experimentality (i.e. whether or not experimental work is required) (from 1 to 6, in each course).
Determination of the financing proportional to the basic teaching structure: Financing of the PDI calculated proportionally to teaching personnel, by cycle, typology and experimentality, considering the real teaching capacity per PDI (Research and Teaching personnel).
1.2. Indicators linked to Results
Coefficient in function of the distribution of students in the traditional system or in the new system of teaching and digital innovation:
Degree of Implantation, with specification of an annual growth rate, in the Plan of Teaching Innovation: Number of credits in accordance with the cited Plan accredited by the Assessment and Accreditation Agency of Andalusia/total number of credits.
• Number of credits with at least 25% of the material on-line, accredited by the Assessment and Accreditation Agency of Andalusia/total number of credits.
• Coefficient in function of the accredited degree of qualification of the teaching personnel.
• Coefficient in function of the final excellence of the educational/training process.
• % of students inserted in the fabric of the economy.
• Average duration of the educational/training process, and its relationship to the duration initially foreseen.
• Coefficient in function of postgraduate teaching of accredited quality.
• Number of accredited credits in postgraduate teaching/ number of credits of the core offer of the university.
2. Indicators for Research
2.1. Indicators Associated with the Structure of Research
1) PDI Cost for Research: This allocation is distributed from the average cost of PDI for research activity (35% of the total cost of the PDI) multiplied by the number of full-time PDIs existing in each university.
2) Number of effective PDIs integrated in research groups in Andalusia.
3) Number of auxiliary personnel and cost of the team of Administration and Services personnel.
2.2. Indicators Associated with Results in Research
1) Coefficient in function of the curricular merits of the researchers:
• Sexennials recognized as a proportion of the total possible, based on the average for the whole system.
• Doctoral theses defended/PITC (Research and Teaching personnel).
• FPU, FPI, JA, Ramón and Cajal and similar grants/ PITC.
• Awards for international, national, and regional research (weighted as follows: international counted as three; national counted as two; regional counted singly) and/or awards for artistic and literary research/PITC.
• Talks/presentations made, publicised and by invitation of institutions/PITC.
• Artistic exhibitions and publication of books/PITC.
2) Coefficient in function of the relative score of the Research Groups of Andalusia.
3) Coefficient of liquidated rights originating from research and from the transfer of knowledge, in the three last years, per each full-time PDI:
• External funding from competitive public Calls for bids for R & D + I projects (National and European).
• External funding from Calls for bids for R & D + I projects from companies and the Technological Corporation of Andalusia/PITC.
• Number of Doctoral graduates/staff leaving to become employees, in their speciality, of companies and non-university institutions, in the last 10 years/ PITC.
• Number of patents in exploitation or acquired by third parties/PITC.
• Funding from R & D + I contracts or agreements with private entities.
4) Coefficient obtained from the number of technology-based companies, in relation to the average for the whole system.
• Number of knowledge-based companies generated principally by teachers of the university, in the last 10 years/PITC.
5) Coefficient of gender:
• % of women Full Professors.
• % of women Principal Researchers.
3. Indicators for Innovation
Indicators Associated with Results
1) Coefficient in function of the degree to which use is made of the Information and Communications Technologies: Indicators for the “Virtual Campus” project:
• Development of on-line participation by students and teachers.
• Development of wireless communication networks of adequate speed and capacity.
• On-line access to and provision of all the university services and procedures.
2) Coefficient in function of the design and implementation of a system of management by processes and competences:
3) Implementation of a system of management by processes.
• Management Plan for the professional personnel employed in the administration and services of the universities of Andalusia, in function of necessary competences, training and career development plans, incentives and professional accreditation.
4) Coefficient in function of the globalization of the universities:
• Number of outward students on Erasmus and other international exchange programs/Total number of students.
• Number of inward students on Erasmus and other international exchange programs/Total number of students.
• Number of final year students who obtain a TOEFL grade of more than 500 points/Number of final year students enrolled on the course.
• Cooperation among the universities of Andalusia in the framework of the Sistema Andaluz de Universidades (Andalusian Universities System) for competing at the National and European levels.
• % of teachers and researchers who participate in programs and networks of international geographic mobility.
5) Coefficient in function of involvement with the productive fabric of the economy:
• % of graduates who have created their own company, during the three years following their graduation.
• % of teachers who have a contract of collaboration with one or more companies.
6) Coefficient of gender:
• % of women who participate in the governance of the University and its organs of management.
Annex 2. Indicators of the Balanced Scorecard for the Departments in the University