Journal of Crystallization Process and Technology
Vol.3 No.1(2013), Article ID:27271,16 pages DOI:10.4236/jcpt.2013.31003
ACCEPT-NMR: A New Tool for the Analysis of Crystal Contacts and Their Links to NMR Chemical Shift Perturbations
![]()
Department of Chemistry, Columbia University, New York, USA.
Email: aem5@columbia.edu
Received December 18th, 2012; revised January 18th, 2013; accepted January 25th, 2013
Keywords: ACCEPT-NMR; Crystal Contact; Crystal Interface; Oligomer Interface; Intermolecular Interaction; Chemical Shift Perturbation; CSP; Nuclear Magnetic Resonance, NMR; Solid-State NMR
ABSTRACT
We have developed an open-source cross-platform software toolkit entitled ACCEPT-NMR (Automated Crystal Contact Extrapolation/Prediction Toolkit for NMR) as a helpful tool to automate many of the complex tasks required to find and visualize crystal contacts in structures of biomolecules and biomolecular assemblies. This toolkit provides many powerful features geared toward NMR spectroscopy and related disciplines, such as isotopic labeling, advanced visualization options, and reporting tools. Using this software, we have undertaken a survey of available chemical shift data in the literature and deposited in the BMRB, and show that the mere presence of one or more crystal contacts to a residue confers an approximately 65% likelihood of significant chemical shift perturbations (relative to solution NMR chemical shifts). The presence of each additional crystal contact subsequently increases this probability, resulting in predictive accuracies in excess of 80% in many cases. Conversely, the presence of a significant experimental chemical shift perturbation indicates a >60% likelihood of finding one or more crystal contacts to a particular residue. Pinpointing sites likely to experience large CSPs is critical to mapping solution NMR chemical shifts onto solid-state NMR data as a basis for preliminary assignments, and can thus simplify the assignment process for complex biomolecules. Mapping observed CSPs onto the molecular structure, on the other hand, can indicate the presence of crystal interfaces where no crystal structure is available. Finally, by detecting sites critical to intermolecular interfaces, ACCEPT-NMR can help guide experimental approaches (e.g. isotopic labeling schemes) to detect and probe specific inter-subunit interactions.
1. Introduction
The typical paradigm of solid state NMR (SSNMR) structural studies of proteins, other biomolecules, and biomolecular assemblies consists of three main phases: expression and sample preparation, assignment of chemical shifts and secondary structure, and collection of structural restraints for the establishment of tertiary (and, if applicable, quaternary) structure. Correct assignments are absolutely critical for subsequent structural restraints, but can be very difficult to obtain in complex biomolecules with considerable spectral overlap. Increasing the dimensionality of experiments (for instance, 4D experiments) can help in deconvoluting spectra to some extent, but relaxation processes and loss of magnetization during transfers limit the number of dimensions that can be used [1]. As a result, the assignment of large and complex systems in SSNMR remains challenging. Solution NMR chemical shifts, where available, can serve as useful aids for SSNMR assignment, and as starting points for sequential walks, often proving easier and faster than de novo assignment. This assignment strategy only works well however when the solution NMR chemical shifts do not differ markedly from the SSNMR chemical shifts, so care must be taken to choose starting points not likely to experience large chemical shift perturbations (CSPs). A key variable in predicting CSPs is the presence or absence of crystal contacts to a particular residue. Crystal contacts, while having been determined to play only a small role in causing structural differences between solution NMR and crystallographic structures [2] , can have a significant impact on chemical shifts [3,4] . They are also largely impossible to control for, unlike other variables that can influence chemical shifts (e.g. pH/ionization, ion occupancy). As a result, screening for crystal contacts prior to chemical shift mapping is a worthwhile endeavor, but can be tedious and time-consuming. This publication details the development of a software tool to automate and greatly simplify many of these tasks. Using this toolkit, a survey of published data is undertaken and reveals a strong association between the presence of crystal contacts and CSPs.
Crystal contacts are generally defined as non-biologically-functional contacts arising only in the crystal and not in solution, and can typically be identified by X-ray crystallography but are not easily differentiable from oligomer contacts or interactions such as enzyme-substrate binding [5,6] . In fact, a typical biological interface, while usually larger than a crystal contact [5,7,8] , coexists with 6-12 different crystal-packing interfaces in most structures. Crystal-packing interfaces generally do not pack as tightly as biological interfaces and also have slightly different (less hydrophobic) amino acid composition [7,9-16], though recent work points to the rates of occurrence of small hydrophobic residues at crystal contacts having been underestimated [13]. Recent research has yielded several algorithms to differentiate biologically relevant interfaces from crystal contacts, albeit with relatively high (>10%) error. These typically rely on the idea that biologically relevant interfaces are typically specific and localized, while crystal contacts involve normally hydrophilic residues and in a non-localized fashion. Therefore, biologically relevant interfaces can be found at hydrophobic patches while crystal contacts are taken to be those intermolecular contacts that do not occur at hydrophobic patches [17] . As such contacts bring neighboring molecules within interaction range of one another, they can significantly perturb the electrostatics of exposed sites, and thus can have profound effects on chemical shifts. Analysis of predicted crystal contacts is therefore an important, though often neglected, step in mapping solution NMR assignments onto SSNMR spectra, as it can point out the sites at which significant CSPs are likely to occur.
Once a full or even partial set of assignments has been made, another challenging aspect in SSNMR studies of large biomolecules or biomolecular complexes is the design of experiments to probe intermolecular (or even intramolecular) contacts in order to determine tertiary or quaternary structure restraints such as distances and nonbonding dihedral angles. The availability of crystal structures or structural models of the system of interest can provide critical clues as to which residues/interfaces/domains are expected to be in contact, giving indications of where in the spectra to expect crosspeaks arising from such contacts. Further, prediction of interacting interfaces can also suggest both labeling schemes and techniques e.g. pulse sequences) to best isolate and enhance a desired contact or set of contacts. This is especially important in congested spectra or spectral regions, where overlapping resonances may make analysis of the desired contact(s) impossible without modifications to isotopic labeling or pulse sequence. Similar analyses of crystal contacts also have a number of other notable uses, such as the design of artificial dimers and multimers [18] , modification of crystallizability and crystal properties [19] , and prediction of NMR dynamics as well as order parameters [20,21] .
Conversely to the use of crystal contacts to predict CSPs, mapping of the observed CSPs (between solid and solution or between different crystal forms) on the sequence or 3-dimensional surface of biomolecular systems can serve to predict the location of crystal contacts. This approach can be useful in predicting which residues are likely to be surface-exposed and outwardly facing, thus giving indications of the biomolecule’s fold and tertiary structure in cases where the crystal structure is not already solved or where the sample is not suitable for crystallography. In cases where an SSNMR structure of the molecule/assembly of interest exists, mapping observed CSPs on the surface of the structure can also be used to predict contacts between neighboring molecules and thus reconstruct a picture of the unit cell. Such mapping of CSPs to detect interaction surfaces is common practice in structure-activity relationships by NMR (SAR by NMR) and NMR molecular recognition studies [22-35] . 1H CSPs of the amide protons are most commonly used for detection of protein-ligand interactions via solution NMR techniques, and typically average in the 0.05 - 0.2 ppm range, though CSPs as high as 0.5 - 0.7 ppm have been reported [27,32,33,35,36] . In studies that utilize 13C chemical shifts, observed CSPs are generally on the order of 0.5 - 2.0 ppm. 13C CSPs in excess of 1 ppm upon ligand binding are commonly observed at sites close to the binding site, with sidechain shifts often being more perturbed than those of the backbone [4,22,25,26,30,34, 37] . Similar CSPs (>1 ppm) have also been observed in nucleic acids [27,38] . Related studies utilizing paramagnetic shift reagents report CSPs on the order of 0.5 ppm, and use these to distinguish solvent-exposed surfaces [39] . Even 13C shifts as low as 0.1 ppm can be meaningful and can indicate ligand binding [4]. Finally, for 15N, CSPs as large as 8 ppm can be observed upon binding, though more typical CSPs are in the 0 - 2 ppm range much as with 13C [22-34] . Considerable line broadening (in some cases beyond the limit of detection) at protein-protein and protein-ligand interaction sites has also been observed [3,24,25,30] .
In sum, the presence of crystal contacts is likely to cause CSPs in crystalline biomolecular samples, and the observation of CSPs can be used to detect crystal contacts. But while there have been studies of the relation between intermolecular contacts and CSPs in individual proteins and complexes [3,22,24,27,30,34] , there have been no systematic studies of these effects across multiple systems. Many studies have recently been published on NMR spectra of crystalline globular proteins as well as globular proteins in solution, including studies of structure, binding, and dynamics [37,40-50] . Collectively, they provide a rich database of chemical shifts. Together with corresponding crystal structures, the available data make possible a detailed analysis of the role of crystal contacts in chemical shift perturbation. Such an analysis would however prove cumbersome and extremely time consuming without the right tools.
The Automated Crystal Contact Extrapolation/Prediction Toolkit for NMR (ACCEPT-NMR) is a tool designed to assist in and, in many cases, automate tasks such as finding and visualizing the crystal contacts in crystallographic structures. Unlike other offerings, it is a tool designed with spectroscopists in mind, and has a number of features to specifically assist in the planning of NMR experiments and in the interpretation of NMR data. ACCEPT-NMR is a cross-platform package based on the Gtk2 framework, and provides a convenient graphical user interface (GUI) for many of the operations involved in crystal contact analyses. It also integrates seamlessly with PyMol [51], a commonly used and versatile molecular visualization program. Use of the ACCEPT-NMR GUI is illustrated herein with several examples. It should also be noted that ACCEPT-NMR has already been fruitfully used in published studies of biomolecular structure and function by SSNMR [52-54] .
While several downloadable and/or web-based tools exist that have some of the functionality of ACCEPTNMR (these include PISA [55-57] , CrystalP [58], VASCo [59] , SPACE [60], and VIPERdb [61]), ACCEPT-NMR also includes a number of additional features that may be of great convenience to NMR spectroscopists. Chief among these are an isotopic labeling toolbox and a spectral viewer, which allow for the selection of an isotopic labeling scheme (chosen from a list of common labeling schemes used for NMR studies or any custom labeling scheme) and, using either predicted chemical shifts (e.g. SPARTA+ [62]) or a pre-existing experimental dataset, allow the user to visualize the predicted spectrum. These features are designed to help in the selection of labeling schemes specifically to detect and observe crystal and oligomer contacts.
2. Materials and Methods
The GUI of ACCEPT-NMR was created using the GTK2+ (the GIMP Toolkit) [63] framework, which is available for all major platforms (OS X/Linux/Windows). The core program and its various helper modules are written in Perl-5.8 [64] (5.10 compatible), utilizing the Gtk2-perl bindings [65] for communication with GTK2+ and several additional modules [66-70] for miscellaneous tasks. Perl was chosen for its efficient parsing of large text strings (i.e. PDB files), automated memory handling, and convenient data structures (i.e. hashes); these features largely offset its higher computational costs relative to languages like C/C++, although calculation speed can become problematic for very large structures.
The primary external dependencies of ACCEPT-NMR are Perl (5.8 or greater) [64], the GTK2+ package [63], and the Gtk2-perl bindings to GTK2+ [65]. For most operating systems, these can all be simply installed using user-friendly package managers or downloadable installers. Other dependencies are used only for specific tasks, and are auto-loaded if available. Their absence will disable the specific tasks for which they are used, but will not disable overall functionality or prevent ACCEPTNMR from launching. These dependencies are: 1) the Spread sheet: :Parse Excel [67] and Spread she et: :Write Excel [68] Perl modules for reading from and writing to Microsoft Excel® respectively; and 2) the GD graphics library [70] and the Perl module GD [69] to interface with the library, both used for rendering of the spectral prediction display.
Data for the survey of crystal contacts were sourced from the Biological Magnetic Resonance Bank (BMRB, www.bmrb.wisc.edu) [71] where available, and from the literature in cases where shifts were not deposited in the BMRB. The relevant BMRB entries are: bmr4972 and bmr5757 for Crh, bmr6457 and bmr7111 for Ubiquitin, bmr16156 for GB1, bmr16391 for Aβ-crystallin, and bmr7216 and bmr16565 for Triosephosphateisomerase. Additional chemical shift datasets for ubiquitin were kindly provided by Dr. Kuo-Ying Huang. Additional data for GB1 were kindly provided by Drs. Benjamin Wylie and W. Trent Franks. Contact lists were generated in a semi-automated fashion using ACCEPT-NMR using the appropriate distance cutoff for the analysis (4.5 or 5.0 Å), and the C|N—nonhydrogen selection criteria (all contacts from C or N atoms to nonhydrogen atoms within the cutoff distance). Contact tables thus generated were exported using ACCEPT-NMR’s “save summary of contacts” option, and manually combined in Microsoft Excel 2011 with chemical shift data. Custom Perl scripts (available upon request) were used to reformat the BMRB files and chemical shift tables as appropriate. All statistical analyses, including Pearson and Spearman correlations [72], Mann-Whitney U tests [72,73], logistic regressions [72], and ROC curves [72,74] were carried out using SPSS 19.0 (Mac) [75].
3. Results and Discussion
3.1. Brief Overview of ACCEPT-NMR Use
ACCEPT-NMR requires only a Protein Data Bank (PDB) [76] coordinate file for its basic functionality, and is therefore not limited to finding any particular type of contact. As a result, the term “contact” will be taken here to mean simply any pair of atoms within a user-specified distance cutoff, regardless of environment or the presence/absence of other atoms between them. Any intermolecular or intramolecular contacts in a structure can be analyzed, visualized, and catalogued using ACCEPTNMR. Figure 1 summarizes the basic programmatic logic of ACCEPT-NMR and shows how a user progresses through the GUI to provide all required information and generate the desired output. The ACCEPT-NMR window is fundamentally divided into two panes: the “input pane” for all input information and the “results pane” for basic output. Additional panes and windows exist for supplemental functions such as the isotopic labeling display and spectral prediction display, and can be opened on demand. Following generation of a contacts list, individual contacts or groups of contacts may be selected or deselected in the results pane, and selected contacts visualized in PyMol. Figures S1 and S2 (Supporting Information) show the annotated input and results panes respectively, while Figure 2 shows an example of an ACCEPT-NMR/PyMol session, with the per-residue number of contacts for all sites visualized as a color gradient on the molecular structure. Such visualization schemes provide a rapid means of visually pinpointing sites with an abundance of crystal contacts, and therefore sites likely to experience significant CSPs. Many other useful features of ACCEPT-NMR cannot be described
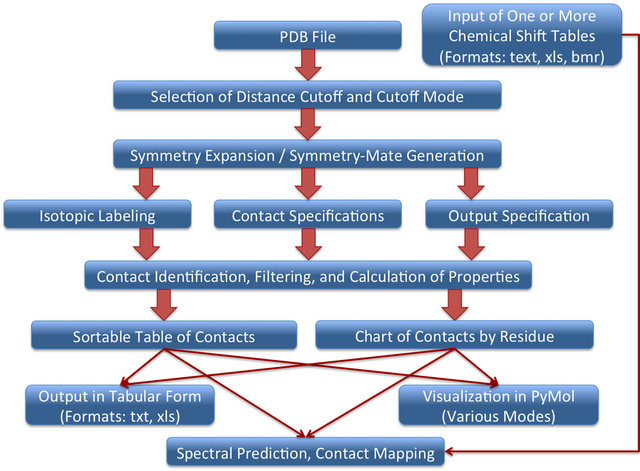
Figure 1. General flowchart of ACCEPT-NMR functionality and progression. Upon selecting a PDB file using the GUI and specifying a distance cutoff for contacts, the user is able to select the appropriate isotopic labeling scheme, set parameters for contacts of interest, and specify output fields. ACCEPT-NMR then finds all contacts matching the specified parameters and allows for an array of operations, including saving of output to file, visualization of contacts in PyMol [51], and spectral prediction (the latter requires a set of chemical shifts to be loaded).
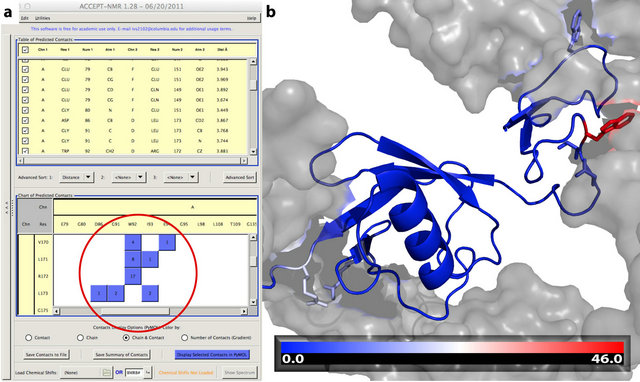
Figure 2. (a) Example of a contact “cluster” in ACCEPTNMR, shown for ubiquitin with lanthanide binding tag [PDB: 2OJR] [77]. The presence of such a cluster between two groups of closely spaced or neighboring residues indicates the presence of a contact patch on the molecular surface. (b) Visualization of the contacts cluster in using ACCEPT-NMR’s “number of contacts (gradient)” visualization mode and PyMol 1.3r1 [51]. The source chain is shown in cartoon representation, with sidechains of residues having ≥10 crystal contacts shown in stick representation. Target chains are shown in surface representation and in gray. The center residue of the contacts cluster identified in (a), W92, with 46 detected crystal contacts within 4 Å (C|N-C|N|O), is shown in red at right. The color bar (bottom) provides a legend for the gradient coloring scheme. Identification of such contact patches can be useful for numerous purposes, including the planning of SSNMR experiments involving intermolecular magnetization transfer.
at length here; detailed usage information, with examples, is provided in Supporting Information.
The latest version of ACCEPT-NMR, along with all available documentation, is always available at http://mcdermott.chem.columbia.edu/software.
3.2. Correlation of Crystal Contacts to Chemical Shift Perturbation
A survey of the effects of crystal contacts on NMR chemical shifts was performed using ACCEPT-NMR to address the following hypotheses:
1) The presence of one or more crystal contact(s) at a given site leads to detectable CSPs.
2) The magnitude of CSPs due to crystal contacts is proportional to the number of crystal contacts at a particular site.
3) The magnitude of CSPs due to crystal contacts is proportional to the contact distance(s), with closer contacts having larger effects.
4) The observation of a significant CSP between solution and solid state NMR at a given site indicates a high likelihood of crystal contacts being present at that site.
Statistical methods were used to analyze the ACCEPTNMR output tables for a number of proteins, which had complete or nearly complete solution NMR assignments and SSNMR assignments as well as X-ray crystallography crystal structures. As crystal contacts are by definition not present in solution, the basic principle of this analysis was to first find CSPs between solution NMR and SSNMR chemical shifts, and then to determine whether the magnitude of the CSP correlates well with the number of crystal contacts detected for at any given residue. This approach makes the critical assumption that the crystal structure provides an accurate representation of the protein’s structure under SSNMR conditions and, by extension, accurately portrays the positions of the crystal contacts in the SSNMR sample. For this reason, our analysis includes only proteins where sample conditions between X-ray crystallography and SSNMR were reasonably similar (samples within 2 pH units of one another, similar precipitants and buffer concentrations used, same space group where known). As these rigorous criteria require data from three different experimental techniques, the number of systems that meet them is relatively small, and largely restricted to well-characterized globular proteins that are often used as model compounds in NMR. The proteins used for the analysis are listed below:
• Ubiquitin (PDB: 1UBQ [78], 3ONS [79]) [40,49]
• Immunoglobulin β1 binding domain (GB1, PDB: 2QMT, 2JSV) [42-44,48]
• Aβ-crystallin (PDB: 3L1G) [45,80]
• Triosephosphateisomerase (TIM, PDB: 1I45) [37,47]
This dataset includes a total of 450 residues for which both solution and SSNMR chemical shift information is available, with some 4584 heavy-atom intermolecular contacts (5 Å cutoff). Analyses were performed only at the residue level (not per-atom); the variables used include: average and maximum 13C CSPs for all available positions in the residue; 15N CSP (backbone only); presence or absence of crystal contacts (boolean) and number of crystal contacts; minimum and average contact distances for the residue. Previous studies have suggested that contacts within 4.5 Å are sufficient to describe a protein residue’s local environment [81,82] ; cutoff distances of 4.5 Å and 5.0 Å were used in this study. Approaches based on explicit counting of the per-site number of contacts have also been successfully used to predict protein-protein interactions as well as sidechain dynamics and order parameters in proteins [20,21,83] . It should also be noted that, for the homodimers (Crh and TIM) used in this study, the crystal contacts often differ between the two monomers. For the purposes of this analysis, the per-residue number of crystal contacts was averaged between the monomers, with the rationale that any effects attributable to those contacts would also be averaged amongst the ensemble present in any NMR sample. Contacts between the monomers making up the dimer were ignored (using ACCEPT-NMR’s oligomer feature) as they represent a biological interface and are therefore not true crystal contacts.
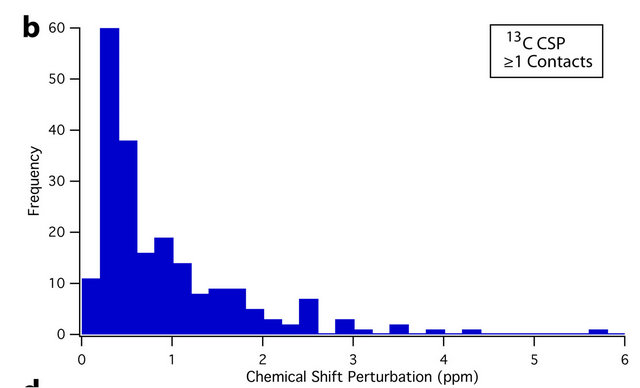
An overview of the resulting dataset reveals a strong association between residue average CSP magnitude and the number of crystal contacts. For instance, 61.9% of all sites that experience a CSP of ≥0.4 ppm are located at crystal contacts. This figure rises to 70.8% for CSPs of ≥ 0.8 ppm. Conversely, 65.4% of residues with at least one crystal contact (nonhydrogen, within 4.5 Å) experience a CSP of ≥ 0.4 ppm, while 40.3% experience a CSP of ≥ 0.8 ppm; differences between the CSP distributions of sites with and without crystal contacts can be seen in the histograms presented in Figure 3. The Mann-Whitney U test [72,73] was also used to assess the statistical significance of these differences. Comparing the 13C and 15N CSP distributions between residues with no crystal contacts and residues with one or more crystal contacts yields p-values of <0.001 in both cases, indicating that the distributions of CSPs differ significantly at the p = 0.001 (99.9%) confidence level.
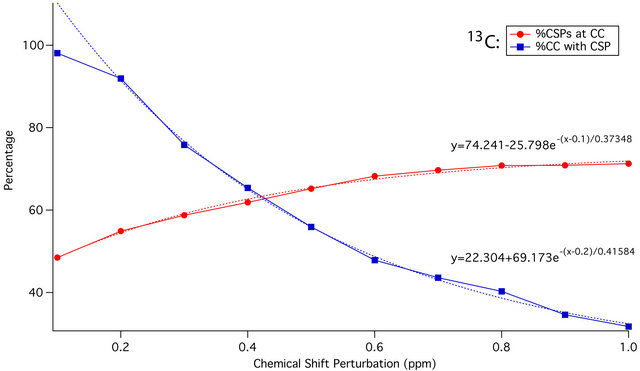
As the CSP cutoff is increased from 0.1 to 1.0 ppm, the percentage of all CSPs greater than or equal to that cutoff occurring at residues with crystal contacts gradually increases. At the same time, the percentage of all crystal contacts that experience such a CSP declines. The intersection of the two curves, as shown in Figure 4, provides the ideal CSP cutoff for maximum sensitivity to the effects of crystal contacts: 0.4 ppm for 13C, and 0.7 ppm for 15N. These cutoffs will be used as the thresholds of significance for binning of CSPs in subsequent statistical analyses, and are consistent with CSPs observed in SAR by NMR as well as PCS studies. CSPs of 0.4 and 0.7 ppm are also readily detectable for most samples using modern NMR spectrometers, and are generally outside of the range of error that could be introduced by manual peak picking or small referencing discrepancies (<0.3 ppm).
It is notable that >60% of CSPs ≥ 0.4 ppm occur at crystal contact sites, and >65% of all crystal contact sites experience CSPs ≥ 0.4 ppm. Either the presence of a significant CSP or the presence of (one or more) crystal contacts is therefore predictive of the other at over 60% accuracy. In such a binary classifier system, a receiver operating characteristic (ROC) curve as shown in Figure 5 may be used to asses predictive ability, by plotting the rate of true positives (sensitivity) against the rate of false positives (1-specificity) [72,74] . The calculated area under the curve (AUC) is 0.649, indicating a predictive accuracy of almost 65% for prediction of significant 13C CSPs based solely on the presence/absence of crystal contacts at a particular residue. Predictive accuracy is further improved among residues that have more than one crystal contact. For instance, 80.7% of all residues with ≥18 crystal contacts within 4.5 Å experience a sig-
 (a)
(a)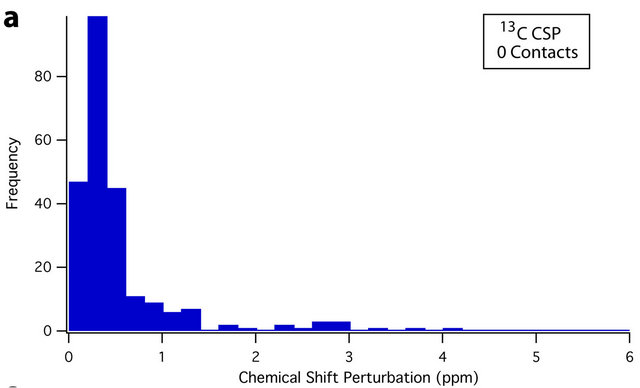 (b)
(b)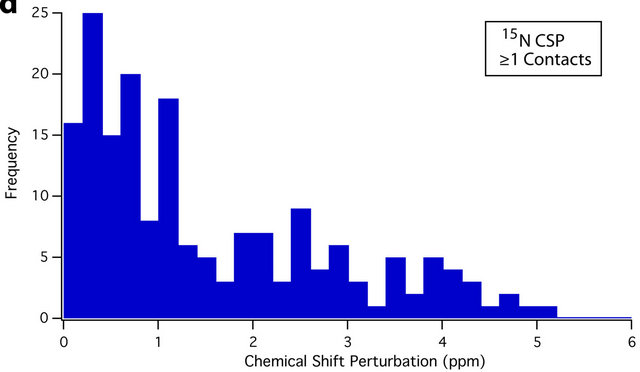 (c)
(c)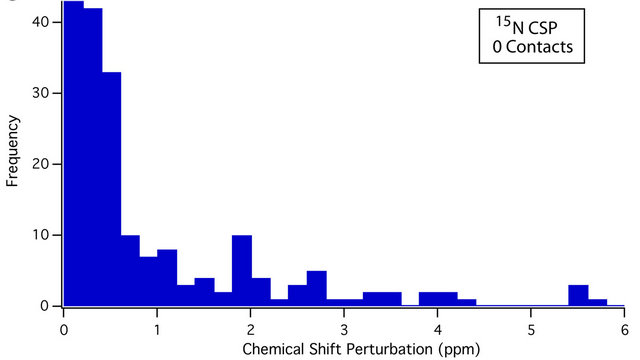 (d)
(d)
Figure 3. Histograms showing the different distributions of average 13C CSPs between residues with no crystal contacts (a), and one or more crystal contacts (b), as well as average 15N CSPs between residues with no crystal contacts (c), and one or more crystal contacts (d). For both 13C and 15N, the differences in distribution are significant at the p = 0.001 (99.9%) confidence level using the Mann-Whitney U test [72,73]. Residues with crystal contacts ((b), (d)) are considerably more likely to experience larger CSPs, as evidenced by their larger “tails” from approximately 0.6 to 5 ppm. The number of data points (N) is 450 and 383 for 13C and 15N respectively.
nificant 13C CSP, while 73.9% of all residues with ≥19 crystal contacts experience a significant 15N CSP as shown in Figure 6.
Statistical modeling (using SPSS Statistics 19.0 [75]) of the dataset provides further support for an association between CSP magnitude and number of crystal contacts. Pearson (parametric) and Spearman (nonparametric) correlations, the results of which are shown in Table 1, demonstrate statistically significant interactions at the p = 0.01 (99%) confidence between observed CSPs and the number of crystal contacts to a particular residue within 4.5 Å.
Results from nonparametric correlations are likely more trustworthy in this case as the signs of the CSPs are neglected (absolute values are used), and the data therefore will not conform to the normality assumption of parametric tests. Though statistically significant even at the p = 0.001 (99.9%) confidence level, the associations in Table 1 have relatively small coefficients of determination, suggesting either that the relationships are not linear or that the number of crystal contacts alone is insufficient to explain observed variance in the CSPs [72]. The relationship is indeed not linear and is in fact best approximated with exponential functions, as shown in Figure 4. Inclusion of additional factors such as the type of contact (i.e. hydrophilic, hydrophobic, ion bridge, etc.) in models may also be necessary to improve their predictive ability. The analysis further shows some statistically significant correlations between the various CSPs and minimum contact distances. Average contact distances were also included but showed no significant or nearly significant correlations. As expected, the minimum contact distances yield negative correlation coefficients, indicating that the magnitude of the CSP increases as contact distances become shorter.
A series of logistic regressions was also performed on the same dataset. Average 13C CSP and 15N CSP were binned at the previously discussed thresholds of significance (≥0.4 and ≥0.7 ppm, respectively) to serve as binary outcome variables. The number of contacts at both distance cutoffs was significantly associated with both 13C and 15N CSPs at the p = 0.01 confidence level. β values from logistic regressions can be used to calculate odds ratios [72]; for instance, the probability of finding a statistically significant CSP increases by eβ, or 5.6% and 6.4% for 15N and 13C respectively with each additional crystal contact using the 4.5 Å cutoff. At the 5.0Å cutoff, these probabilities are 3.1% and 3.0% for each additional 15N and 13C contact, respectively. Minimum contact distance was not found to be a significant predictor of CSPs in logistic regression models. Full results are shown in Table 2.
Taken together, the preceding analyses show that a large proportion (>60%) of significant CSPs occur at residues with close crystal contacts, and an even larger proportion (>65%) of residues with one or more crystal
 (a)
(a)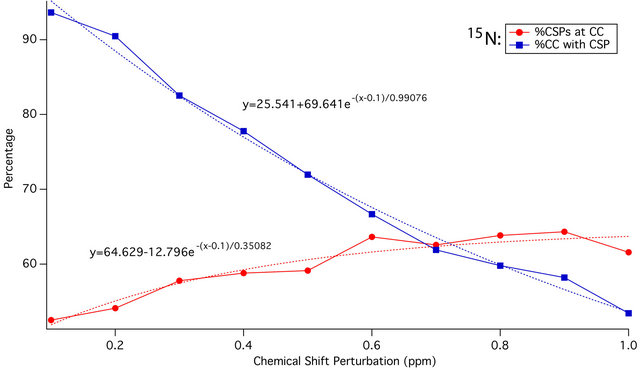 (b)
(b)
Figure 4. Plot of 13C (a) and 15N (b) CSP magnitude against percentage of all CSPs of that or greater magnitude that are located at residues with crystal contacts (red), and percentage of all crystal contact residues experiencing a CSP of that magnitude or greater (blue). Dotted red and blue lines represent the exponential trendlines respectively, with equations shown. The curves intersect at 0.42 ppm and 0.72 ppm respectively, indicating ideal CSP cutoffs of approximately 0.4 ppm and 0.7 ppm for maximum sensitivity.
contacts experience significant CSPs. When the number of contacts is high, as many as 80% of residues experience significant CSPs. Results of logistic regression modeling indicate that each additional crystal contact (within 4.5 Å) increases the probability of a significant CSP by 5% - 7%. As a result, CSPs between solid-state and solution NMR spectra, when both are available, represent good indicators of crystal contact sites in the absence of a crystallographic structure. Conversely, when a crystallographic structure is available and the locations of crystal contacts known, crystal contact sites may be expected to show significant CSPs between solution and solid-state NMR data; mapping of solution NMR assignments to solid-state NMR spectra—a common assignment strategy in SSNMR—can therefore be streamlined by using sites not expected to have significant CSPs as starting points for assignment. For those sites with expected significant CSPs, the SSNMR resonance is likely to differ by at least 0.4 ppm and 0.7 ppm from the solution NMR assignment for 13C and 15N respectively, and could differ by as much as 7 ppm and 22 ppm respectively depending on the number of contacts. However, since CSPs are also observed in and commonly used as indicators of other phenomena, such as ligand binding (i.e. SAR by NMR), oligomerization, and hydrogen-bonding, care should be taken in such analyses. Large patches of surface-exposed hydrophobic residues, for instance, are known to be more likely to form biologically relevant interfaces than crystal contacts, and need to be interpreted accordingly.
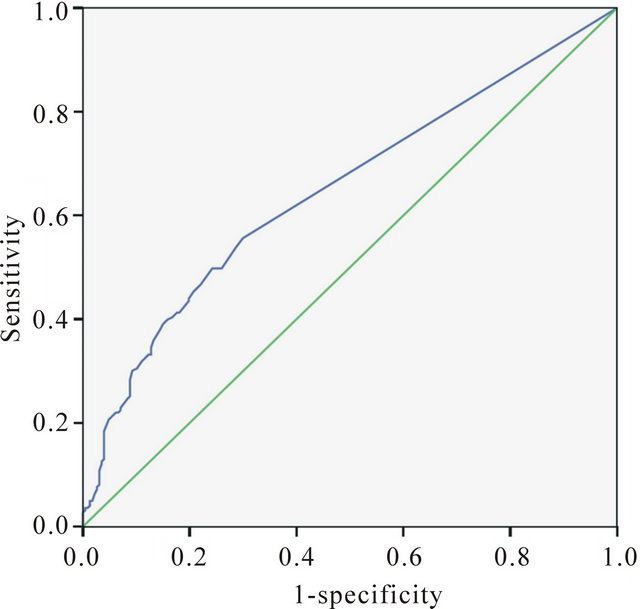
Figure 5. ROC curve ADDIN EN.CITE ADDIN EN.CITE.DATA [72,74] (using SPSS Statistics 19.0 [75]) for prediction of significant (≥0.4 ppm) residueaverage 13C CSPs solely from the presence or absence of a crystal contact within 4.5 Å—both are treated as binary true/false variables for this purpose. The calculated AUC is 0.649, indicating predictive accuracy (true-positive rate) of 64.9%.
Table 1. Statistical parameters for bivariate Pearson (parametric) and Spearman (nonparametric) linear correlations.
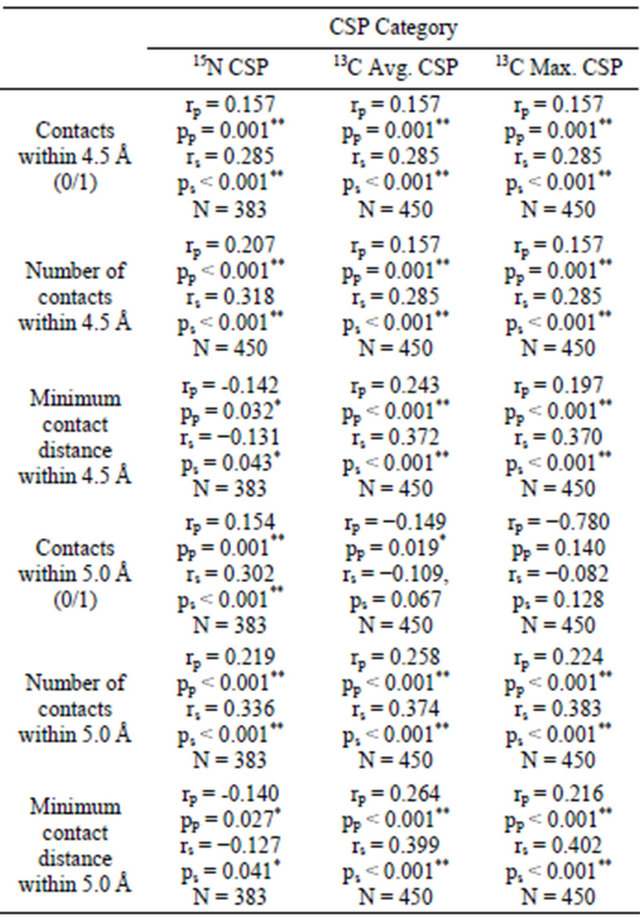
rp: Pearson r coefficient; rs: Spearman r coefficient; pp: Pearson probability of null hypothesis (significance); ps: Spearman probability of null hypothesis (significance); N: Sample size; *Significant at the p = 0.05 (95%) confidence level; **Significant at the p = 0.01 (99%) confidence level.
Table 2. Summary of results of logistic regression parameters.
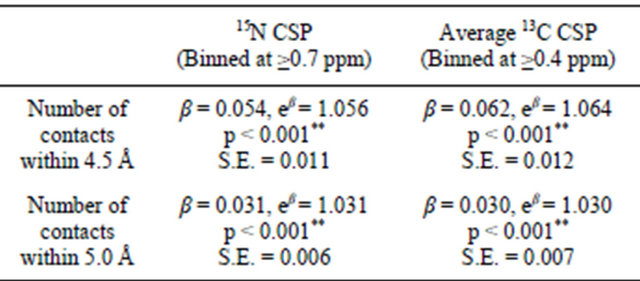
**Significant at the p = 0.01 (99%) confidence level.
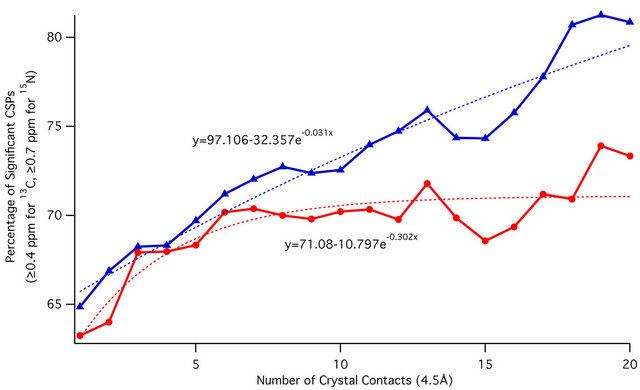
Figure 6. Plot of percentage of average 13C CSPs (blue) and 15N CSPs (red) meeting the threshold of significance (13C: ≥0.4 ppm, 15N: ≥0.7 ppm) against the per-residue number of crystal contacts within 4.5 Å. Exponential best-fit curves are shown as dotted lines, with corresponding equations. Over 80% of residues experience significant 13C CSPs at higher crystal contact counts. For 15N, this value approaches 74%.
4. Conclusion
ACCEPT-NMR is a new tool to analyze, compile, and visualize crystal contacts in the context of SSNMR. Its utility is demonstrated in several examples, and especially in the presented systematic survey of crystal contacts, the raw data for which was largely generated in an automated fashion by ACCEPT-NMR. It is clear from available data that a strong and statistically significant association exists between the number of crystal contacts and CSPs at a given residue, and each may be used to predict the other at accuracies >60% and as high as 80% in certain cases. Statistical models can be used to predict the likelihood of a significant CSP based on the number of crystal contacts, and indicate that this likelihood increases by as much as 5% - 7% for each additional crystal contact. Addition of other pertinent variables to existing statistical models, such as electronegativity, surface area, and hydrogen bonding, will likely further improve predictive accuracy. The ability to predict CSPs is useful for assignment of SSNMR spectra using solution NMR chemical shifts, as well as for mapping experimental CSPs to crystal and other intermolecular contacts in situations where no crystal structure is available. ACCEPTNMR can thereby greatly simplify execution of these tasks, and consequently save valuable time. Features like the isotopic labeling toolbox and spectral prediction can also aid in experimental design, for instance in picking an isotopic labeling scheme specifically for the detection of intermolecular contacts with minimal spectral congestion.
5. Acknowledgements
This work was supported by a grant from the National Science Foundation: MCB 0316248. The authors wish to thank Drs. Yimin Xu, Kuo-Ying Huang, and Simone Gieschler for QA testing and many helpful discussions of the software.
6. Supporting Information Available
Supporting Information is available at the end of this article ACCEPT-NMR Usage Guide; Technical Remarks and Dependencies; Features in Development. Figures: Input (Figure S1) and Results (Figure S2) Panes of ACCEPTNMR; Schematic of Subroutines and Modules (Figure S3).
REFERENCES
- W. T. Franks, K. D. Kloepper, B. J. Wylie and C. M. Rienstra, “Four-Dimensional Heteronuclear Correlation Experiments for Chemical Shift Assignment of Solid Proteins,” Journal of Biomolecular NMR, Vol. 39, No. 2, 2007, pp. 107-131. doi:10.1007/s10858-007-9179-1
- M. Andrec, D. A. Snyder, Z. Y. Zhou, J. Young, G. T. Montellone and R. M. Levy, “A Large Data Set Comparison of Protein Structures Determined by Crystallography and NMR: Statistical Test for Structural Differences and the Effect of Crystal Packing,” Proteins-Structure Function and Bioinformatics, Vol. 69, No. 3, 2007, pp. 449- 465. doi:10.1002/prot.21507
- S. A. Serniwka and G. S. Shaw, “The Structure of the UbcH8-Ubiquitin Complex Shows a Unique Ubiquitin Interaction Site,” Biochemistry, Vol. 48, No. 51, 2009, pp. 12169-12179. doi:10.1021/bi901686j
- S. G. Zech, E. Olejniczak, P. Hajduk, J. Mack and A. E. McDermott, “Characterization of Protein-Ligand Interactions by High-Resolution Solid-State NMR Spectroscopy,” Journal of the American Chemical Society, Vol. 126, No. 43, 2004, pp. 13948-13953. doi:10.1021/ja040086m
- O. Carugo and P. Argos, “Protein-Protein Crystal-Packing Contacts,” Protein Science, Vol. 6, No. 10, 1997, pp. 2261-2263. doi:10.1002/pro.5560061021
- M. A. Scharer, M. G. Grutter and G. Capitani, “CRK: An Evolutionary Approach for Distinguishing Biologically Relevant Interfaces from Crystal Contacts,” ProteinsStructure Function and Bioinformatics, Vol. 78, No. 12, 2010, pp. 2707-2713. doi:10.1002/prot.22787
- S. Dasgupta, G. H. Iyer, S. H. Bryant, C. E. Lawrence and J. A. Bell, “Extent and Nature of Contacts between Protein Molecules in Crystal Lattices and between Subunits of Protein Oligomers,” Proteins-Structure Function and Genetics, Vol. 28, No. 4, 1997, pp. 494-514. doi:10.1002/(SICI)1097-0134(199708)28:4<494::AID-PROT4>3.0.CO;2-A
- J. Janin and F. Rodier, “Protein-Protein Interaction at Crystal Contacts,” Proteins-Structure Function and Genetics, Vol. 23, No. 4, 1995, pp. 580-587. doi:10.1002/prot.340230413
- K. V. R. Kishan, J. P. Zeelen, M. E. M. Noble, T. V. Borchert and R. K. Wierenga, “Comparison of the Structures and the Crystal Contacts of Trypanosomal Triosephosphate Isomerase in 4 Different Crystal Forms,” Protein Science, Vol. 3, No. 5, 1994, pp. 779-787.
- G. Pellicane, G. Smith and L. Sarkisov, “Molecular Dynamics Characterization of Protein Crystal Contacts in Aqueous Solutions,” Physical Review Letters, Vol. 101, No. 24, 2008, 4 p. doi:10.1103/PhysRevLett.101.248102
- C. N. Nanev, “How Do Crystal Lattice Contacts Reveal Protein Crystallization Mechanism?” Crystal Research and Technology, Vol. 43, No. 9, 2008, pp. 914-920. doi:10.1002/crat.200800214
- K. R. Phipps and H. Li, “Protein-RNA Contacts at Crystal Packing Surfaces,” Proteins-Structure Function and Bioinformatics, Vol. 67, No. 1, 2007, pp. 121-127. doi:10.1002/prot.21230
- M. Cieslik and Z. S. Derewenda, “The Role of Entropy and Polarity in Intermolecular Contacts in Protein Crystals,” Acta Crystallographica Section D: Biological Crystallography, Vol. 65, 2009, pp. 500-509. doi:10.1107/S0907444909009500
- R. P. Saha, R. P. Bahadur and P. Chakrabarti, “Interresidue Contacts in Proteins and Protein-Protein Interfaces and Their Use in Characterizing the Homodimeric Interface,” Journal of Proteome Research, Vol. 4, No. 5, 2005, pp. 1600-1609. doi:10.1021/pr050118k
- R. P. Saha, R. Bhattacharyya and P. Chakrabarti, “Interaction Geometry Involving Planar Groups in ProteinProtein Interfaces,” Proteins-Structure Function and Bioinformatics, Vol. 67, No. 1, 2007, pp. 84-97. doi:10.1002/prot.21244
- G. H. Iyer, S. Dasgupta and J. A. Bell, “Ionic Strength and Intermolecular Contacts in Protein Crystals,” Journal of Crystal Growth, Vol. 217, No. 4, 2000, pp. 429-440. doi:10.1016/S0022-0248(00)00503-0
- B. Kobe, G. Guncar, R. Buchholz, T. Huber, B. Maco, N. Cowieson, J. L. Martin, M. Marfori and J. K. Forwood, “Crystallography and Protein-Protein Interactions: Biological Interfaces and Crystal Contacts,” Biochemical Society Transactions, Vol. 36, No. 6, 2008, pp. 1438-1441. doi:10.1042/BST0361438
- M. Das, M. Kobayashi, Y. Yamada, S. Sreeramulu, C. Ramakrishnan, S. Wakatsuki, R. Kato and R. Varadarajan, “Design of Disulfide-Linked Thioredoxin Dimers and Multimers through Analysis of Crystal Contacts,” Journal of Molecular Biology, Vol. 372, No. 5, 2007, pp. 1278-1292. doi:10.1016/j.jmb.2007.07.033
- C. Charron, D. Kern and R. Giege, “Crystal Contacts Engineering of Aspartyl-tRNA Synthetase from Thermus Thermophilus: Effects on Crystallizability,” Acta Crystallographica Section D: Biological Crystallography, Vol. 58, No. 1, 2002, pp. 1729-1733. doi:10.1107/S0907444902012787
- F. L. Zhang and R. Bruschweiler, “Contact Model for the Prediction of NMR N-H Order Parameters in Globular Proteins,” Journal of the American Chemical Society, Vol. 124, No. 43, 2002, pp. 12654-12655. doi:10.1021/ja027847a
- D. M. Ming and R. Bruschweiler, “Prediction of MethylSide Chain Dynamics in Proteins,” Journal of Biomolecular NMR, Vol. 29, No. 3, 2004, pp. 363-368. doi:10.1023/B:JNMR.0000032612.70767.35
- J. K. Song and J. L. Markley, “NMR Chemical Shift Mapping of the Binding Site of a Protein Proteinase Inhibitor: Changes in the H-1, C-13 and N-15 NMR Chemical Shifts of Turkey Ovomucoid Third Domain upon Binding to Bovine Chymotrypsin A (Alpha),” Journal of Molecular Recognition, Vol. 14, No. 3, 2001, pp. 166-171. doi:10.1002/jmr.530
- G. T. Montelione, D. Y. Zheng, Y. P. J. Huang, K. C. Gunsalus and T. Szyperski, “Protein NMR Spectroscopy in Structural Genomics,” Nature Structural Biology, Vol. 7, 2000, pp. 982-985. doi:10.1038/80768
- T. Terada, Y. Ito, M. Shirouzu, M. Tateno, K. Hashimoto, T. Kigawa, T. Ebisuzaki, K. Takio, T. Shibata, S. Yokoyama, B. O. Smith, E. D. Laue and J. A. Cooper, “Nuclear Magnetic Resonance and Molecular Dynamics Studies on the Interactions of the Ras-Binding Domain of Raf- 1 with Wild-Type and Mutant Ras Proteins,” Journal of Molecular Biology, Vol. 286, No. 1, 1999, pp. 219-232. doi:10.1006/jmbi.1998.2472
- J. R. Huth, R. Mendoza, E. T. Olejniczak, R. W. Johnson, D. A. Cothron, Y. Y. Liu, C. G. Lerner, J. Chen and P. J. Hajduk, “ALARM NMR: A Rapid and Robust Experimental Method to Detect Reactive False Positives in Biochemical Screens,” Journal of the American Chemical Society, Vol. 127, No. 1, 2005, pp. 217-224. doi:10.1021/ja0455547
- P. Rajagopal, E. B. Waygood, J. Reizer, M. H. Saier and R. E. Klevit, “Demonstration of Protein-Protein Interaction Specificity by NMR Chemical Shift Mapping,” Protein Science, Vol. 6, No. 12, 1997, pp. 2624-2627. doi:10.1002/pro.5560061214
- M. Schmiedeskamp, P. Rajagopal and R. E. Klevit, “NMR Chemical Shift Perturbation Mapping of DNA Binding by a Zinc-Finger Domain from the Yeast Transcription Factor ADR1,” Protein Science, Vol. 6, No. 9, 1997, pp. 1835- 1848. doi:10.1002/pro.5560060904
- P. J. Hajduk, “SAR by NMR: Putting the Pieces Together,” Molecular Interventions, Vol. 6, No. 5, 2006, p. 266. doi:10.1124/mi.6.5.8
- A. M. Petros, J. R. Huth, T. Oost, C. M. Park, H. Ding, X. L. Wang, H. C. Zhang, P. Nimmer, R. Mendoza, C. H. Sun, J. Mack, K. Walter, S. Dorwin, E. Gramling, U. Ladror, S. H. Rosenberg, S. W. Elmore, S. W. Fesik and P. J. Hajduk, “Discovery of a Potent and Selective Bcl-2 Inhibitor Using SAR by NMR,” Bioorganic & Medicinal Chemistry Letters, Vol. 20, No. 22, 2010, pp. 6587-6591. doi:10.1016/j.bmcl.2010.09.033
- M. P. Foster, D. S. Wuttke, K. R. Clemens, W. Jahnke, I. Radhakrishnan, L. Tennant, M. Reymond, J. Chung and P. E. Wright, “Chemical Shift as a Probe of Molecular Interfaces: NMR Studies of DNA Binding by the Three Amino-Terminal Zinc Finger Domains from Transcription Factor IIIA,” Journal of Biomolecular NMR, Vol. 12, No. 1, 1998, pp. 51-71. doi:10.1023/A:1008290631575
- P. J. Hajduk, E. T. Olejniczak and S. W. Fesik, “OneDimensional Relaxationand Diffusion-Edited NMR Methods for Screening Compounds That Bind to Macromolecules,” Journal of the American Chemical Society, Vol. 119, No. 50, 1997, pp. 12257-12261. doi:10.1021/ja9715962
- S. B. Shuker, P. J. Hajduk, R. P. Meadows and S. W. Fesik, “Discovering High-Affinity Ligands for Proteins: SAR by NMR,” Science, Vol. 274, No. 5292, 1996, pp. 1531-1534. doi:10.1126/science.274.5292.1531
- J. A. Losonczi, E. T. Olejniczak, S. F. Betz, J. E. Harlan, J. Mack and S. W. Fesik, “NMR Studies of the AntiApoptotic Protein Bcl-x(L) in Micelles,” Biochemistry, Vol. 39, No. 36, 2000, pp. 11024-11033. doi:10.1021/bi000919v
- I. Bertini, I. C. Felli, L. Gonnelli, R. Pierattelli, Z. Spyranti and G. A. Spyroulias, “Mapping Protein-Protein Interaction by C-13’-Detected Heteronuclear NMR Spectroscopy,” Journal of Biomolecular NMR, Vol. 36, No. 2, 2006, pp. 111-122. doi:10.1007/s10858-006-9068-z
- D. Gonzalez-Ruiz and H. Gohlke, “Steering ProteinLigand Docking with Quantitative NMR Chemical Shift Perturbations,” Journal of Chemical Information and Modeling, Vol. 49, No. 10, 2009, pp. 2260-2271. doi:10.1021/ci900188r
- A. V. Chernatynskaya, L. Deleeuw, J. O. Trent, T. Brown and A. N. Lane, “Structural Analysis of the DNA Target Site and Its Interaction with Mbp1,” Organic & Biomolecular Chemistry, Vol. 7, No. 23, 2009, pp. 4981-4991. doi:10.1039/b912309a
- Y. M. Xu, J. Lorieau and A. E. McDermott, “Triosephosphate Isomerase: (15)N and (13)C Chemical Shift Assignments and Conformational Change upon Ligand Binding by Magic-Angle Spinning Solid-State NMR Spectroscopy,” Journal of Molecular Biology, Vol. 397, No. 1, 2010, pp. 233-248. doi:10.1016/j.jmb.2009.10.043
- C. Fares, I. Amata and T. Carlomagno, “13C-Detection in RNA Bases: Revealing Structure-Chemical Shift Relationships,” Journal of the American Chemical Society, Vol. 129, No. 51, 2007, pp. 15814-15823. doi:10.1021/ja0727417
- J. Moriya, M. Sakakura, Y. Tokunaga, R. S. Prosser and I. Shimada, “An NMR Method for the Determination of Protein Binding Interfaces Using TEMPOL-Induced Chemical Shift Perturbations,” Biochimica Et Biophysica ActaGeneral Subjects, Vol. 1790, No. 10, 2009, pp. 1368- 1376. doi:10.1016/j.bbagen.2009.06.001
- G. Cornilescu, J. L. Marquardt, M. Ottiger and A. Bax, “Validation of Protein Structure from Anisotropic Carbonyl Chemical Shifts in a Dilute Liquid Crystalline Phase,” Journal of the American Chemical Society, Vol. 120, No. 27, 1998, pp. 6836-6837. doi:10.1021/ja9812610
- A. Favier, B. Brutscher, M. Blackledge, A. Galinier, J. Deutscher, F. Penin and D. Marion, “Solution Structure and Dynamics of Crh, the Bacillus Subtilis Catabolite Repression HPr,” Journal of Molecular Biology, Vol. 317, No. 1, 2002, pp. 131-144. doi:10.1006/jmbi.2002.5397
- W. T. Franks, B. J. Wylie, H. L. Schmidt, A. J. Nieuwkoop, R. M. Mayrhofer, G. J. Shah, D. T. Graesser and C. M. Rienstra, “Dipole Tensor-Based Atomic-Resolution Structure Determination of a Nanocrystalline Protein by Solid-State NMR,” Proceedings of the National Academy of Sciences of the United States of America, Vol. 105, No. 12, 2008, pp. 4621-4626. doi:10.1073/pnas.0712393105
- W. T. Franks, D. H. Zhou, B. J. Wylie, B. G. Money, D. T. Graesser, H. L. Frericks, G. Sahota and C. M. Rienstra, “Magic-Angle Spinning Solid-State NMR Spectroscopy of the Beta 1 Immunoglobulin Binding Domain of Protein G (GB1): N-15 and C-13 Chemical Shift Assignments and Conformational Analysis,” Journal of the American Chemical Society, Vol. 127, No. 35, 2005, pp. 12291- 12305. doi:10.1021/ja044497e
- A. M. Gronenborn, D. R. Filpula, N. Z. Essig, A. Achari, M. Whitlow, P. T. Wingfield and G. M. Clore, “A Novel, Highly Stable Fold of the Immunoglobulin Binding Domain of Streptococcal Protein-G,” Science, Vol. 253, No. 5020, 1991, pp. 657-661. doi:10.1126/science.1871600
- S. Jehle, B. van Rossum, J. R. Stout, S. M. Noguchi, K. Falber, K. Rehbein, H. Oschkinat, R. E. Klevit and P. Rajagopal, “Alphab-Crystallin: A Hybrid Solid-State/Solution-State NMR Investigation Reveals Structural Aspects of the Heterogeneous Oligomer,” Journal of Molecular Biology, Vol. 385, No. 5, 2009, pp. 1481-1497. doi:10.1016/j.jmb.2008.10.097
- A. Loquet, B. Bardiaux, C. Gardiennet, C. Blanchet, M. Baldus, M. Nilges, T. Malliavin and A. Bockmann, “3D Structure Determination of the Crh Protein from Highly Ambiguous Solid-State NMR Restraints,” Journal of the American Chemical Society, Vol. 130, No. 11, 2008, pp. 3579-3589. doi:10.1021/ja078014t
- S. Rozovsky, G. Jogl, L. Tong and A. E. McDermott, “Solution-State NMR Investigations of Triosephosphate Isomerase Active Site Loop Motion: Ligand Release in Relation to Active Site Loop Dynamics,” Journal of Molecular Biology, Vol. 310, No. 1, 2001, pp. 271-280. doi:10.1006/jmbi.2001.4673
- H. L. Schmidt, L. J. Sperling, Y. G. Gao, B. J. Wylie, J. M. Boettcher, S. R. Wilson and C. M. Rienstra, “Crystal Polymorphism of Protein GB1 Examined by Solid-State NMR Spectroscopy and X-Ray Diffraction,” The Journal of Physical Chemistry B, Vol. 111, No. 51, 2007, pp. 14362-14369. doi:10.1021/jp075531p
- M. Schubert, T. Manolikas, M. Rogowski and B. H. Meier, “Solid-State NMR Spectroscopy of 10% 13C Labeled Ubiquitin: Spectral Simplification and Stereospecific Assignment of Isopropyl Groups,” Journal of Biomolecular NMR, Vol. 35, No. 3, 2006, pp. 167-173. doi:10.1007/s10858-006-9025-x
- M. Juy, F. Penin, A. Favier, A. Galinier, R. Montserret, R. Haser, J. Deutscher and A. Bockmann, “Dimerization of Crh by Reversible 3D Domain Swapping Induces Structural Adjustments to Its Monomeric Homologue Hpr,” Journal of Molecular Biology, Vol. 332, No. 4, 2003, pp. 767-776. doi:10.1016/S0022-2836(03)00918-5
- Schrodinger, LLC, “The PyMOL Molecular Graphics System, Version 1.3r1,” Schrodinger, LLC, New York, 2010.
- Y. M. Xu, J. Lorieau and A. E. McDermott, “Triosephosphate Isomerase: N-15 and C-13 Chemical Shift Assignments and Conformational Change upon Ligand Binding by Magic-Angle Spinning Solid-State NMR Spectroscopy,” Journal of Molecular Biology, Vol. 397, No. 1, 2010, pp. 233-248. doi:10.1016/j.jmb.2009.10.043
- K.-Y. Huang, “Ubiquitin Conformational Dynamics and Hydration Shell Dynamics by Solid State NMR,” Columbia University, New York, 2011.
- J. Catalano, “Ligand-Protein Interactions in Cytochromes,” Columbia University, New York, 2011.
- E. Krissinel and K. Henrick, “Inference of Macromolecular Assemblies from Crystalline State,” Journal of Molecular Biology, Vol. 372, No. 3, 2007, pp. 774-797. doi:10.1016/j.jmb.2007.05.022
- E. Krissinel and K. Henrick, “Detection of Protein Assemblies in Crystals,” Proceedings of Computational Life Sciences, Vol. 3695, 2005, pp. 163-174. doi:10.1007/11560500_15
- E. Krissinel, “Crystal Contacts as Nature’s Docking Solutions,” Journal of Computational Chemistry, Vol. 31, No. 1, 2010, pp. 133-143. doi:10.1002/jcc.21303
- K. Chen, L. Kurgan and M. Rahbari, “Prediction of Protein Crystallization Using Collocation of Amino Acid Pairs,” Biochemical and Biophysical Research Communications, Vol. 355, No. 3, 2007, pp. 764-769. doi:10.1016/j.bbrc.2007.02.040
- G. Steinkellner, R. Rader, G. G. Thallinger, C. Kratky and K. Gruber, “VASCo: Computation and Visualization of Annotated Protein Surface Contacts,” BMC Bioinformatics, Vol. 10, 2009, p. 32.
- [61] V. Sobolev, E. Eyal, S. Gerzon, V. Potapov, M. Babor, J. Prilusky and M. Edelman, “SPACE: A Suite of Tools for Protein Structure Prediction and Analysis Based on Complementarity and Environment,” Nucleic Acids Research, Vol. 33, No. 2, 2005, pp. W39-W43. doi:10.1093/nar/gki398
- [62] M. Carrillo-Tripp, C. M. Shepherd, I. A. Borelli, S. Venkataraman, G. Lander, P. Natarajan, J. E. Johnson, C. L. Brooks and V. S. Reddy, “VIPERdb(2): An Enhanced and Web API Enabled Relational Database for Structural Virology,” Nucleic Acids Research, Vol. 37, No. 1, 2009, pp. D436-D442. doi:10.1093/nar/gkn840
- [63] Y. Shen and A. Bax, “SPARTA Plus: A Modest Improvement in Empirical NMR Chemical Shift Prediction by Means of an Artificial Neural Network,” Journal of Biomolecular NMR, Vol. 48, No. 1, 2010, pp. 13-22. doi:10.1007/s10858-010-9433-9
- [64] P. Mattis, S. Kimball, J. MacDonald, O. Taylor, M. Clasen, F. M. Quintero, S. Sandmann, P. O’Briain, M. Singh, K. Rietveld and T. Lillqvist, “The GIMP Toolkit, GTK2+,” 2006.
- [65] L. Wall, “The Perl Programming Language,” 2006.
- [66] “Gtk2-Perl Bindings,” Gtk2-Perl Team, 2009.
- [67] D. Wegscheid, R. Schertler, J. Hietaniemi and G. Aas, “Time::HiRes Module for Perl,” 2008.
- [68] K. Takanori, G. Szabo and J. McNamara, “Spreadsheet::ParseExcel Module for Perl,” 2011.
- [69] J. McNamara, “Spreadsheet::WriteExcel Module for Perl,” 2010.
- [70] L. D. Stein, “Interface to GD Graphics Library for Perl,” 2010.
- [71] T. Boutell, “GD Graphics Library,” 2011.
- [72] E. L. Ulrich, H. Akutsu, J. F. Doreleijers, Y. Harano, Y. E. Ioannidis, J. Lin, M. Livny, S. Mading, D. Maziuk, Z. Miller, E. Nakatani, C. F. Schulte, D. E. Tolmie, R. K. Wenger, H. Yao and J. L. Markley, “BioMagResBank,” Nucleic Acids Research, Vol. 36, No. 1, 2008, pp. D402- D408. doi:10.1093/nar/gkm957
- [73] D. Freedman, R. Pisani and R. Purves, “Statistics,” W.W. Norton & Co., New York, 2007.
- [74] H. B. Mann and D. R. Whitney, “On a Test of Whether One of 2 Random Variables Is Stochastically Larger than the Other,” Annals of Mathematical Statistics, Vol. 18, No. 1, 1947, pp. 50-60. doi:10.1214/aoms/1177730491
- [75] D. Bamber, “Area above Ordinal Dominance Graph and Area below Receiver Operating Characteristic Graph,” Journal of Mathematical Psychology, Vol. 12, No. 4, 1975, pp. 387-415. doi:10.1016/0022-2496(75)90001-2
- [76] “SPSS Statistics,” SPSS, Inc., Chicago, 2010.
- [77] H. Berman, K. Henrick and H. Nakamura, “Announcing the Worldwide Protein Data Bank,” Nature Structural Biology, Vol. 10, No. 12, 2003, pp. 980-980. doi:10.1038/nsb1203-980
- [78] N. R. Silvaggi, L. J. Martin, H. Schwalbe, B. Imperiali and K. N. Allen, “Double-Lanthanide-Binding Tags for Macromolecular Crystallographic Structure Determination,” Journal of the American Chemical Society, Vol. 129, No. 22, 2007, pp. 7114-7120. doi:10.1021/ja070481n
- [79] S. Vijay-Kumar, C. E. Bugg and W. J. Cook, “Structure of Ubiquitin Refined at 1.8 A Resolution,” Journal of Molecular Biology, Vol. 194, No. 3, 1987, pp. 531-544. doi:10.1016/0022-2836(87)90679-6
- [80] K. Y. Huang, G. A. Amodeo, L. Tong and A. McDermott, “The Structure of Human Ubiquitin in 2-Methyl-2,4- Pentanediol: A New Conformational Switch,” Protein Science, Vol. 20, No. 3, 2011, pp. 630-639. doi:10.1002/pro.584
- [81] A. Laganowsky, J. L. Benesch, M. Landau, L. Ding, M. R. Sawaya, D. Cascio, Q. Huang, C. V. Robinson, J. Horwitz and D. Eisenberg, “Crystal Structures of Truncated AlphaA and AlphaB Crystallins Reveal Structural Mechanisms of Polydispersity Important for Eye Lens Function,” Protein Science, Vol. 19, No. 5, 2010, pp. 1031-1043. doi:10.1002/pro.380
- [82] U. Samanta, R. P. Bahadur and P. Chakrabarti, “Quantifying the Accessible Surface Area of Protein Residues in Their Local Environment,” Protein Engineering, Vol. 15, No. 8, 2002, pp. 659-667. doi:10.1093/protein/15.8.659
- [83] G. B. McGaughey, M. Gagne and A. K. Rappe, “PiStacking Interactions: Alive and Well in Proteins,” Journal of Biological Chemistry, Vol. 273, No. 25, 1998, pp. 15458-15463. doi:10.1074/jbc.273.25.15458
- [84] C. H. Robert and J. Janin, “A Soft, Mean-Field Potential Derived from Crystal Contacts for Predicting ProteinProtein Interactions,” Journal of Molecular Biology, Vol. 283, No. 5, 1998, pp. 1037-1047. doi:10.1006/jmbi.1998.2152
- [85] R. L Schwartz, “Sorting with the Schwartzian Transform,” 2006.
1. ACCEPT-NMR Usage
Several important aspects of the input pane (shown in Figure S1) are worth noting. In addition to the atomic coordinates, ACCEPT-NMR requires that an input PDB file contain a set of “CRYST” or “BIOMT” records if it is to generate the symmetry mates required for intermolecular contact analyses. NMR-generated structures are thus generally unsupported as inputs at the current time because they include no such records. A future mode will support loading of NMR-derived structures for the purposes of mapping CSPs. However, any PDB file, regardless of “CRYST” or “BIOMT” records, can be loaded if the “Symmetry Ensemble Already Exists in PDB File” checkbox (Figure S1(b)) within the “Cutoff & Symmetry Operations” section—this mode allows ACCEPT-NMR to ignore crystallographic symmetry and bypass symmetry mate generation.
The “Specify Contact Type(s)” section is populated and
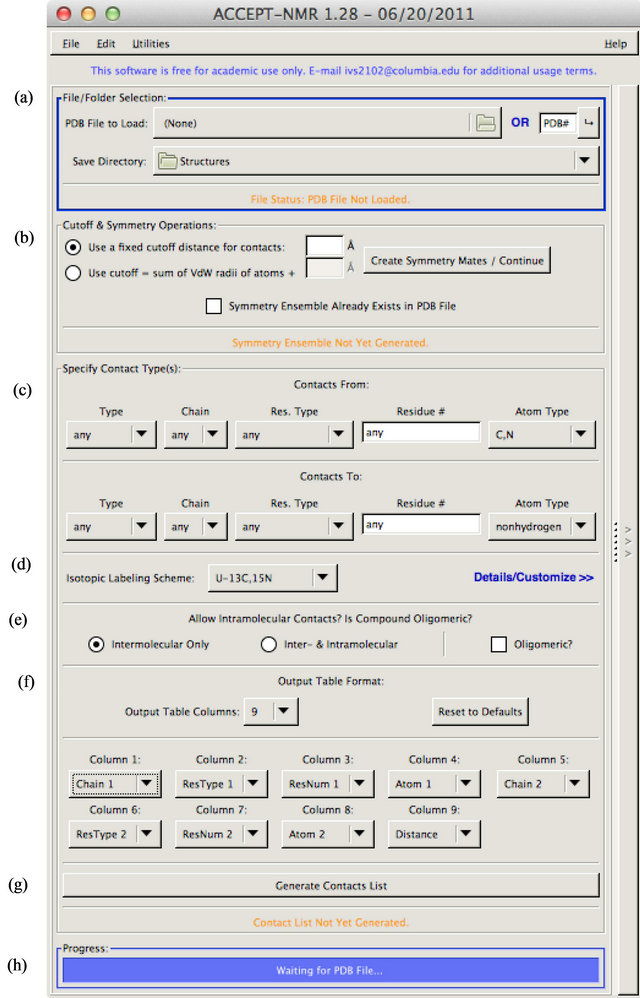
![]() Figure S1. The “input pane” of ACCEPT-NMR, which prompts the user for all required input information, subdivided into specific sections: (a) Input file and output folder selection; (b) Symmetry generation and distance cutoff specification; (c) Contact parameters; (d) Isotopic labeling scheme; (e) Type of contact; (f) Output fields. The submit, or “Generate Contacts List” button (g) is used to proceed to the results pane; while operations are running, progress can be tracked using the progress bar (h).
Figure S1. The “input pane” of ACCEPT-NMR, which prompts the user for all required input information, subdivided into specific sections: (a) Input file and output folder selection; (b) Symmetry generation and distance cutoff specification; (c) Contact parameters; (d) Isotopic labeling scheme; (e) Type of contact; (f) Output fields. The submit, or “Generate Contacts List” button (g) is used to proceed to the results pane; while operations are running, progress can be tracked using the progress bar (h).
available only after symmetry mate generation is concluded (or if this step is skipped as above). As all PDBderived information, including chains, connectivity mapping, and coordinates, is reloaded during the symmetry mate generation step, the various pull-down menus can only be populated after this step. The same is partially true of the isotopic labeling menu. General isotopic labeling schemes such as “U-13C,15N” can be selected at any point, and the custom isotopic labeling display always shows the naturally-occurring amino acids, ribonucleic acid nucleotides, and deoxyribonucleic acid nucleotides, regardless of whether they are present in the input PDB file. However, any unrecognized residues/molecules will not be populated into the custom labeling display until after symmetry mate generation (or, again, bypass thereof).
In the “Specify Contact Type(s)” section, the user may specify desired source and target chains for contacts, as well as specifying molecule type (protein, DNA, or either), residue type, residue number, and atom type. The definition of source and target are arbitrary and left to the user, but exist to prevent “double-counting” of contacts unless such behavior is desired. Chain specifications are selected from a pull-down menu, which includes all chains found in the loaded structure. Residue specification and atom type specification work very similarly, with custom residues or atom designations (e.g. CA or CG2) being populated from the loaded structure. In almost all pulldown menus, an “Other” option exists which allows the user to specify any value not present in the menu or specify more than one value in the form of a comma-separated list. For all text inputs, the wildcard “*” may be used (i.e. residue number: 10* will match residues 100 - 109, 1000 - 1099, etc.).
Upon clicking “Generate Contacts List”, ACCEPTNMR will proceed to scan the full loaded ensemble for atom pairs matching the user-defined specifications using a recursive algorithm. For purposes of efficiency and speed, the list of possible pairs is greatly limited using a modified Schwartzian transform [84] of the Cartesian coordinates, so as to avoid the need to scan every possible pair of atoms and the associated computational cost. Only those contacts matching specified parameters and falling within the specified distance cutoff will be reported to the user. The results pane is displayed to the user upon completion of the necessary calculations and the input pane is hidden, though the results pane includes a “Back” button at left to allow a user to display the input pane once more (i.e. in order to change specifications, etc.). Figure S2 shows a screenshot of the results pane, using the crystal structure of the protein ubiquitin [PDB: 1UBQ] [78] as an example.
The results pane displays both a full table of contacts
(sortable, sorted by distance as default) in the user-specified format and a chart of the contacts grouped into a residue matrix. In the latter, the number displayed on each box is the total number of contacts matching specifications defined on the input pane from the source residue (column) to target residue (row). Scrolling the mouse over each box shows a full listing of all contacts summarized therein, along with information about the total overlap surface area and overlap volume. The primary function of the contacts chart is to help in the identification of contact patches on the secondary structure, which become visually apparent when two groups of neighboring or closely spaced residues form a contact “cluster”; such a cluster is shown in Figure 2 (main manuscript) for the structure of ubiquitin with a lanthanide binding tag [PDB: 2OJR] [77]. Patches on the tertiary structure of the biomolecule of interest will not necessarily be obvious in this mode but can be found after visualization.
Contacts can be selected or deselected using either the contacts table or contacts chart. Contacts in the table may be selected or deselected individually, while clicking a box in the chart representation will simultaneously select/deselect all contacts corresponding to that box. Either action will cause the other display to be updated, such that both accurately represent the selection state of any contact at any given time and a user can switch back and forth at will. Selection/deselection of contacts is important only for subsequent visualization and/or printing results to file. Two save modes are available: “Save Contacts to File” or “Save Summary of Contacts”, with the former printing individual contacts to file and the latter printing a per-residue contact summary; both present the user with the option to save all found contacts or only those that are currently selected, as well as options for choosing the output format.
Contacts can be visualized in PyMol using the “Display Selected Contacts in PyMol” button. The modes shown in Figure S2(c) are fairly straightforward, with “contact” and “chain” modes assigning a separate color for each contact and chain respectively, the “chain & contact” mode performing both operations, and the “number of contacts (gradient)” mode coloring residues using a color gradient based on their total number of contacts. An example of the latter is provided in Figure 2(a) (main manuscript). Importantly, both PyMol visualization and spectral prediction show only those contacts that are marked as selected, with the sole exception of the “number of contacts (gradient)” visualization mode, which must by definition include all contacts detected.
ACCEPT-NMR includes a number of other peripheral features and options that cannot be adequately described here. The full ACCEPT-NMR documentation may be found at http://mcdermott.chem.columbia.edu/software.
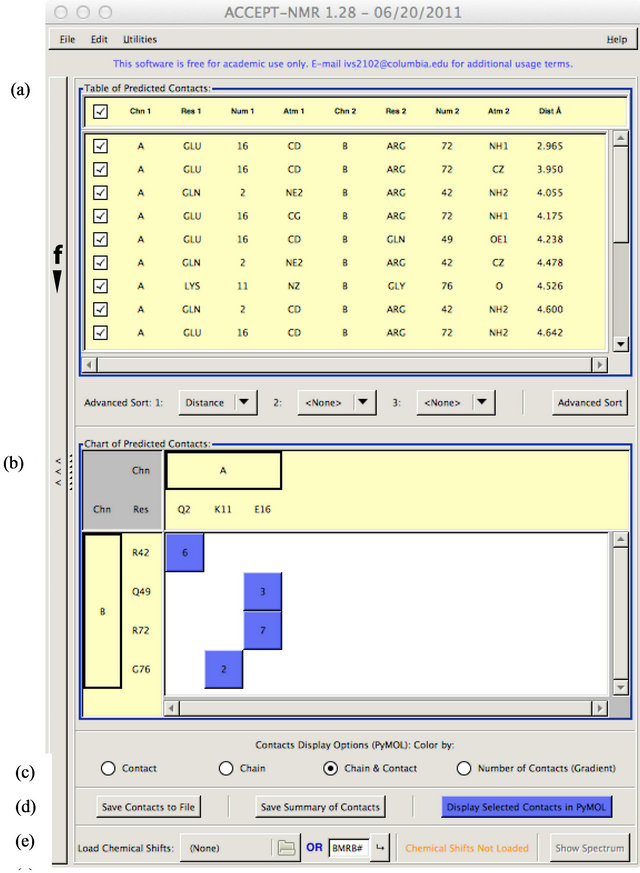
Figure S2. The “results pane” of ACCEPT-NMR, with the PDB file of ubiquitin [PDB: 1UBQ] loaded. Section (a) shows the detected contacts in tabular format, while section (b) presents the same contacts information in a chart by residue. Selections can be selected or deselected for subsequent visualization and output using either display. Section (c) allows the selection of one of four visualization modes in PyMol. Section (d) provides several options to save the output data, either as a full table or as a per-residue summary, and in a variety of formats, as well as containing the “Display Selected Contacts in PyMol” button to open PyMol as per the setting in (c). Section (e) allows for the loading of chemical shift tables, and contains the “Show Spectrum” button to open the spectral prediction display window once one or more chemical shift tables are loaded. The “Back” button, which shows the “input pane” for reference or for modification of input parameters, is labeled as (f).
2. Technical Remarks and Software Dependencies
The code of ACCEPT-NMR is a mix of functional and object-oriented styles, with most GUI elements and critical subroutines included in the main program while features such as isotopic labeling, PDB connectivity information, and spectral prediction are split off into individual Perl modules. Figure S3 shows the full list of subroutines in the code and the interaction between key subroutines and modules as a flowchart. If unable to access its supplementary modules, ACCEPT-NMR will retain the vast majority of its functionality, with the exceptions of isotopic labeling and spectral prediction.
The primary external dependencies of ACCEPT-NMR are Perl (5.8 or greater) [64], the GTK2+ package [63], and the Gtk2-perl bindings to GTK2+ [65]. For most operating systems, these can all be simply installed using user-friendly package managers or downloadable installers. Other dependencies are used only for specific tasks, and are autoloaded if available. Their absence will disable the specific tasks for which they are used, but will not disable overall functionality or prevent ACCEPT-NMR from
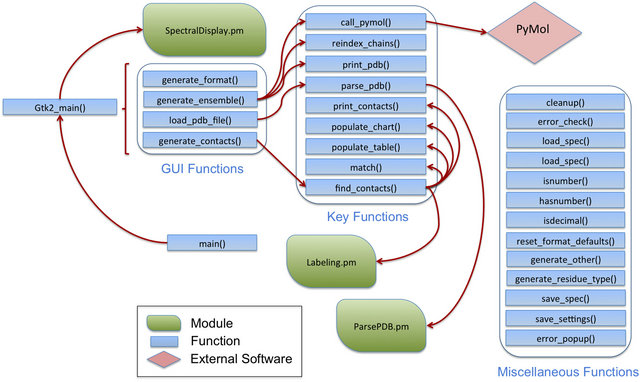
Figure S3. Schematic of subroutines and modules in ACCEPT-NMR, along with their interdependencies and sequence of interactions.
launching. These dependencies are 1) the Spreadsheet: ParseExcel [67] and Spreadsheet::WriteExcel [68] Perl modules for reading from and writing to Microsoft Excel® respectively; and 2) the GD graphics library [70] and the Perl module GD [69] to interface with the library, both used for rendering of the spectral prediction display.
3. Features in Development
ACCEPT-NMR is a work in progress and remains unfinished at the present time. As a result, some features remain incomplete, and many others can ultimately be added/improved to enhance the user experience and add functionality to the toolkit. Specifically, improved algorithms for contact overlap area and volume are needed, as is a calculation of the change in solvent accessible surface due to the presence of contacts. It is likely that these parameters, once built-in, would be more strongly correlated to and better predictors of CSPs than even the number of contacts within 5 Å. The spectral display functionality is currently only capable of 2D spectral predicttion; inclusion of 3D (and possibly higher) modes for various common 3-dimensional NMR experiments (e.g. NCOCA) would be beneficial for more advanced experimental planning and design. Split labeling schemes (e.g. one copy of a dimeric protein uniformly 13C-enriched while a second is uniformly 15N-enriched in order to detect intermolecular contacts) are also unsupported at the current time, but would extend the usefulness of the isotopic labeling module. A special mode to map CSPs from one or more chemical shift tables onto a secondary or 3D structure is only partially complete. Additional tweaks, such as the addition of more file formats for import/export of data and the ability to load/save active ACCEPT-NMR sessions, would improve general ease of use and compatibility with other software. Many of these features are already in development and, once added, will make for a more versatile and useful toolkit.