Journal of Crystallization Process and Technology
Vol.2 No.3(2012), Article ID:21358,6 pages DOI:10.4236/jcpt.2012.23013
Crystallization, Transport and Magnetic Properties of the Amorphous (Fe1–xMnx)75P15C10 Alloys
![]()
1Department of Physics, Begum Rokeya University, Rangpur, Bangladesh; 2Bangladesh University of Engineering and Technology (BUET), Dhaka, Bangladesh; 3Materials Science Division, Atomic Energy Center, Dhaka, Bangladesh.
Email: *mkzaman_phybuet@yahoo.com, {asayem221, fakhan}@phy.buet.ac.bd
Received April 6th, 2012; revised May 5th, 2012; accepted May 14th, 2012
Keywords: Metallic Glass; Melt Spinning Technique; Crystallization; DTA; VSM
ABSTRACT
The amorphous (Fe1–xMnx)75P15C10 (0 ≤ x ≤ 0.30) alloys were prepared by the standard melt spinning technique and investigated their crystallization, thermal, transport and magnetic properties. Crystallization was observed from 400˚C to 650˚C with an interval 50˚C within 30 minutes annealing time by XRD. The as-cast samples were amorphous in nature. Annealing 400˚C to 450˚C samples showed the mixed bcc Fe and amorphous structures. The lattice parameter “a” was varied from 2.855 to 2.859 Å but above 450˚C, samples contained hexagonal, FeP and FeC structures. The lattice parameters “a” and “c” were varied from (5.016 - 5.036) Å and (13.575 - 13.820) Å, respectively. Average crystallite size was found to vary from 8 to 48 nm. Crystallization temperature and weight change were observed by differential thermal analysis and thermogravimetric analysis, respectively. Crystallization temperature was increased with increasing Mn content. Resistivity was increased above and bellows the Curie temperature. Real permeability remained almost constant upto around 106 Hz for of all samples after that it was decreased with increasing frequency and it was also decreased with Mn, whereas imaginary permeability was increased sharply above frequency 107 Hz. The value of saturation magnetization was found to decrease with increment Mn.
1. Introduction
Metallic glasses consist of 3d transition metal elements (Cr, Mn, Fe, Co, Ni) and high valence elements (B, Al, Si, P, C, etc.) which are opaque, ductile and good conductors of electricity and heat. Metallic glasses show amorphous structures with a non equilibrium state, so the amorphous phase can be transfer to a stable equilibrium state by the rise of temperature. There are a number of experimental evidences which indicate that the amorphous structure is crystallized above a certain temperature [1,2]. Crystallization involves a change in properties such as structural, heat capacity, electrical resistivity and magnetic, etc. [3]. Amorphous and nanocrystalline Fe base metal alloys have been attracted both for experimental and theoretical researchers in the fields of solid state physics, electronics and electrical engineering [4-8]. The (Fe1–xMnx)75P15C10 alloys are soft magnetic which have been used as a transformer cores, modern power electronic devices, thermal transport properties of nanometric devices, temperature independent resistors, etc. [8]. Several authors have been reported on the different properties of the (Fe1–xMnx)75P15C10 alloys such as magnetization [9], transport & magnetic [10] and thermoelectric power [11]. But there is no such experimental report on the crystallization process, thermogravimetric analysis and the permeability of the amorphous (Fe1–xMnx)75P15C10 alloys. Here is shown that the details crystallization process, thermogravimetric analysis and the permeability of the amorphous (Fe1–xMnx)75P15C10 alloys. Besides these low temperatures resistivity and magnetization measurements carried out for the purpose of making a comprehensive analysis of the amorphous (Fe1–x Mnx)75P15C10 alloys system which gaining its important in practical.
2. Experimental
The amorphous (Fe1–xMnx)75P15C10 (x = 0.00, 0.10, 0.20 & 0.30) metallic ribbons (0.75 - 1.2 mm in width and 10 - 25 µm in thickness) have been prepared from the appropriate ratio of the pure elements (Fe = Mn = P = C = 99.95%) by standard melt-spinning technique with a wheel speed of 25 m/sec and cooling rate 1.8 × 10⁶˚C/sec. The amorphous nature of as-cast samples was examined by X-ray diffraction (XRD) experiment using a PW 3040- X’Pert PRO (Phillips) CuKα radiation (λ = 1.54178 Å).
Some as-cast ribbons of the same concentration were taken into an aluminium crucible and were ground carefully until they became fine power and then the fine powder was put in an aluminium foil (1.5 cm × 1.5 cm) and folded. The foil along with the folded sample was subjected in a digital furnace (Carbolite, Sheffield, England) to the heat treatment at 400˚C for 30 minutes. After heating 30 minutes at 400˚C, the furnace was allowed to cool to room temperature (RT). When the temperature of the furnace was reached to RT, the sample was taken out from the furnace and ground until it became fine powder. Then the XRD were taken from this fine powder for 2θ values in the range 30˚ to 75˚. The heating and cooling rate of the sample was 10˚C/min and 5˚C/min, respectively. The samples were annealed at 450˚C, 500˚C, 550˚C, 600˚C and 650˚C for 30 minutes and XRD were taken in every case. The whole procedure was repeated for the other concentrations.
The crystallization temperatures (Tx) and the mass loss and/or gain of all the samples were investigated by differential thermal analysis (DTA) and thermogravimetric analysis (TGA) (Seiko-Ex-STAR-6300, Japan), respectively. Resistivity, ρ (T) was measured by the four point probe method in the temperature range (93 - 298) K with an interval 5 K. Complex permeability was measured as a function of frequency from 100 Hz to 100 MHz of ascast samples using LF Impedance Analyzer (4192A, 100 Hz - 110 MHz). Room temperature magnetization was measured with the vibrating sample magnetometer (VSM, Model 7400) at the department of Physics and Astronomy, Delaware University, Newark, DE19716 USA, in the range of (0 - 2.0) T magnetic field.
3. Results and Discussion
3.1. X-Ray Diffraction Analysis (XRD)
The XRD patterns of all as-cast and annealed samples as shown Figure 1 and Figures 2(a)-(d), respectively. Each as-cast sample contains a small broad peak that confirms the samples are amorphous in nature. Annealing from
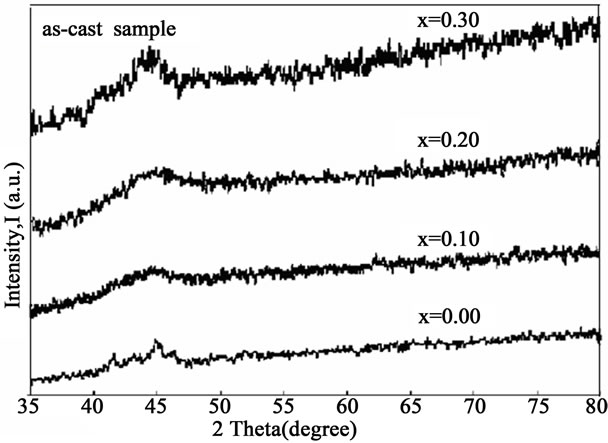
Figure 1. XRD of as-cast sample for x = 0.00, 0.10, 0.20 and 0.30.
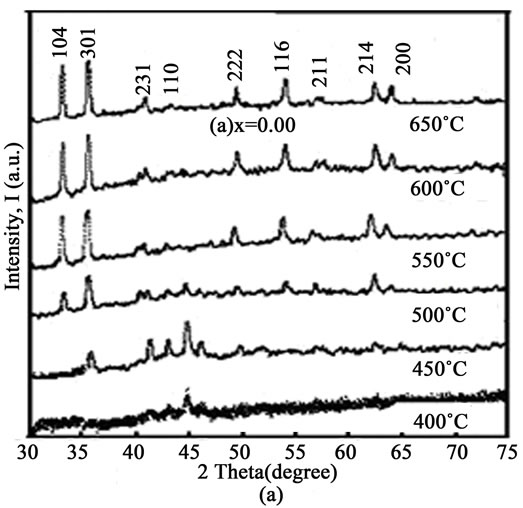


Figure 2. XRD patterns of (a) x = 0.00; (b) x = 0.10; (c) x = 0.20; and (d) x = 0.30 for 400˚C to 650˚C annealing temperature.
400˚C to 450˚C, each sample contains a few peaks which are identified as (301), (231) and (110) Millar planes. Besides these, there have also some tiny peaks that indicate residual amorphous nature. The lattice parameter “a” of the samples was calculated for (110) plane using the following relation (1).
 (1)
(1)
The lattice parameter “a” for x = 0.00 is 2.856 Å which is consistent with a bcc Fe structure [12] and the value of “a” increases slightly with increasing Mn content (as shown in Table 1). Increasing lattice parameter and hence the unit cell volume with Mn content is due to the volume expansion effect, as Mn has the larger ionic radius (0.89 Å) compared to Fe (0.74 Å) [13]. Linear increasing of the lattice parameter of these alloys with Mn content suggests a simple dilution process. Annealing
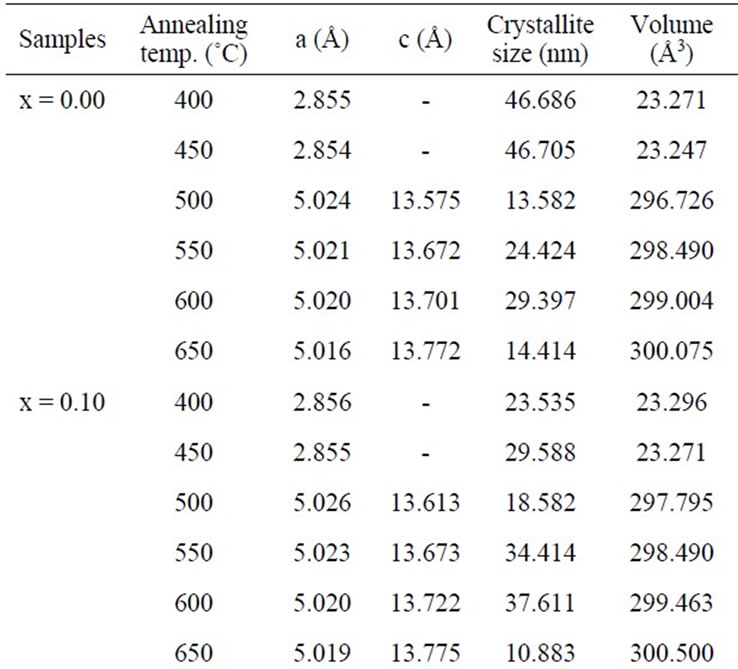
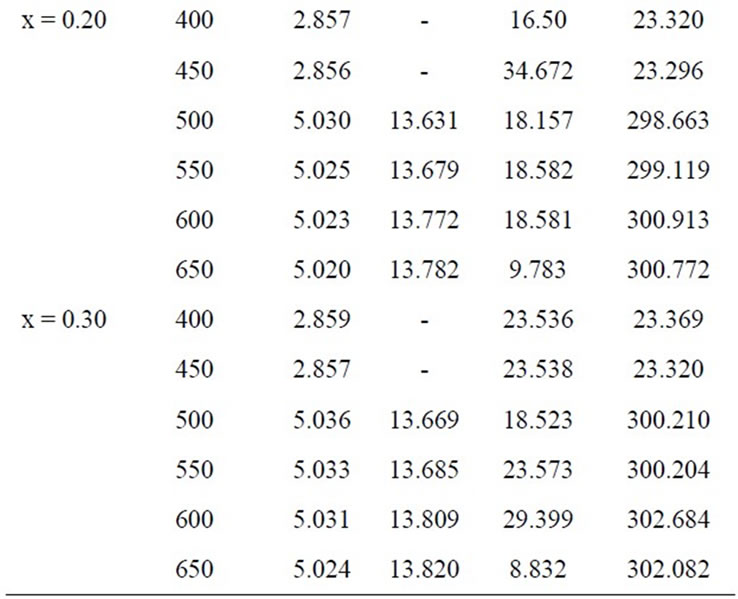
Table 1. Lattice parameters, crystallite size and volume of x = 0.00, 0.10, 0.20 and 0.30 at different temperature.
from 500˚C to 650˚C height of the (110) plane diminishes and simultaneously some new sharp peaks with very low intensity arise in the spectra which are identified as (104), (222), (116), (211), (214) and (200) Millar planes respectively. This result may be yield from the crystallization of the residual amorphous phase and also the structural change of the samples from 500˚C to higher temperatures. Structure of these alloys is consistent with hexagonal, FeP, FeC structure (JCPDS card No. 80-0042) and with the XRD machine code reference 76-0182 [12]. The lattice parameters (a and c) were calculated for the (116) and (214) plane using the following relation (2).
 (2)
(2)
The lattice parameters “a” & “c” varies from 5.016 to 5.036 Å and 13.575 to 13.820 Å, respectively. The lattice parameters, crystallite size and volume of all the samples with temperature as shown in Table 1. The average crystallite size of the samples was estimated from the broadening of the corresponding X-ray spectral peaks using the Scherrer formula.
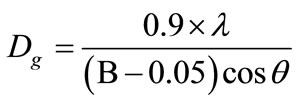 (3)
(3)
where Dg is the average grain size, λ is the wavelength of the CuKα radiation, 0.05 is the instrumentation broadening, B is the full width at half-maximum (FWHM) of a diffraction peak expressed in radians and θ is the Bragg angle. The estimated average crystallite size of the samples lies in between 16 nm to 47 nm for temperature 400˚C to 450ºC and 8 nm to 48 nm in the temperature range 500˚C to 650˚C. The crystallization process of the amorphous (Fe1–xMnx)75P15C10 alloys proceeds through the whole annealing temperature is shown in the following way:

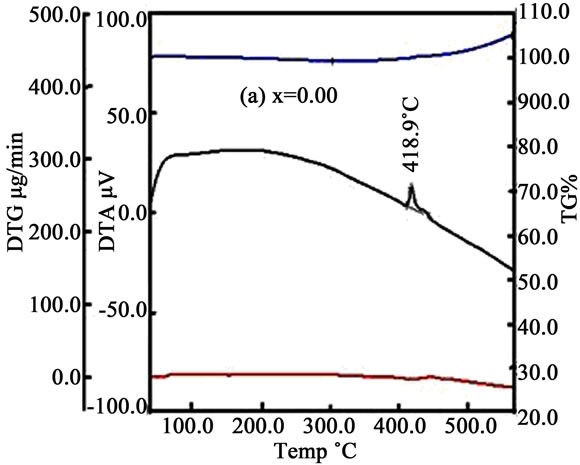
3.2. DTA, TG% and DTG
Some thermal traces such as DTA, TG% and DTG of the samples is shown in Figures 3(a)-(d). From DTA trace of Figures 3(a)-(d) we see that crystallization temperature (Tx) increases with increasing Mn. With the increasing temperature the micro voids which formed during the growth process of the ribbon during melt spinning are gradually eliminated. At higher temperature both Fe and Mn ions are oxidized by the environment and hence the mass could be slightly enhanced (fig. TG%). It is assumed that the volume/grain may be increased as with Mn because of the ionic radius of Mn (0.89 Å) is larger than the ionic radius of Fe (0.74 Å). In the DTG curves some small peaks are found for x = 0.00 & 0.10 whereas for x = 0.20 & 0.30 some broad peaks are generated in the trace which indicate that there is a change of mass within a small change of heating temperature or time.
 (a)
(a)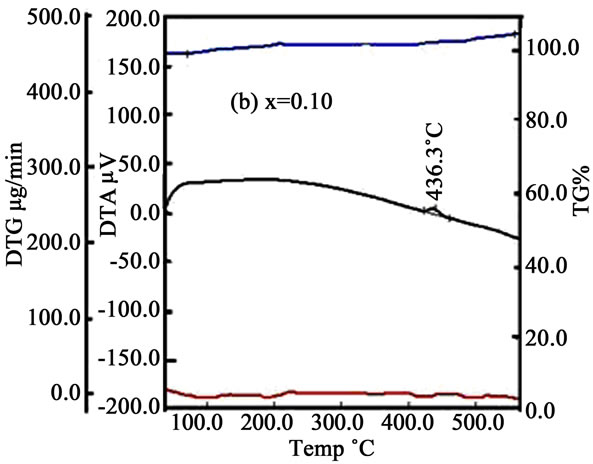 (b)
(b) (c)
(c)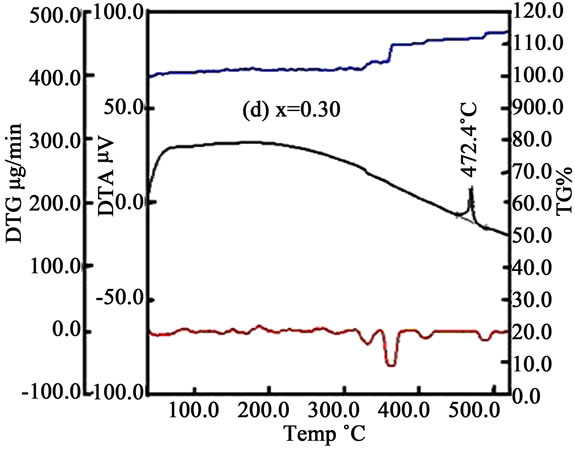 (d)
(d)
Figure 3. DTA, TG% and DTG curves with temperature for (a) x = 0.00; (b) x = 0.10; (c) x = 0.20 and (d) x = 0.30.
3.3. Temperature Dependent Resistivity
Variation of resistant within temperature 93 K to 298 K is shown in Figure 4. From Figure 4 it is seen that ρ (T) for x = 0.00 decreases almost linearly with decreasing temperature. Although there is no contribution of Mn but the incoherent electron-magnon scattering contribute to the resistivity and this scattering may be decreased with decreasing temperature. But for x = 0.10 & 0.20, the resistivity increases with the decrease of temperature. Since the Curie temperature of x = 0.10 is 420 K and of x = 0.20 is 350 K [11,14]. Resistivity increasing below the Curie temperature is due to the structural topological scattering. Whereas for x = 0.30 resistivity decreases nearly up to the Curie temperature (Tc = 166 K) and the resistivity shallow minima also observed which has been assigned to a competition of structural and spin scattering [10,15].
3.4. Permeability
The dynamic response of the magnetic domains to the external magnetic field determines the complex permeability. The real, µ/ and imaginary, µ// permeability were calculated using the following relations (4) and (5)
 (4)
(4)
 (5)
(5)
where, Ls is the self-inductance of the sample core and  is derived geometrically. Here L0 is the inductance of the winding coil without the sample core, N is the number of turns of the coil (N = 5), S is the area of cross section of the toroidal sample as given by,
 , where
 , here d1 & d2 are inner and outer diameters,
  height and
  is the mean diameter of the toroidal sample is given as:

Figure 4. Variation of resistivity of (Fe1–xMnx)75P15C10 from 93 K to 298 K.
The real part, µ/ and imaginary part, µ// of the permeability of as-cast samples are presented separately as a function of frequency in Figures 5(a) and (b).
The real permeability for x = 0.00 is of the order of 102 and this value decreases with the increase of Mn content (Figure 5(a)). With the increase of Mn both the randomization and antiferromagnetic interaction increases as a result the permeability decreases. In the lower frequency, permeability originates from the Bloch wall (BW) motion. Since the real permeability does not drop to zero at the lower frequency, so the BW’s are not very mobile from the start of the frequency. That in turn suggests very broad BW’s. When the frequency gets higher than 106 Hz, the BW cannot follow the applied force. At higher frequency (above 107 Hz) imaginary permeability increases sharply that means at higher frequency, the Bloch wall oscillations could yield a very strong oscillator with a high loss (as shown in Figure 5(b)) developing near to the end of the BW-motion regime.
3.5. Magnetization
The magnetic effect of Mn content into the amorphous (Fe1–xMnx)75P15C10 system was investigated by measuring the room temperature magnetization (Figure 6). Room temperature saturation magnetization decreases with the
 (a)
(a) (b)
(b)
Figure 5. Variation of permeabilities (a) Real and (b) Imaginary with frequency.
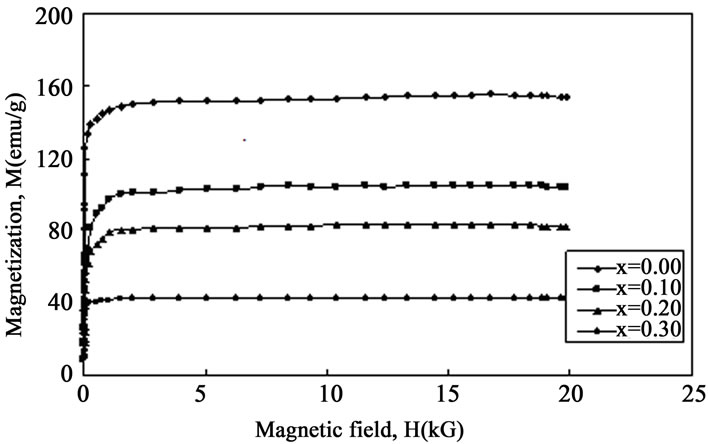
Figure 6. Variation of room temperature magnetization as a function of magnetic field.
step-up of Mn content. As with the increment of Mn content into the (Fe1–xMnx)75P15C10 system it is assumed that the isolated antiferromagnetic (AF) coupled sites simply order antiparallel to the majority ferromagnetic (FM) order. These magnetic properties lead to the suggestion that the antiferromagnetic interactions introduced by Mn atoms cause deviations from a pure ferromagnetic structure and may reducing the total magnetization.
4. Conclusion
Crystallization experiments were done on the amorphous (Fe1–xMnx)75P15C10 ribbons. The bcc Fe and amorphous structures were observed in the temperature range 400˚C to 450˚C and the hexagonal, FeP, FeC structures were found between the temperature 500˚C and 650˚C. The crystallite size of the samples lies in between 16 nm to 47 nm for temperature 400˚C to 450˚C and whereas 8 nm to 48 nm in the temperature range 500˚C to 650˚C. The crystallization temperatures were detected from DTA trace 418.9˚C, 436.3˚C, 449.7˚C and 472.4˚C for x = 0.00, 0.10, 0.20 and 0.30, respectively. Resistivity increases above and below the Curie temperature. Real permeability remain constant up to 106 Hz where as imaginary permeability sharply increases above 107 Hz. Room temperature saturation magnetization gradually decreases with the increase of Mn content. From these comprehensive analyses we may suggests that these alloys are soft magnetic materials and may be used as a transformer core, thermal transport properties of nanometric devices, temperature independent resistors, etc.
5. Acknowledgements
The authors would like to express their thanks to Professor K. Bärner, Department of Physics (4 physik), University of Göttingen, Germany, for preparing and providing the samples used in this study and his valuable discussion regarding the results. The authors would also like to express their thanks to Professor G. C. Hadjipanayis, Department of Physics and Astronomy, University of Delaware, USA for magnetization measurement. The authors would like to thankful to Bangladesh University of Engineering and Technology (BUET) for assistance.
REFERENCES
- P. Duwez, “Structure and Properties of Alloys Rapidly. Quenched from the Liquid State,” ASM Trans, Vol. 60, 1967, pp. 607-633.
- H. Jones, “Splat cooling and metastable phases,” Reports on Progress in Physics, Vol. 36, No. 11, 1973, pp. 1425- 1497. doi:10.1088/0034-4885/36/11/002
- M. G. Scott, “Amorphous Metallic Alloys,” Butterworths, London, 1983.
- A. M. Maricic and M. V. Susic, “Correlation of electrical and Magnetic Permeability with crystallization of Glassy Iron Alloys,” Journal of the Serbian Chemical Society, Vol. 56, No. 8-9, 1991, pp. 473-478.
- N. Mitrovic, S. Djukic, A. Maricic, P. Petrovic and A. K. Glisovic, “Magneto impedance. Effect in Joule-heated Fe-Al-Ga-P-C-B Metallic Glasses with a Large Super cooled Liquid Region, Science of Sintering,” Current problems and new trends, Vol. 80, 2003, pp. 351-358.
- N. Mitrovic, R. Simeunovic, A. Maricic and B. Jordovic, “Synthesis, Preparation and properties of New Fe-based Soft Magnetic Amorphous Alloys with a Large Supercooled Liquid Region,” Materials Science Forum, Vol. 452-453, 2004, pp. 367-374. doi:10.4028/www.scientific.net/MSF.453-454.367
- N. E. Cusack, “Amorphous Metals,” IAEA, Wien, 1987.
- Y. Yoshizawa and K. Yamauchi, “Magnetic properties of Fe-Cu-M-Si-B (M = Cr, V, Mo, Nb, Ta, W) alloys,” Materials Science and Engineering: A, Vol. 133, 1991, pp. 176-179. doi:10.1016/0921-5093(91)90043-M
- A. K. Sinha, “Temperature and Field Dependence of Magnetization of Amorphous (Fe, Mn)-P-C Alloys,” Journal of Applied Physics, Vol. 42, No. 1, 1971, pp. 338-342. doi:10.1063/1.1659598
- K. Heinemann and K. Bärner, “Transport and magnetic properties of amorphous (Fe1–xMnx)75P15C10 alloys,” Journal of Magnetism and Magnetic Materials, Vol. 42, No. 3, 1989, pp. 257-264. doi:10.1016/0304-8853(84)90111-2
- E. Kraus, K. Barner, F. A. Khan, I. V. Medvedeva, H. Schicketanz, P. Terzieff and K. Heinemann, “Thermoelectric Power of some (Fe1–xMnx)75P15C10 amorphous Alloys,” physica status solidi (a), Vol. 177, No. 2, 2000, pp. 547-553. doi:10.1002/(SICI)1521-396X(200002)177:2<547::AID-PSSA547>3.0.CO;2-B
- T. Masumoto and H. Kimura, “Crystallization Process of Iron-base Amorphous Alloy (Fe-P-C) Quenched from Liquid,” Journal of the Japan Institute of Metals, Vol. 39, No. 3, 1975, pp. 273-280.
- J. Shobaki, I. A. Al-Omari, M. K. Hassan, K. A. Azez, M.-A. H. Al-Akhras, B. A. Albiss, K. A. Azez, H. H. Hamdeh and S. H. Mahmood, “Mössbauer and structural studies of Fe0.7−xVxAl0.3 alloys,” Journal of Magnetism and Magnetic Materials, Vol. 213, No. 1-2, 2000, pp. 51- 55. doi:10.1016/S0304-8853(99)00621-6
- E. Kraus, K. Barner, K. Heinemann, T. Kanomata, I. V. Medvedeva, P. Maldal and E. Gmelin, “Some thermal properties of amorphous (Fe1–xMnx)75P15C10 Ribbons,” P physica status solidi (a), Vol. 157, No. 2, 1996, pp. 449- 454. doi:10.1002/pssa.2211570229
- B. Heinrich, D. Fraitova and V. Kambersky, “The Influence of s-d Exchange on Relaxation of Magnons in Metals,” physica status solidi (b), Vol. 23, No. 2, 2006, pp. 501-507. doi:10.1002/pssb.19670230209
NOTES
*Corresponding author.