Journal of Analytical Sciences, Methods and Instrumentation
Vol.2 No.1(2012), Article ID:17803,5 pages DOI:10.4236/jasmi.2012.21003
Determination of Sedative Component in Chinese Medicines by High Resolution Chromatography-Electron Impact-Mass Spectrometry
![]()
1State Key Laboratory of Coal Conversion, Institute of Coal Chemistry, Chinese Academy of Sciences, Taiyuan, China; 2Shanxi Northern Xing’an Chemical Industry Co., Ltd., Taiyuan, China.
Email: *zhangcm@sxicc.ac.cn
Received October 18th, 2011; revised November 21st, 2011; accepted December 2nd, 2011
Keywords: Chinese Medicine; GC-EI-MS; HPLC; Clonazepam; Estazolam
ABSTRACT
The sedative compounds in two traditional Chinese medicines were studied. These compounds are present in the medicinal herbs “Zao Ren” and “Lu Lu Tong”. The samples were first extracted by ethanol and pre-treated by ultrasonic wave, and then they were separated and qualitatively analyzed by high-resolution GC-EI-MS and High Performance Liquid Chromatography (HPLC) systems. We have found that the Chinese herb medicines “Zao Ren” contained clonazepam (120 ppm), whereas “Lu Lu Tong” Chinese drug contained estazolam (270 ppm). The Analytical measurements were done by using three different diagnostic indices using the GC-retention time of the GC-EI-MS total-ionchromatogram; single stage EI-MS analysis identification and from the measurements of the retention time in the HPLC.
1. Introduction
In the world, many people are suffering from neurological diseases which cause serious anxiety, insomnia, convulsions, and epilepsy [1]. These patients often need drugs to relieve their symptom. Western medicine have used in the last century natural product extracts and chemical synthesized derivative drugs for treating various diseases. This technology has evolved to derive from and possessing a certain composition and mature analysis methods, is wisely used.
Although the traditional Chinese medicine (TCM) uses commonly mixture of natural substances to treat with great efficacy the various neurological diseases; their utilization is constrained, due to the unknown chemical nature of the effective components. Therefore, it is primordial to determine and identify the exact chemical composition and structure of the effective components from TCM.
In China, the development of the component analysis of the TCM (including herbal) used for the treatment of diseases is still at the initial stage, however, recently, some analyses have been reported in the literature [2-12]. Unfortunately, there are no reports dealt about treating neurological diseases.
Generally speaking, the study of treatment of neurological diseases by the TCM can involve many aspects. We can postulate that the TCM may contain medicinal drugs, whose chemical structures are similar to the one contained in western medicine. The next question we would like to solve is which is the most critical active constituent in the TCM? Finally, we would like to try to understand and define the treatment mechanism of Chinese TCM.
Accordingly, in this rationale we are reporting our efforts on the analysis of the TCM component. After a series of analytical experimental studies, we have established a method for analyzing and several effective components of TCM.
2. Experimental
2.1. Apparatus, Reagents and Samples
A Waters Breeze 1525 High Performance Liquid Chromatography (HPLC) with a Waters 1525 Binary High Performance Liquid Chromatography pump and a dual λ 2487 UV detector (from USA Instrument equipped) was used. The chromatographic column used is VP-ODS column, 4.6 × 150 mm, made in Japan. In analysis, three columns were used in series. The column temperature was 14˚C and the UV wavelength was 254 nm. Ethanol was the mobile phase with a flow rate of 0.6 ml/min.
The GC-EI-MS instrument used was a Finnigan tracking Analyzer (US Finnigan Corporation). The column was DB-5MS, 30 meters in length, 0.25 mm in diameter and 0.25 mm in film thickness. Helium was used as carrier gas with a flow rate of 1.0 ml/min. The GC/MS instrument was kept at 70˚C for 4 minutes as initial temperature, and then it was heated to 250˚C at a rate of 10 ˚C/min and maintained 3 minutes at 250˚C. Electron impact was 70 electron volts (eV), atomic mass (Da) range was 30 - 350.
Analytical pure reagents such as chloroform, ethanol and methanol were purchased from the Tianjin Bodi Chemical Co., Ltd (China). The pure Estazolam (99.5, pure) and pure clonazepam (99.7, pure) were supplied by Tianjin Pacific Pharmaceutical Co., Ltd. (China) and Jiangsu En-hua Pharmaceutical Co. Ltd. (China), respectively. The Traditional Chinese medicine “Zao Ren” and “Lu Lu Tong” were supplied by Heilongjiang Ji-ren Pharmaceutical Co. Ltd. and Yunnan Pharmaceutical Co. Ltd., respectively.
2.2. Sample Pretreatment
The medicinal herbs were grounded into powder. Initially, 0.2 grams of the powdered sample together with 50 ml of ethanol were mixed in a flask. The solution in the flask was shaken in the ultrasound equipment for 1 hour, and allowed to stand for 2 hours. After filtration, the solution was reduced by evaporation to a fixed volume, and then analyzed by HPLC and GC-EI-MS.
2.3. Qualitative Analysis
Three different methods were used for the various qualitative analyses:
1) Checking the retention time (RT) values of pure reagent in the total ion chromatograph obtained by GCEI-MS. This method is widely used to identify the components in GC-EI-MS analysis.
2) Comparing the m/z values of the EI-MS mass spectra between the analyses and known compounds from the NIST Data library affords the chemical identity of the analyzed sample.
3) Detecting the retention time (RT) values of pure separated compounds by HPLC analysis can help in providing some indices of identification for the analyses as well.
2.4. Eexternal Standard Quantitative Method
The external standard solution is prepared by dissolving 0.1000 g of the pure reagents into 500 ml of ethanol.
Through chromatographic analysis, the mass fraction of each component in the sample was calculated by the following equation:
 (1)
(1)
where Ce and Cs are the concentration of external standard solution and sample solution, respectively; Pe is the purity of external standard reagent; Ss and Se are the peak area response of the component in the sample and external standard solution, respectively; Vs and Ve are the injected volumes of the sample solution and external standard solution into chromatography, respectively;Ws-c% is the mass fraction of the component in samples.
3. Results and Discussion
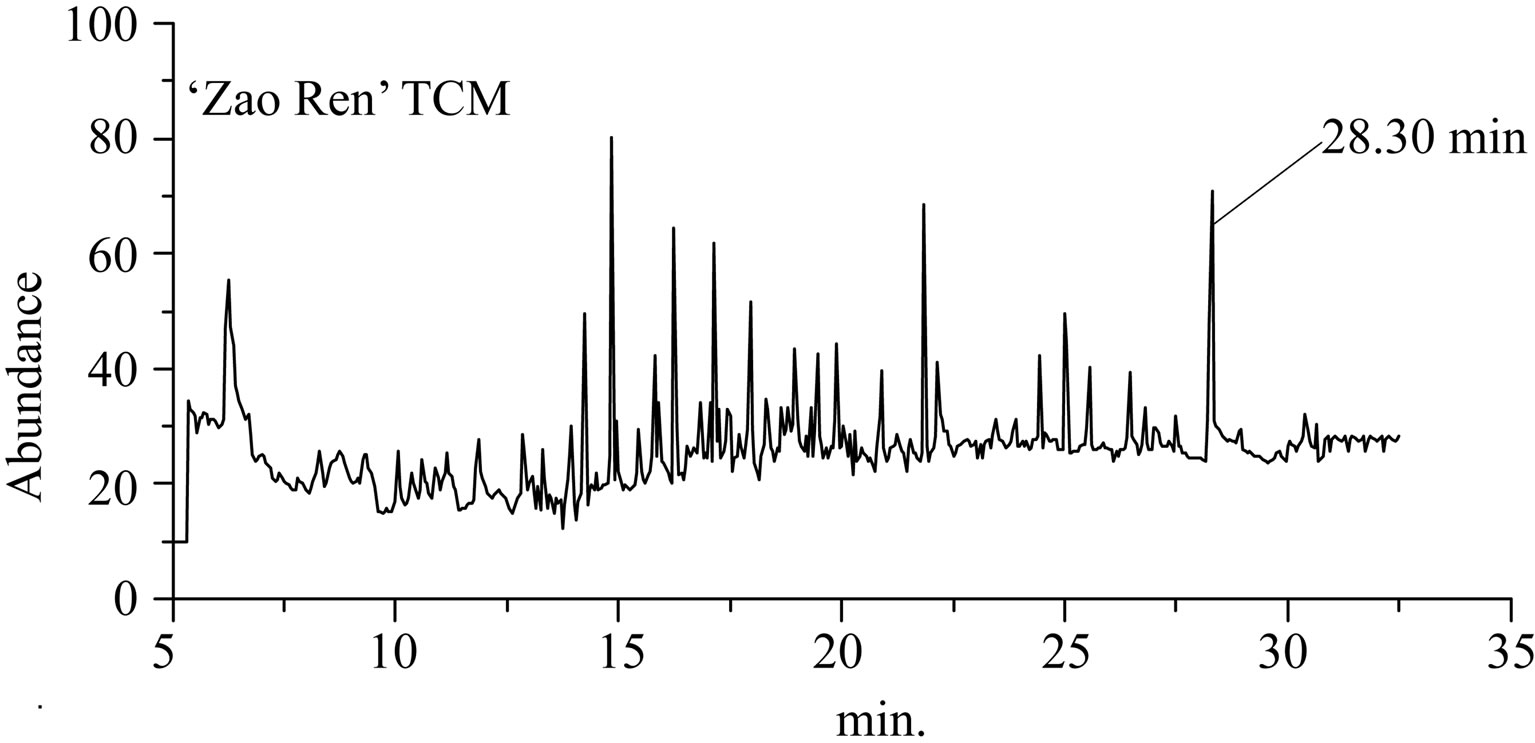
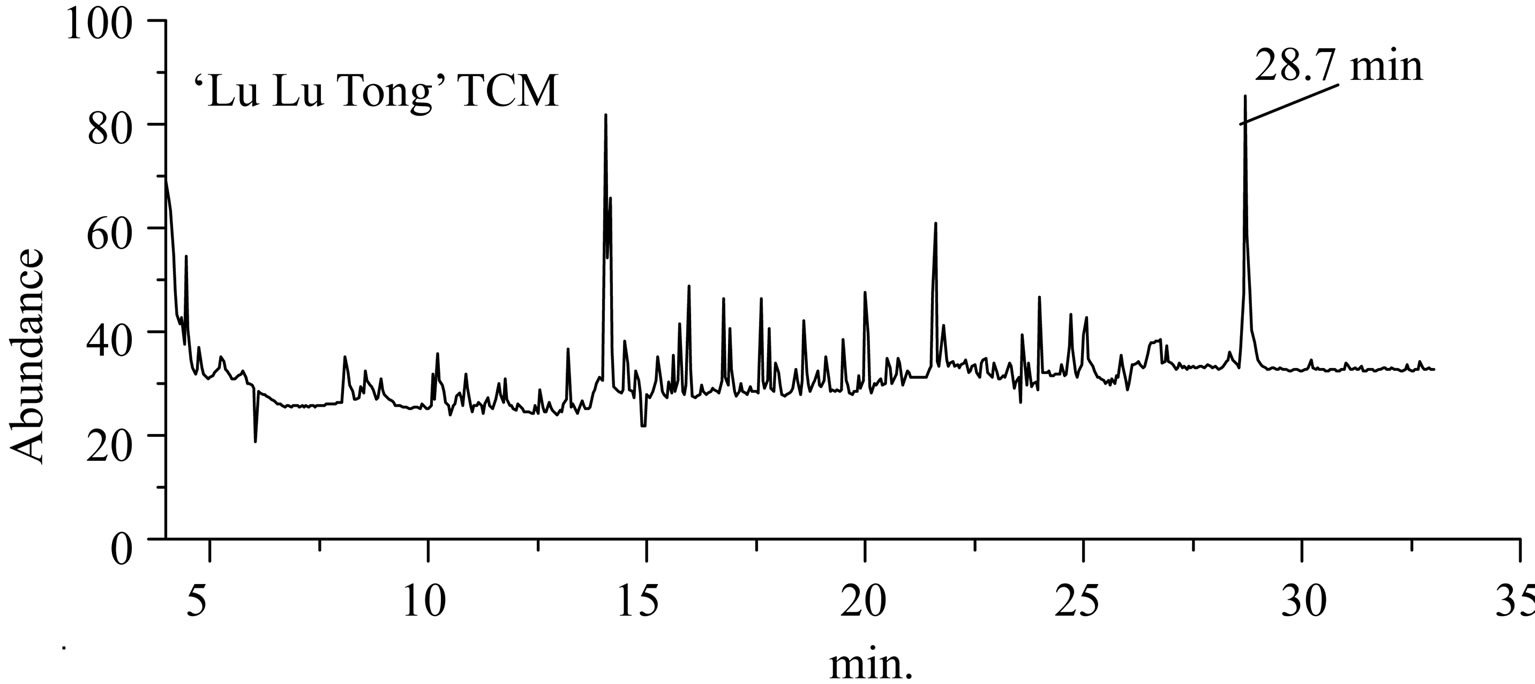
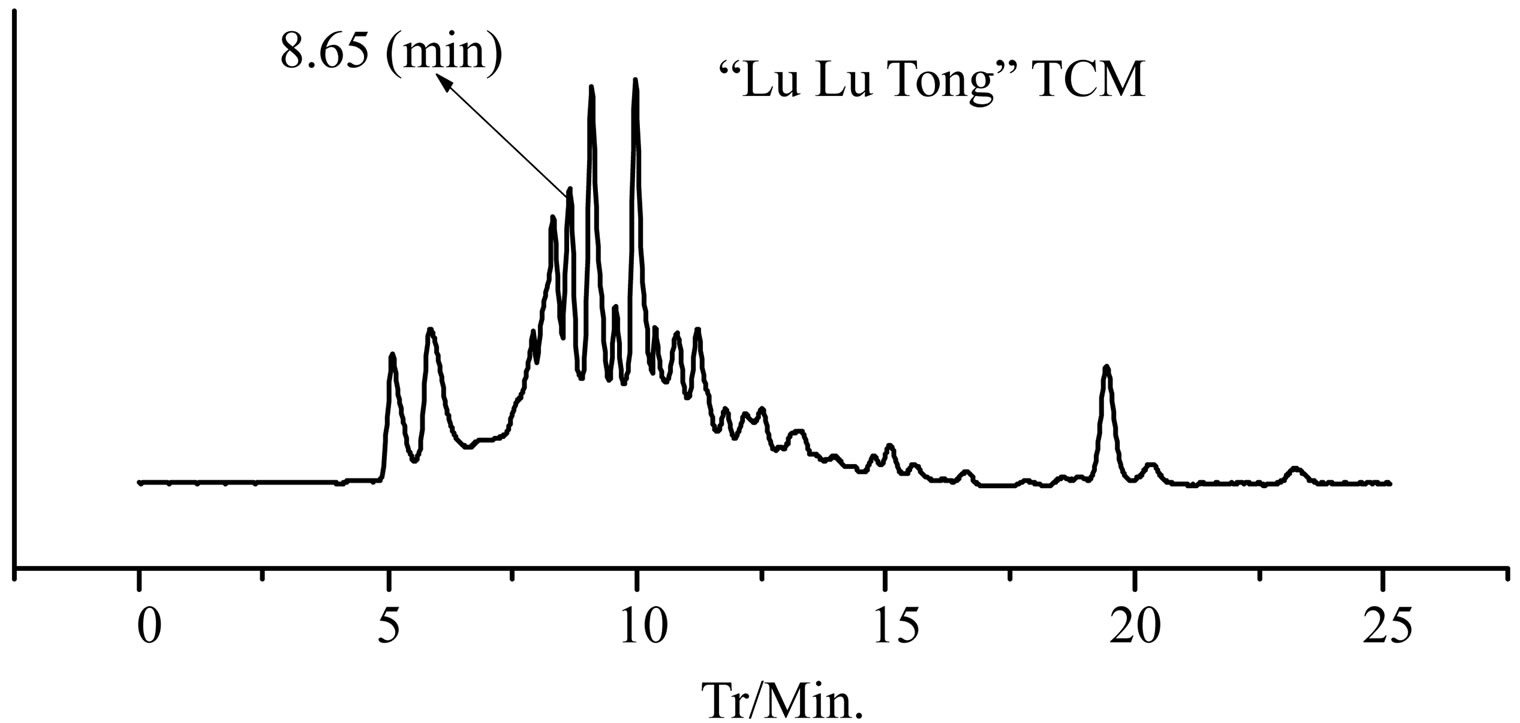
The separation chromatograms of GC-EI-MS and HPLC for “Zao Ren” TCM are shown in Figures 1 and 2, respectively. These results indicate that the “Zao Ren” sample is separated finely. The “Lu Lu Tong” TCM is separated finely as well, as shown in Figures 3 and 4. The fine separation of samples is mainly due to the selection of high-resolution column and optimal analytical conditions. The high-resolution column is characterized by high number of theoretical plates. Taking pure reagent clonazepam for statistics example, the theoretical plate numbers of columns of GC and HPLC achieve 660,000 and 15,500, respectively.
The retention time (RT) method is one of the qualitative methods widely used in chromatographic analysis. When the sample was finely separated, the chromatographic retention time of a defined component must be the same to the corresponding reagent. In Figure 1 of
 (a)
(a)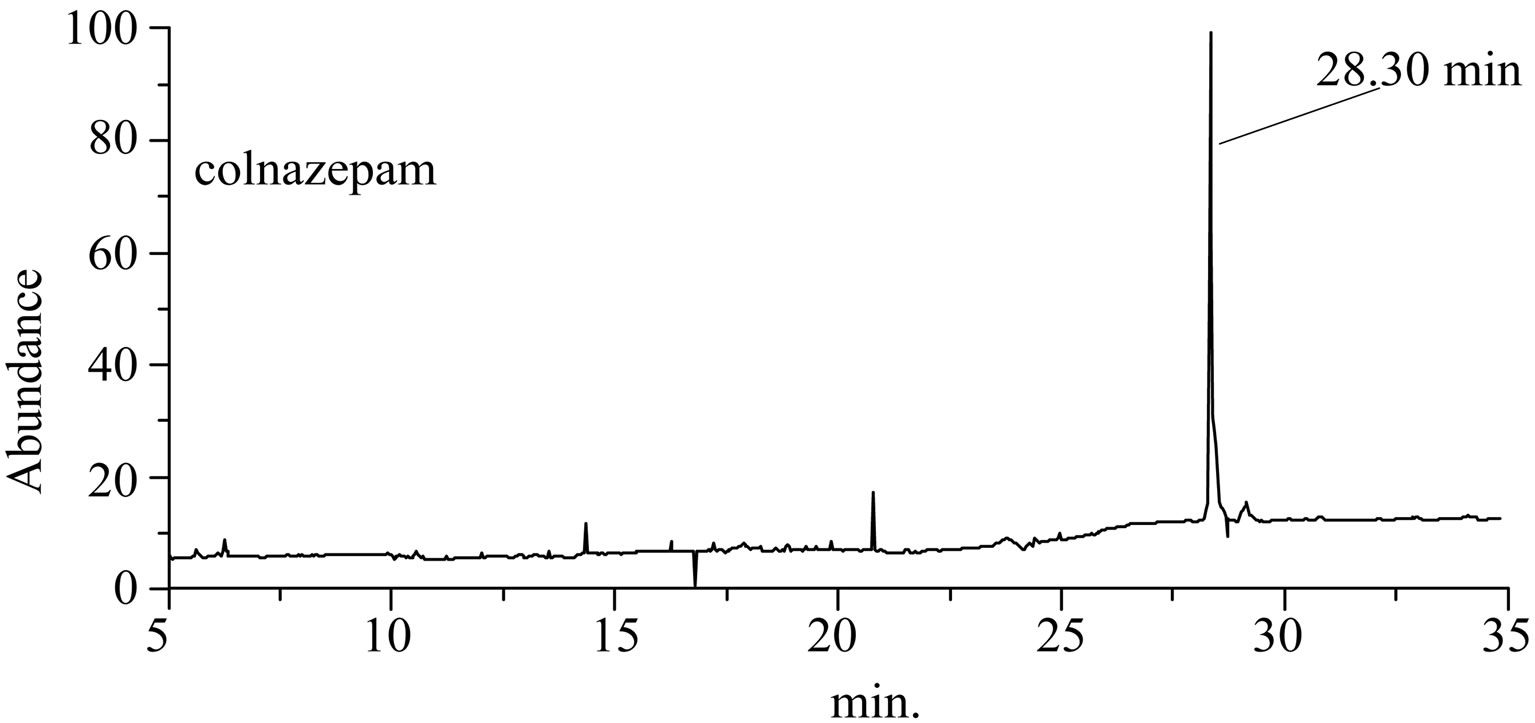 (b)
(b)
Figure 1. The total ion flow chromatogram of “Zao Ren” TCM and clonazepam.
 (a)
(a)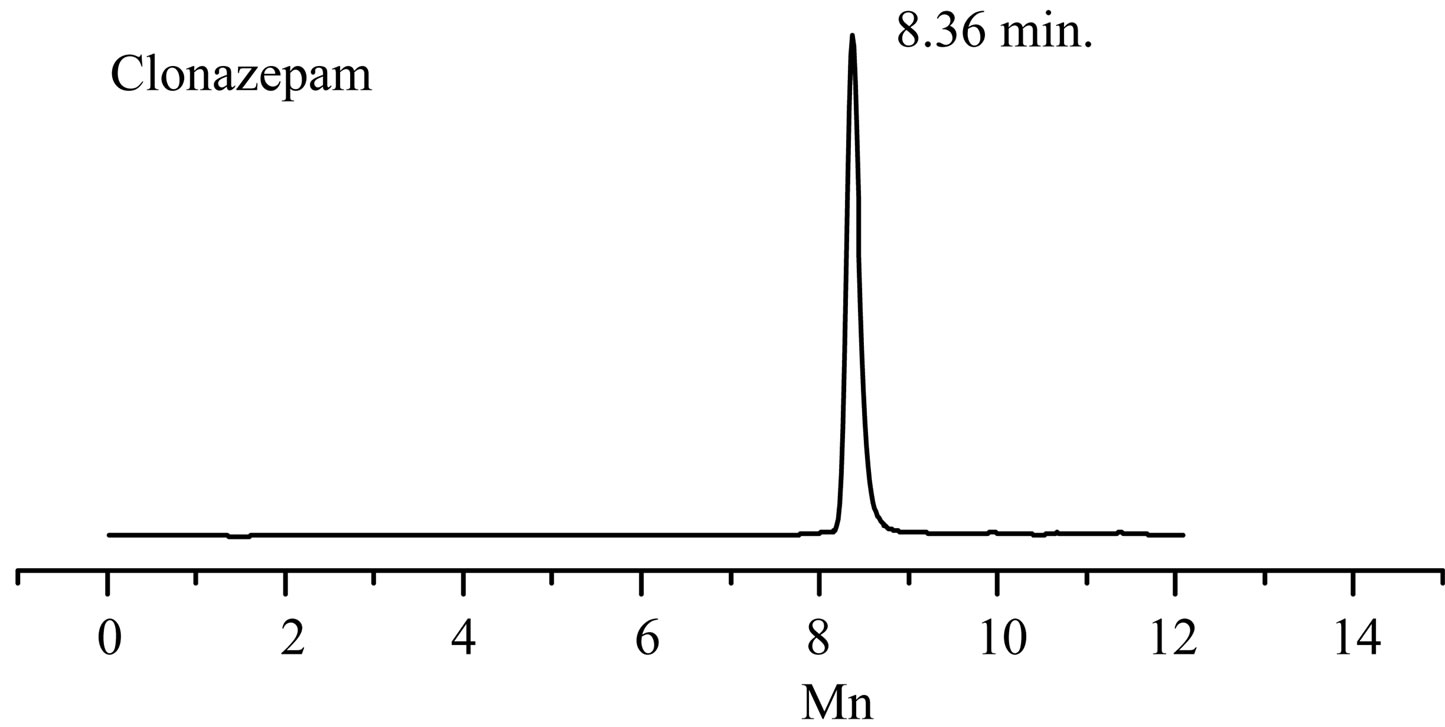 (b)
(b)
Figure 2. The HPLC chromatogram of “Zao Ren” TCM and clonazepam.
 (a)
(a)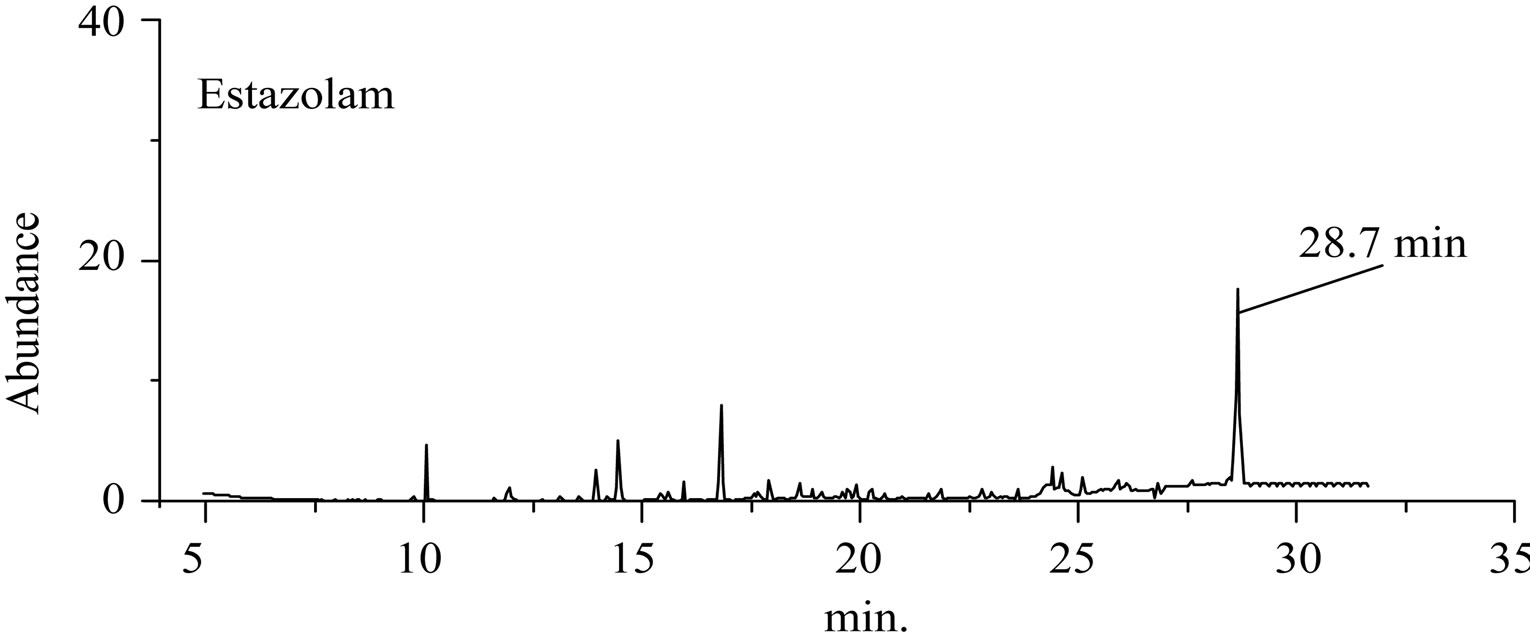 (b)
(b)
Figure 3. The total ion flow chromatogram of “Lu Lu Tong” TCM and Estazolam.
GC-EI-MS analysis, the RT of a defined composition in “Zao Ren” is 28.3 min, which is the same to that of pure reagent clonazepam. In Figure 3 of GC-EI-MS analysis, the RT of a defined composition in “Lu Lu Tong” is 28.7 min, which is the same to that of estazolam. These indicate that “Zao Ren” and “Lu Lu Tong” may contain clonazepam and estazolam, respectively.
 (a)
(a)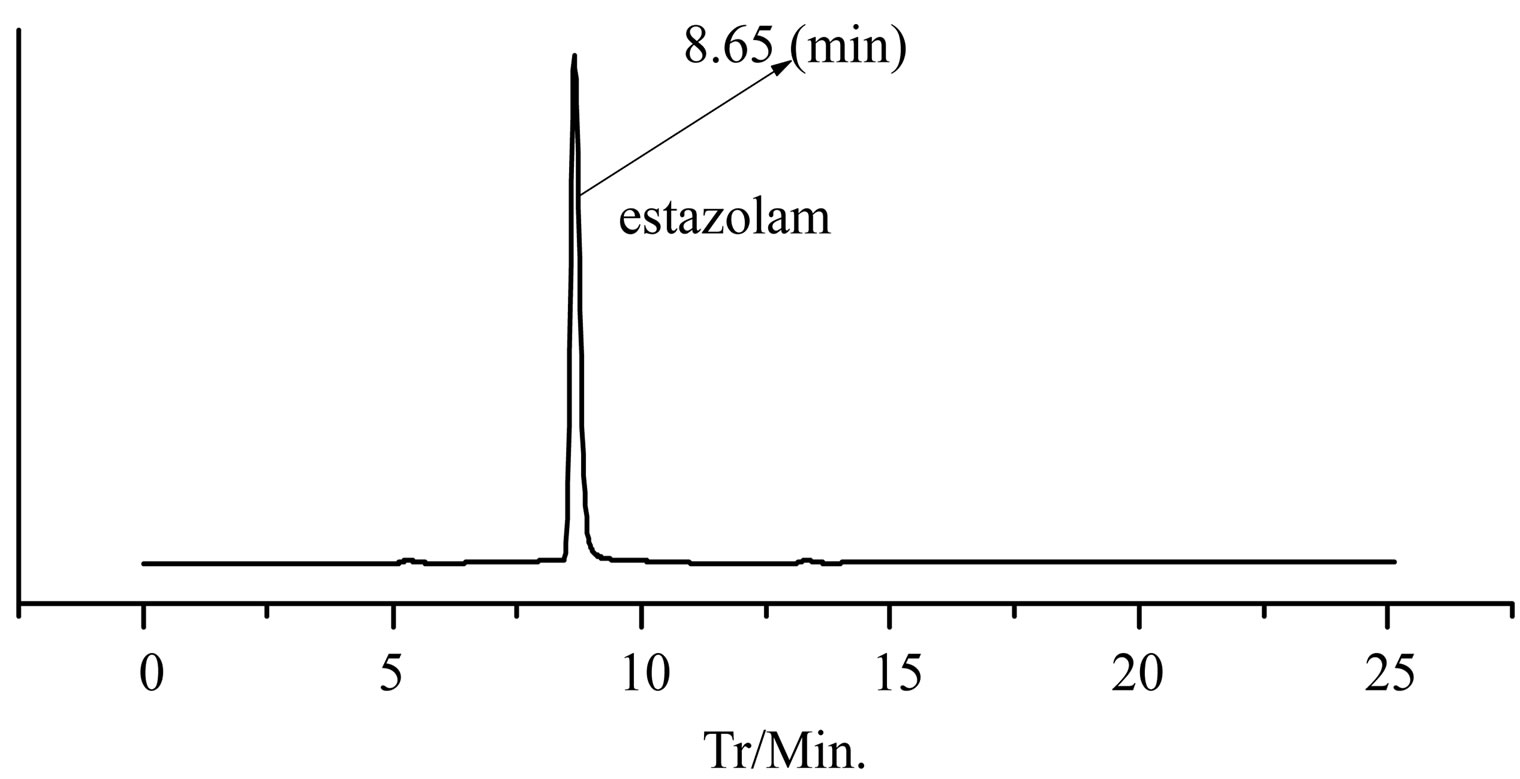 (b)
(b)
Figure 4. The HPLC chromatogram of “Lu Lu Tong” TCM and estazolam.
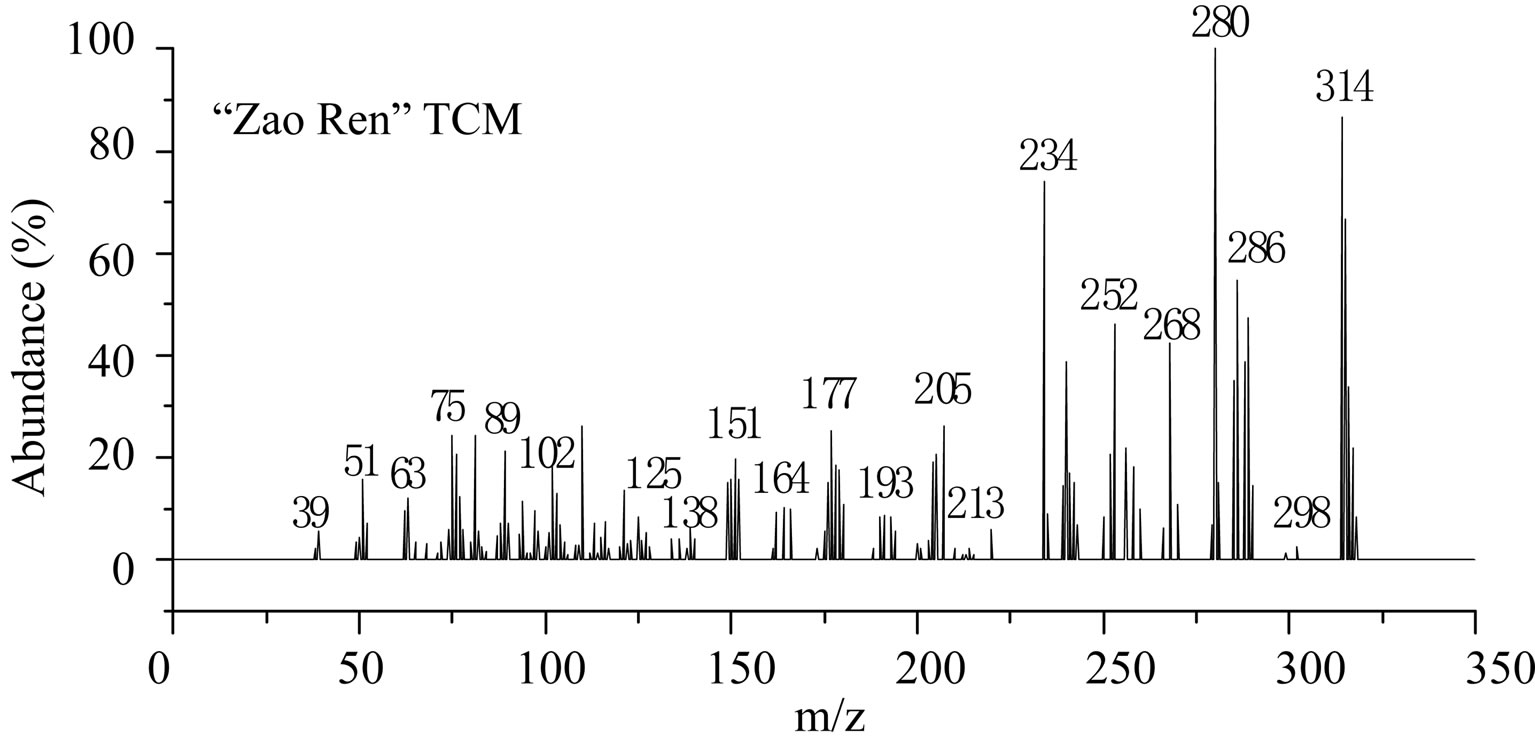
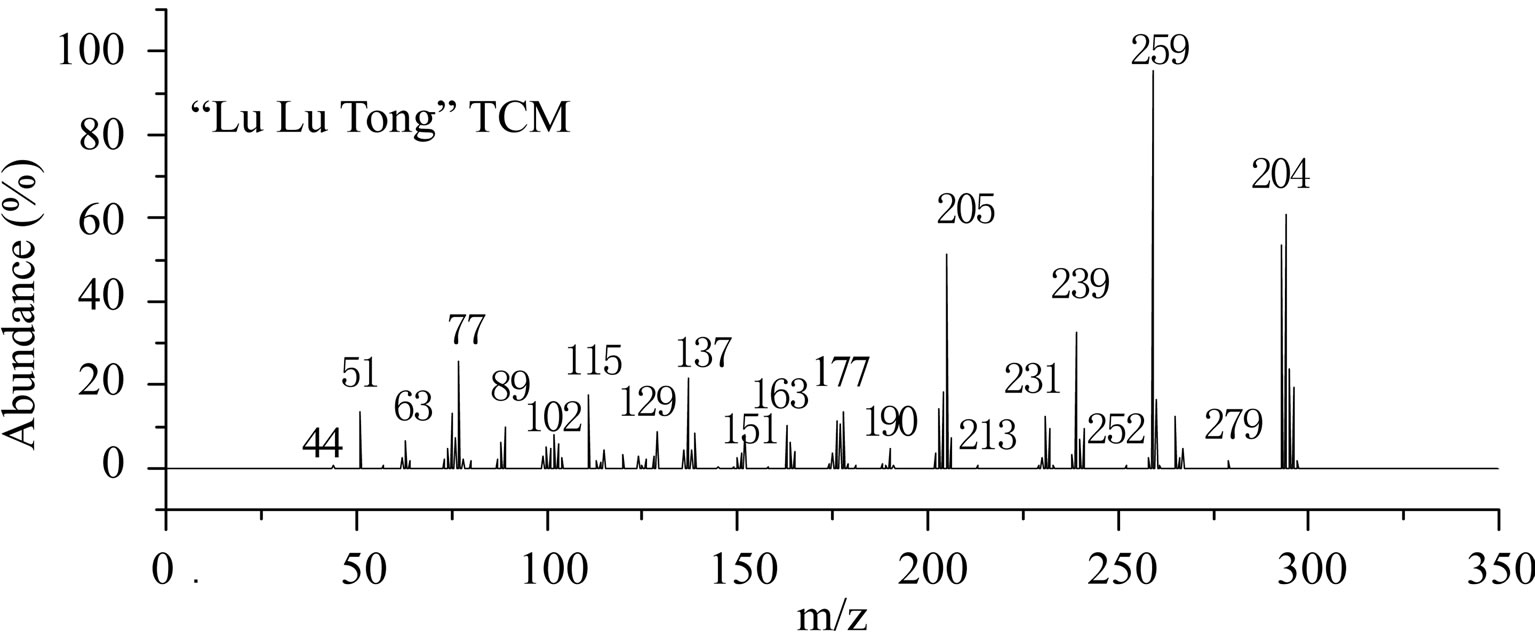
This is further confirmed by the EI-MS qualitative analysis in Figures 5 and 6. The EI-Mass spectra charge ratio (m/z) of the separated components of “Zao Ren”, “Lu Lu Tong” TCM and the pure standards compounds are summarized in Tables 1 and 2, respectively. The EI-MS qualitative method depends on the comparison of the mass spectrum obtained with that of a reported standard from the NIST Mass Spectrometry library. As shown in Figure 5, the m/z values of the spectrum obtained for “Zao Ren” TCM are indicated at m/z 39, 51, 63, 75, 89, 102, 125, 133, 151, 164, 177, 193, 205, 213, 234, 252, 268, 280, 286, and 314, with a confidence degree of 95% which matches the standard clonazepam. The m/z values of the spectrum obtained for “Lu Lu Tong” TCM are shown at m/z 44, 51, 63, 77, 89, 102, 129, 137, 190, 205, 213, 231, 239, 269, 270 and 294, which with a confidence degree of 93.5% which matches the standard matches the pure estazolam (Figure 6). Therefore, “Zao Ren” TCM contains clonazepam, and “Lu Lu Tong” contains estazolam. The structures of clonazepam and estazolam are shown in Figures 7 and 8, respectively.
The quantitative analysis results of “Zao Ren” and “Lu Lu Tong” TCM by external standard method are listed in Table 3. It is found that “Zao Ren” contains clonazepam of 120 ppm and “Lu Lu Tong” contains estazolam of 270 ppm. The S.D.% ranges from –4.132% to 5.785%. As the original content are low, this deviation is acceptable.
 (a)
(a) 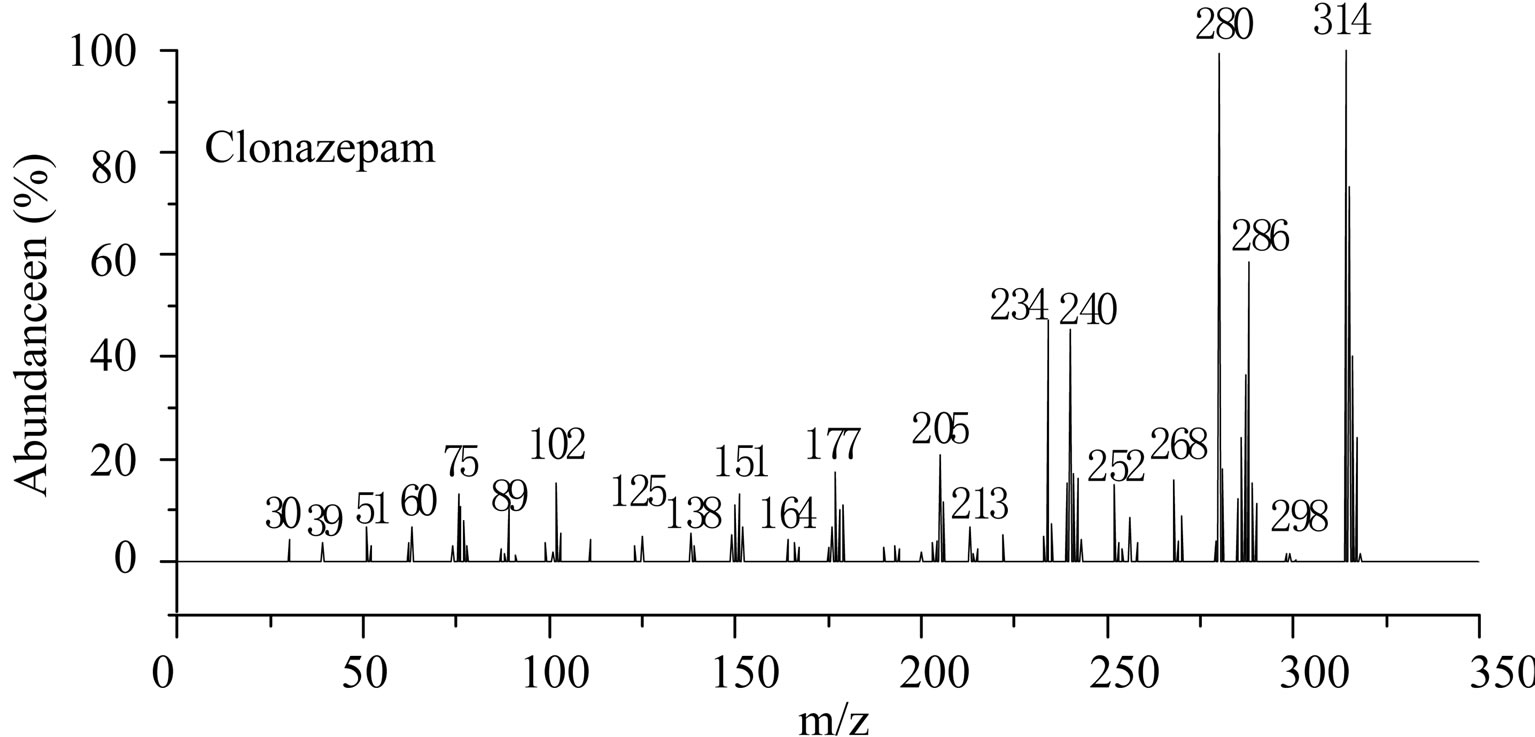 (b)
(b)
Note: The corresponding retention time of component is 28.30 min (Figure 1).
Figure 5. The mass spectrum of component of “Zao Ren” and clonazepam.
 (a)
(a) 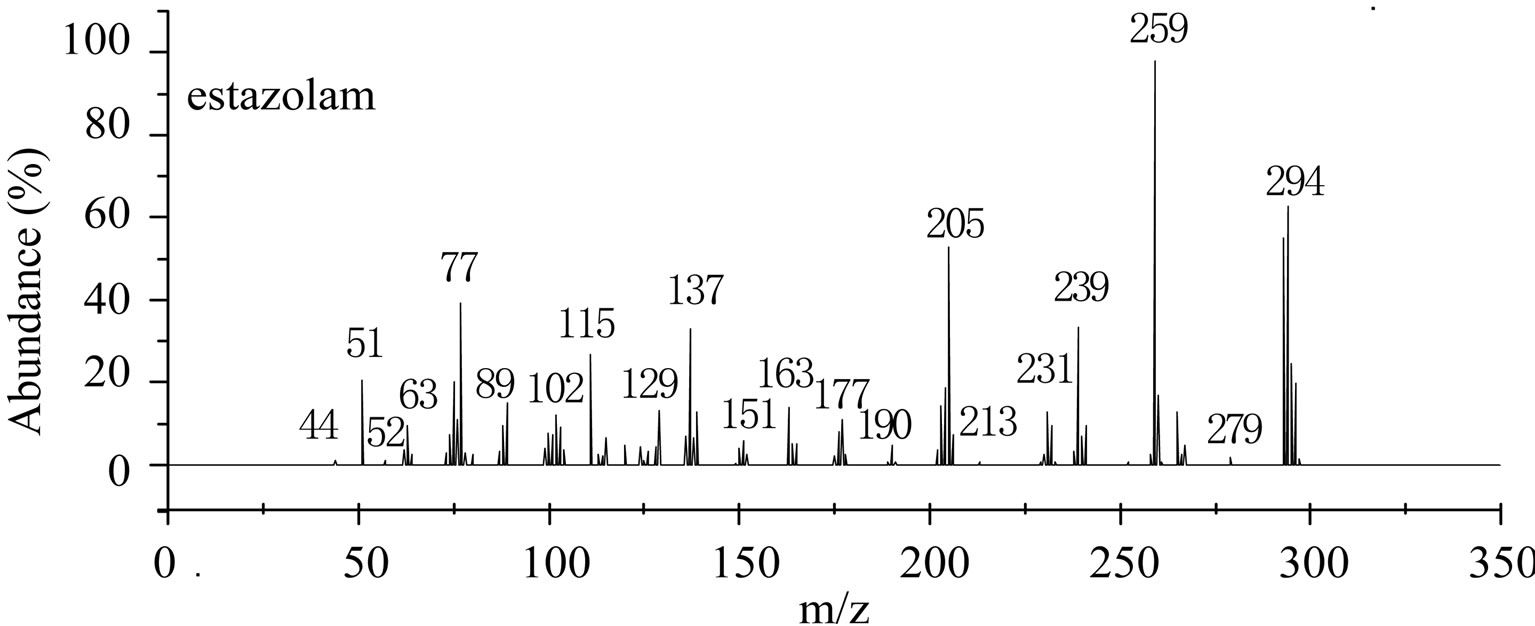 (b)
(b)
Note: The corresponding RT of component is 28.70 min (Figure 3).
Figure 6. The mass spectrum of “Lu Lu Tong” and estazolam.
4. Conclusions
The traditional Chinese medicine “Zao Ren” and “Lu Lu Tong” were separated finely due to the selection of high-resolution GC-EI-MS, HPLC and proper conditions for sample preparation. The active components in these
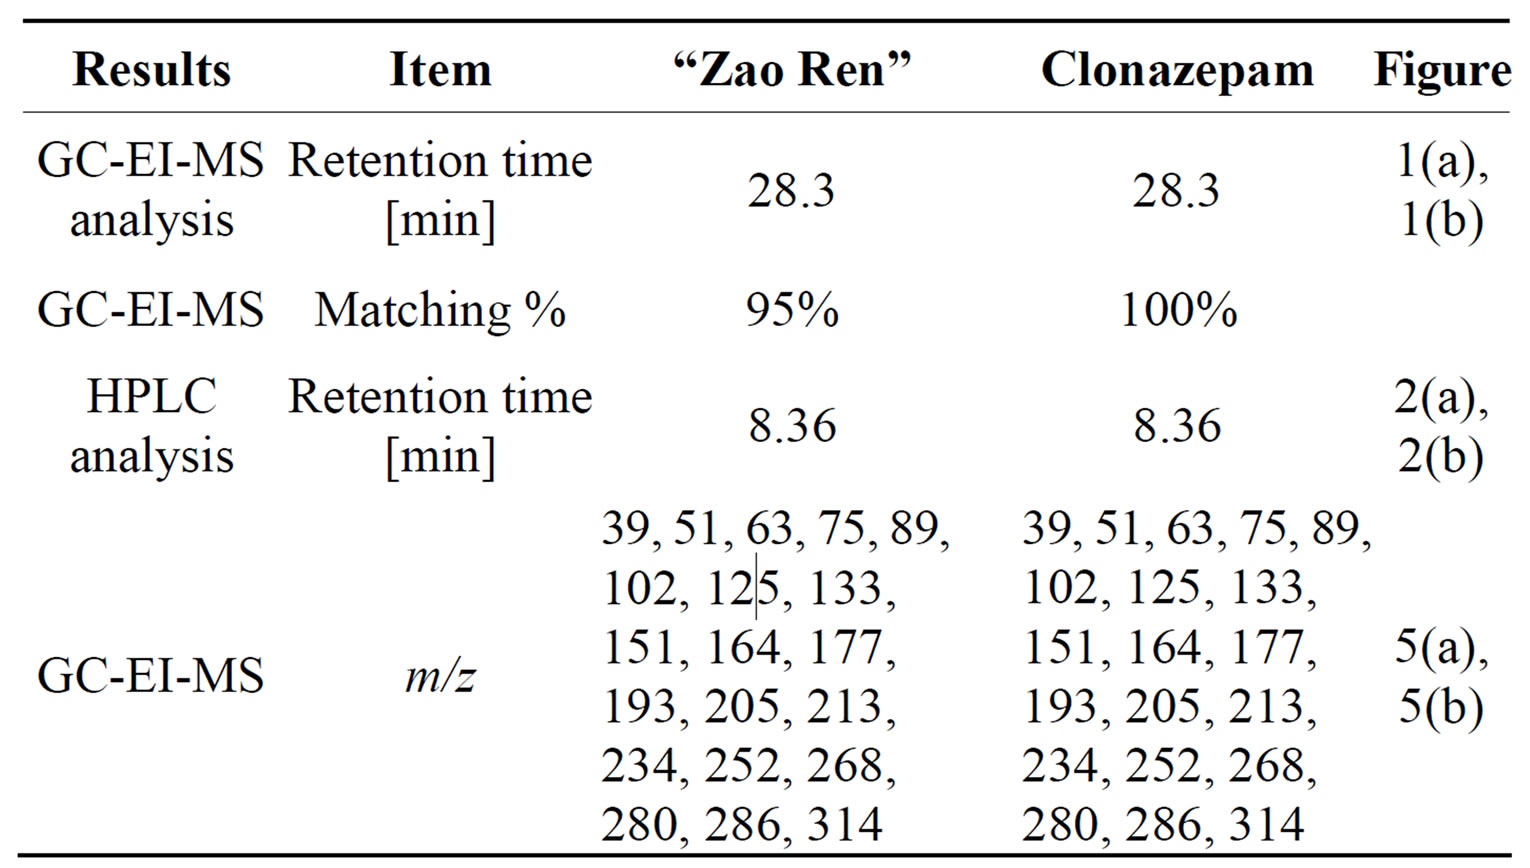
Table 1. Quality of “Zao Ren” Chinese medicines.
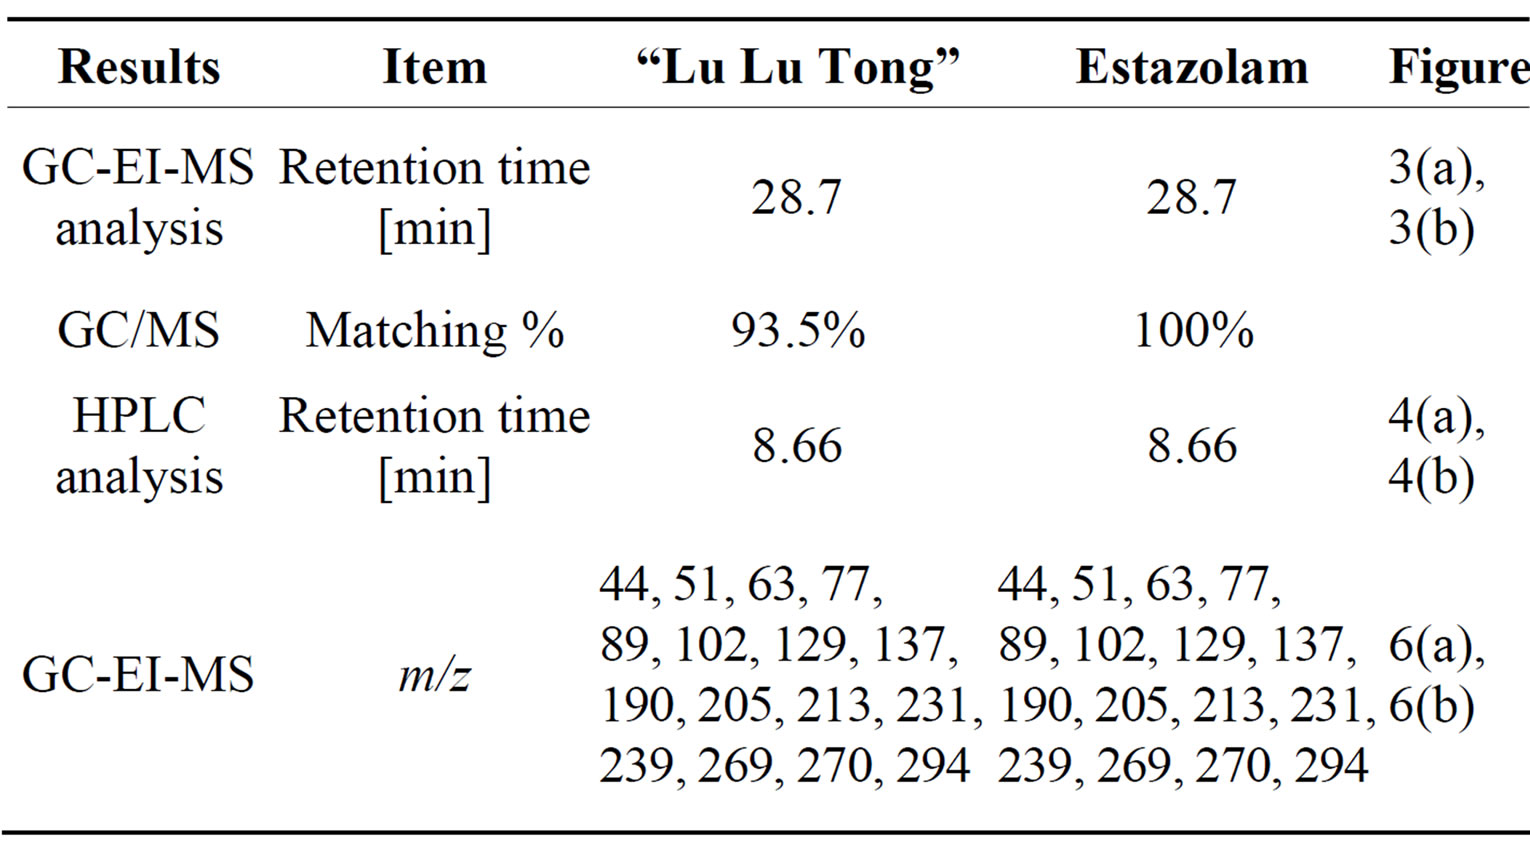
Table 2. Quality of “Lu Lu Tong” Chinese medicines.
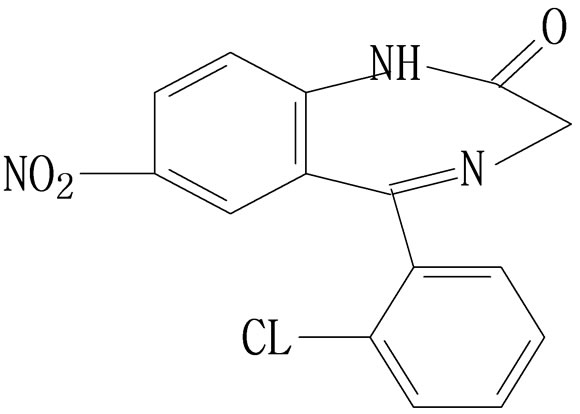
Figure 7. Molecular structure diagram of clonazepam.
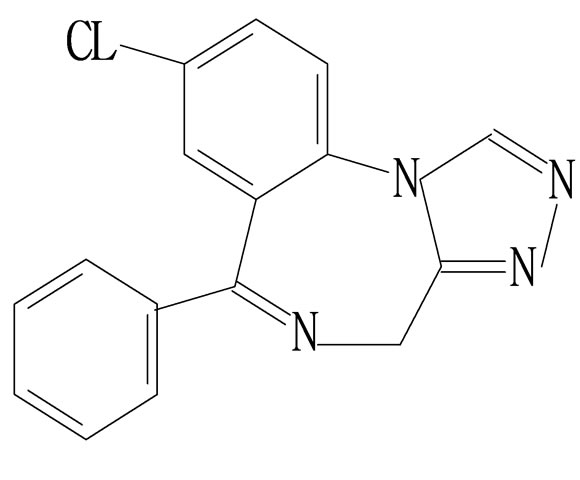
Figure 8. Molecular structure diagram of estazolam.

Table 3. Results of quantitative determination.
two TCM were accurately identified through three qualitative methods: retention time of GC-EI-MS; MS spectrometry of GC-EI-MS and retention time of HPLC. It is found that “Zao Ren” contains clonazepam of 120 ppm and “Lu Lu Tong” Chinese drug contains estazolam of 270 ppm.
Because of the lower toxicity of herbal medicine than that of western medicine, the herbal medicine should be recommend to use. The development of natural herbs is inadequate nowadays. The present work will be useful to research the compositions of herbs.
5. Acknowledgements
The authors gratefully acknowledge the financial support from the National Natural Science Foundation of China (Nos. 20677065), and Foundation of Natural Science Shanxi Province (Nos. 2008011014-3).
REFERENCES
- Y. X. Xu, “Neuroses,” Peking University Medical Press, Beijing, 2008, pp. 2-3.
- X. J. Li, Y. P. Zhang and Z. B. Yuan, “Separation and Determination of Rutin and Vitamin C in Compound Rutin Tablets by Capillary Electrophoresis with Amperometric Detection,” Chinese Journal of Analytical Chemistry, Vol. 30, No. 7, 2002, pp. 815-818.
- K. D. Yang, J. Chen, Z. Ouyang, W. D. Xu and Z. F. Tong, “Analysis of Polyprenols in Ginkgo Biloba Leaves with High Performance Liquid Chromatography PAtmospheric Pressure Chemical Ionization Mass Spectrometry,” Chinese Journal of Analytical Chemistry, Vol. 31, No. 8, 2003, pp. 937-940.
- Q. Li, G. L. Hu, X. G. Xu, Z. X. Zhuang and X. R. Wang, “Determination of Andrographolide and Dehydroandrographolide in Andrographis Paniculata Ness by Micellar Electrokinetic Capillary Chromatography,” Chinese Journal of Analytical Chemistry, Vol. 31, No. 4, 2003, pp. 451-454.
- Z. Zeng, J. G. Shi, H. P. Zeng and W. L. Lai, “Application of Organic Mass Spectrometry in Studies on Houttuynia Cordata,” Chinese Journal of Analytical Chemistry, Vol. 31, No. 4, 2003, pp. 399-404.
- X. Y. Shang and Z. B. Yuan, “Determination of Effective Constituents in Rhubarb by β2Cyclodextrin Modified Micellar Electrokinetic Chromatography,” Chinese Journal of Analytical Chemistry, Vol. 30, No. 7, 2002, pp. 853-856.
- L. Wang, H. B. Xiao, J. H. Hu, J. Wang and X. M. Liang, “Study of p2Hydroxyphenylic Compounds in Gastrodia Elata Blume by High Performance Liquid Chromatography Electrospray Mass Spectrometry,” Chinese Journal of Analytical Chemistry, Vol. 31, No. 8, 2003, pp. 954- 957.
- Q. A. Wang, H. Z. Guo, C. H. Huo, Q. W. Shi, M. Ye, K. S. Bi and D. A. Guo, “Chemical Constituents in Root of Paeonia Lactiflora,” Chinese Traditional and Herbal Drugs, Vol. 38, No. 7, 2007, pp. 972-976.
- N. X. Zhao, Y. M. Han and X. L. Fu, “Chemical Constituents in Stem of Lonicera Japonica,” Chinese Traditional and Herbal Drugs, Vol. 38, No. 12, 2007, pp. 1774-1776.
- Z. F. Fang, Z. L. Li, Y. Wang, W. Li and H. M. Hua, “Chemical Constituents from Wing Twigs of Euonymus Alatus,” Chinese Traditional and Herbal Drugs, Vol. 38, No. 6, 2007, pp. 810-812.
- D. Lu, C. Y. Wang, J. P. Liu, S. A. Chen and P. Y. Li “Chemical Constituents from Aerial Parts of Dioscorea Nipponica,” Chinese Traditional and Herbal Drugs, Vol. 38, No. 12, 2007, pp. 1785-1787.
- S. Que, Y. S. Zhang and Y. Y. Zhao, “Chemical Constituents of Tibetan Medicine Oxytropis Falcate,” Chinese Traditional and Herbal Drugs, Vol. 38, No. 10, 2007, pp. 1458-1460.
NOTES
*Corresponding author.