S. A. DAVID ET AL.
presentation of explanations in verbal and visual format (multi-
ple representation group) generated a median of over 75% more
creative solutions on problem-solving transfer tests than did
students who received verbal explanations alone (single repre-
sentation group).
We believe that the using of a color code raises the con-
sciousness of connections, makes the visualization of com-
plexes designs easier and can contribute for, the almost always
required, process of abstraction of concepts and ideas through
symbols.
When the act of coloring is requested to the apprentice, as a
complementary or additional job in the process of learning
about a determined concept, such act implies in a really active
way of consolidating these concepts. With hands in activity,
there is a large chance of focusing attention in a much more
intense way while concentrating on simple topics, on at a time.
At the same time, the mind associates shapes with concepts,
transferring them from the short time memory to a more lasting
time memory.
It is well known that we are visual apprentices, in other
words, a lot of what we learn originates from our sense of vi-
sion. Even tasks like, for instance, those executed by a sports-
man, must be “visualized” before being fulfilled.
That is the reason why it is so important to “visualize con-
cepts” to understand and consolidate contents of a pre-estab-
lished discipline, for example.
It is possible to find in the Brazilian publishing market three
excellent books of the series “the coloring book”: Anatomy
(Elson & Kapit, 2001), Physiology (Kapit, Macey, & Meisami,
1999) and Microbiology (Alcamo & Elson, 2004). On this
works, authors manage to teach successfully to the lay public
the essence of math concepts with a series of sheets and posters.
Traditionally, courses as Anatomy or Microbiology can be
thought as more “visual” than courses like Physics and, above
all, Mathematics. Notwithstanding, an example that other courses
or disciplines are capable of “visualization” is the case of the
volume “The Physiology Coloring Book” already mentioned
above. Physiology may be understood, in certain way, as the
application of Physics, Chemistry and Math to Medicine. In this
case, is not about just describing static figures as in Anatomy. It
is substantial to explain process as forces, chemical reactions,
fluxes, states, signals and feedbacks.
In this work, we challenge the paradigm and show that a
“Calculus for Coloring” isn’t only possible as it can also be a
quality complement on the teaching-learning process.
If we compare old math textbooks to recent ones, it will be
immediate to note that, a major increase in the number and
quality of pictures to motivate the readers. In this project, we
believe that the pictures should be almost 50% of the content of
the textbook.
Having this in mind, the objective of this work is developing
teaching and researching skills and then testing the graphical
for coloring material created and the explanatory text about the
topics of the discipline “Calculus with Applications IV” of the
Biosystems Engineering course, at the Pirassununga campus,
from University of São Paulo (USP-Brazil).
Furthermore, this work has as its main goal to contribute to
the developing of knowledge in the teaching-learning field in
Calculus. On the edge, this work may be faced as an attempt of
planting an embryo that would contribute to the Brazil’s im-
perative challenge to improve the quality of teaching, especially
in mathematics education.
Methods
Selected Topics and Layouts
In the Biossystems Engineering course of the University of
São Paulo, the discipline “Calculus with Applications IV” has
on its syllabus, the study of ordinary differential equations (Boyce
& Di Prima, 2008)—solved by series of potentials method—as
well as the study of partial differential equation (Kreyszig, 2006)
and the Laplace transform. In the preparation of this project,
from the contents of the referred discipline, the main topics
were selected and subdivided in eleven parts, which were named
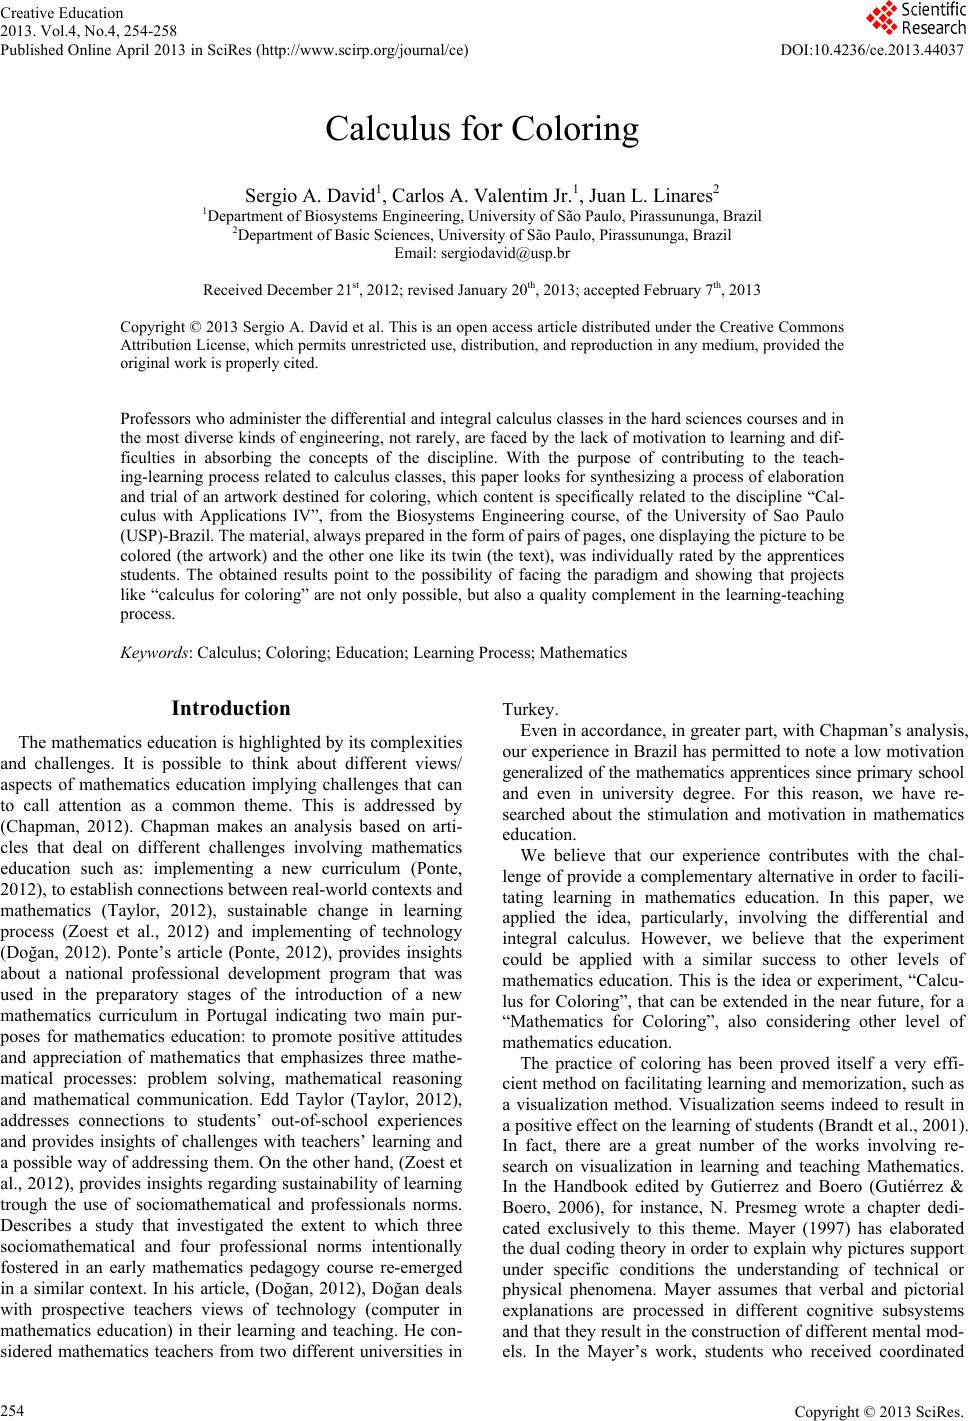
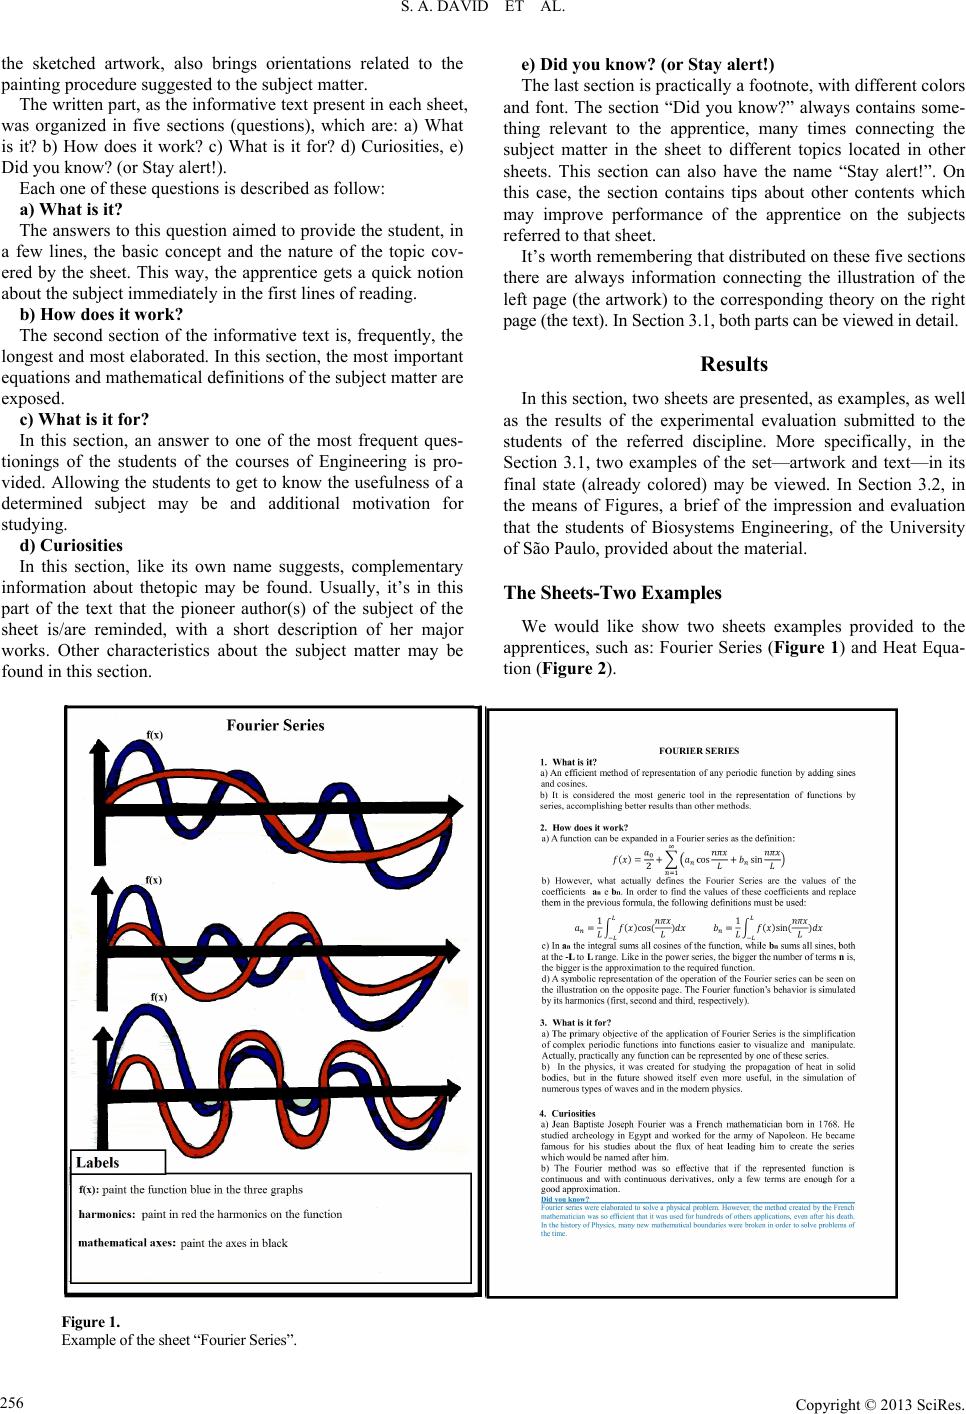
“sheets”. A sheet was composed of two pages.
The left page displays the illustration to be colored about the
topic of the referred sheet (the artwork page). The right page
(the text page), on the other hand, has a “summary text” con-
taining the main information about the topic covered. Each
sheet refers to one of the selected topics of the discipline,
namely:
1) Laplace Transform;
2) Special functions;
3) Power series;
4) Fourier series;
5) Euler Equations;
6) Legendre Equations;
7) Bessel Equation;
8) Partial Differential Equations;
9) Heat Equation;
10) Wave Equation;
11) Laplace Equation.
The transfiguration of mathematical concepts relatively ab-
stract in illustrations which can be colored and quickly under-
stood didn’t come as a trivial task. Aiming the maximization of
the receptivity by its potential users (the apprentices), the mate-
rial was built in order to attract the more attention and interest
as possible.
In a way of attending those demands, a bibliographical re-
search (with emphasis on the classical books of calculus) was
made.
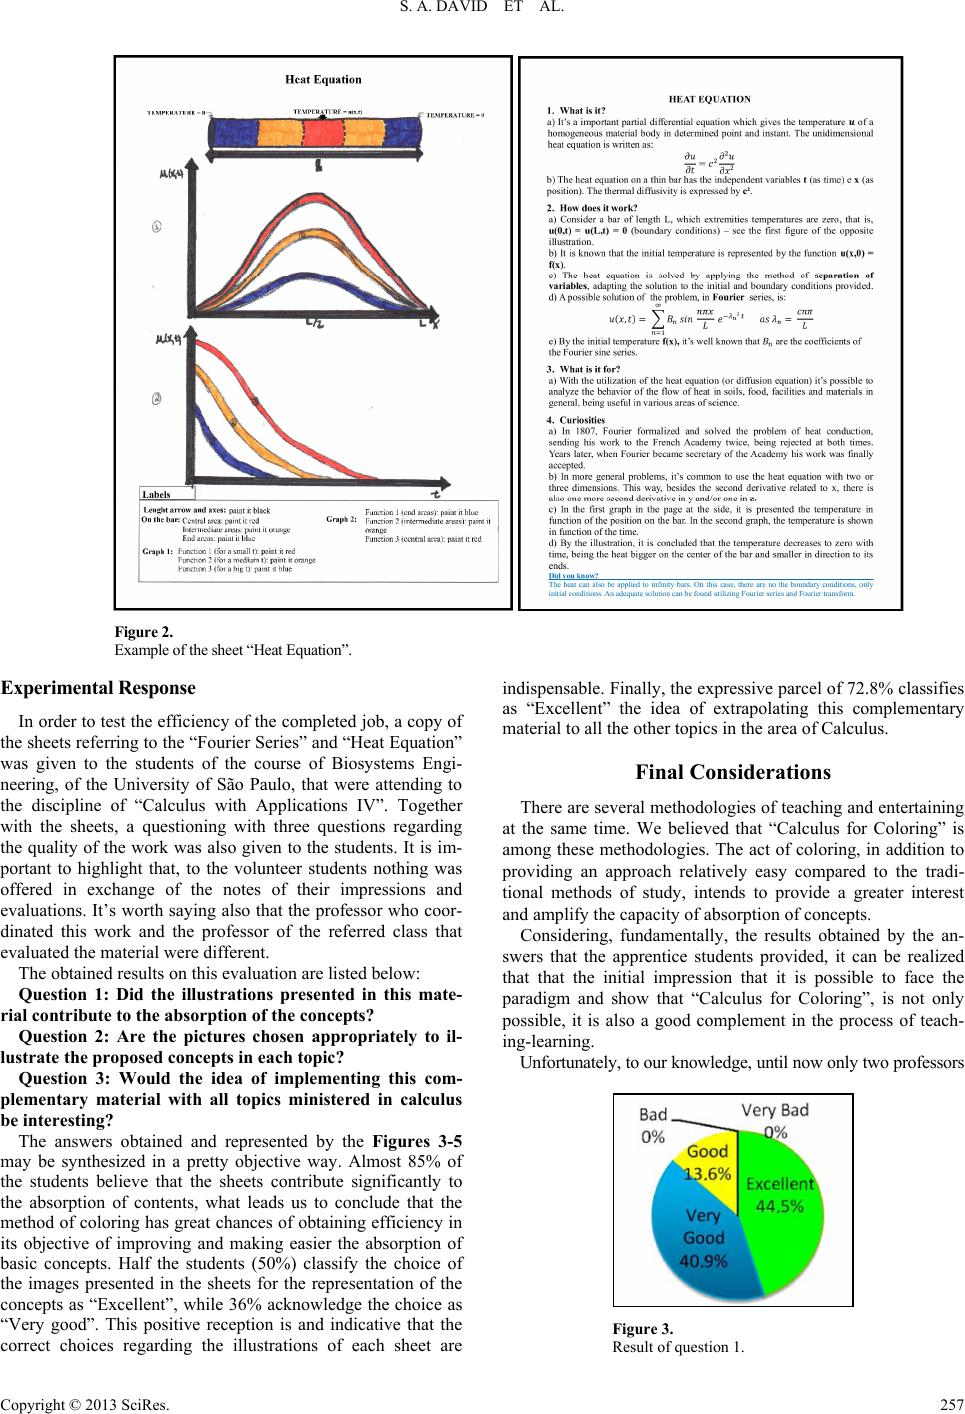
Some sheets created on this project were submitted to stu-
dents that attended the referred discipline on the last semester,
for the purpose of evaluating the efficiency of the work. Armed
with crayons, the students painted each illustration and read all
the informative texts, establishing relations between the con-
tents and, at the very end, filled a form writing their individual
opinions about the project. The results of this form may be
observed on details in Section 3.2.
The Artwork
In the confection of each sheet, the start point was always the
artwork (illustration). From the main concept about the subject
matter, a sketch was drawn with the intention of expressing the
central idea of the topic or some important particularities. At
the same time that the art confection was made, annotations
were also written with the objective of connecting it to the art-
work next.
The Text-Page
After the sketch of the artwork, its twin part was elaborated.
That means the written part that, besides bringing the most
important information as objectively as possible relatively to
Copyright © 2013 SciRes. 255