Paper Menu >>
Journal Menu >>
 iBusiness, 2013, 5, 31-34 doi:10.4236/ib.2013.51b007 Published Online March 2013 (http://www.scir p.org/journal/ib) Copyright © 2013 SciRes. IB 31 Cluster Analysis on PEAD Using SUE Model with Quarterly Data Huaiyu Sun1,2, Mi Zhu2, Feng He2 1Economics and Management School, Wuhan University, Wuhan, China; 2Research Department, China Investment Securities Co., Ltd, Shenzhen, China. Email: sunhuaiyu@china-invs.cn Received 2013 ABSTRACT The paper constructs SUE model with Quarterly Report Data of the A-share listed companies for the first ti me, to ana- lyze Post-Earnings-Announcement Drift (PEAD) with a higher data frequency. A further cluster analysis is made to examine PEAD phenomenon under different market caps and report periods. The study finds that large cap stocks show stronger PEAD than the small cap. It also firstly finds that PEAD on Q1 is more obvious than others. These findings have practical significance for the investment management decisions and the quantitative trading financial products developments. Keywords: Post-Earnings-Announcement Drift ; PEAD; SUE Mo d el; Cl uste r Ana l ysi s 1. Introduction Ball and Brown (1968) firstly found “Post-Earnings- Announcement-Drift” (shorts for PEAD); that is, stock prices show continuous and enduring reaction to the lat- est information, which means stable excess return can be obt ained thro ugh q uant ita ti ve i nvest me nt mod el b ased on excavating on report data. Bernard and Thomas (1989) demonstrated that the PEAD is attributed to the CAPM model’s mispricing to the market. Bhushan (1994) con- sidered PEAD, directly or indirectly, driven by the transaction cost. Although Fama (1998) insisted on the efficient market hypothesis, he admitted that obtaining excess r eturn through PEAD i s “over sus picion”. After Fama’s approach, most of the scholars are in- clined to recognize the existence of PEAD, developing depth discussions of the explanation of PEAD. Standar- dized unexpected earnings (SUE) model was firstly pre- sented by Rendleman, Hones and Latane (1982), and they find that 2% abnormal return could be achieved through buying top 10% SUE portfolio during 1971-1980. Foster, Olsen, Shelvin (1984) did the same test and found that small cap stocks are more sensitive to the unex- pec ted ear ni ng announc ements. In recent years, Chinese scholars did various re- searches on PEAD phenomenon from different angles. Wu and Wu (2005) constructed SUE model with EPS data from semi-annual reports and annual reports of A-share listed companies in china. Kong and Ke (2007) analyzed characteristics between institutions and person- al investors. Lu (2012) commented PEAD on systematic mispricing. After that, most of the scholars are inclined to recog- nize the existence of PEAD, developing depth discus- sions of the explanation of PEAD. Standardized unex- pected earnings (SUE) model was firstly presented by Rendleman, Hones and Latane (1982), and the model was used to measure PEAD by Bernard and Thomas (1989), who pointed out that the drifting magnitude is more obvious in small-cap firms than the large ones. Wu and Wu (2005) constructed SUE model with EPS data from semi-annual reports and annual reports of A-share listed co mpanies in c hina. K ong and K e (200 7) anal yzed characteristics between institutions and personal inves- tors. Lu (2012) commented PEAD on systematic mi- spricing. This paper constructs SUE model with quarterly report data of A-share market for the first time, and use cluster analysis to estimate PEAD of different market caps and periods. The study makes up for the low sampling fre- quency deficiency of the previous research, and also finds out two new features of PEAD in A-share market. These findings not only help to deepen the under sta ndin g of the nature of A-share market, but also provide the ba- sis and reference for the development of quantitative financial in novative produc ts. The structure of this paper is organized as follows: af- ter the introduction, the second part is the model design; third, fourth, fifth parts are the experiments and the re- sults. The third part is the whole experiment for A-share 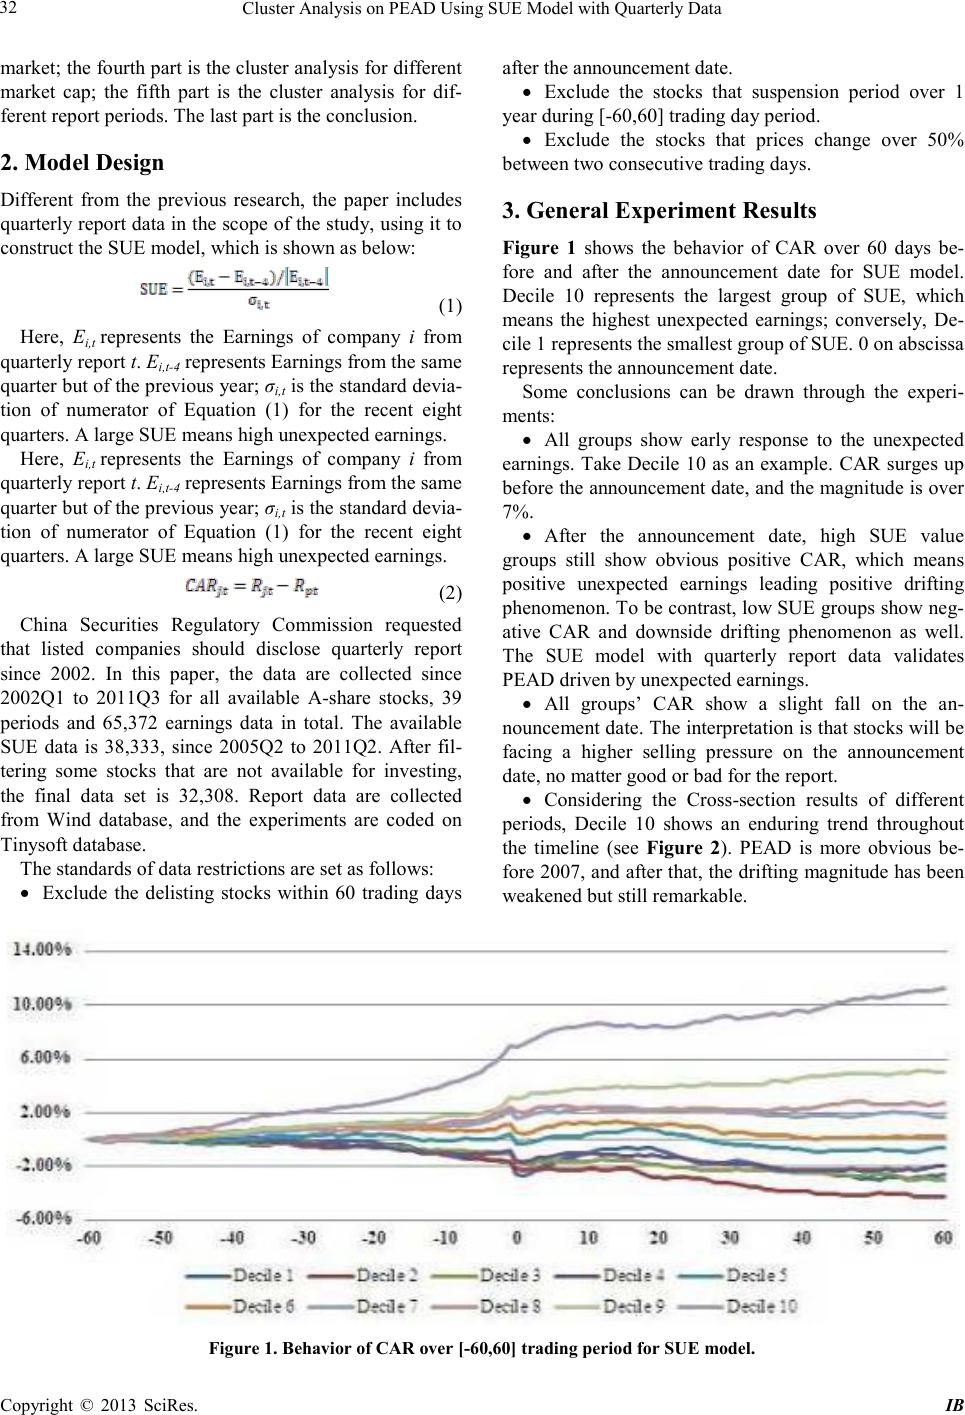 Cluster Analysis on PEAD Using SUE Model with Quarterly Data Copyright © 2013 SciRes. IB 32 market; the fourth pa rt is the cluster anal ysis for different market cap; the fifth part is the cluster analysis for dif- ferent report periods. The last part is the conclusion. 2. Model Design Different from the previous research, the paper includes quarterl y repor t data in the sco pe of the study, usin g it to const ruct the SUE model, whic h is shown as below: (1) Here, Ei,t represents the Earnings of company i from quarterly report t. Ei,t-4 represents Earnings from the same quar ter but o f the pr evio us ye ar; σi,t is the standard devia- tion of numerator of Equation (1) for the recent eight quarters. A large SUE means high unexpected earnings. Here, Ei,t represents the Earnings of company i from quarterly report t. Ei,t-4 represents Earnings from the same quarter but o f the pr evio us yea r; σi,t is the standard devia- tion of numerator of Equation (1) for the recent eight quarters. A large SUE means high unexpected earnings. (2) China Securities Regulatory Commission requested that listed companies should disclose quarterly report since 2002. In this paper, the data are collected since 2002Q1 to 2011Q3 for all available A-share stocks, 39 periods and 65,372 earnings data in total. The available SUE data is 38,333, since 2005Q2 to 2011Q2. After fil- tering some stocks that are not available for investing, the final data set is 32,308. Report data are collected from Wind database, and the experiments are coded on Tinysoft database. The standards of data restrictions are set as follows: • Exclude the delisting stocks within 60 trading days after the announcement date. • Exclude the stocks that suspension period over 1 year during [-60,60] trading day period. • Exclude the stocks that prices change over 50% between two conse cutive trading days. 3. General Experiment Results Figure 1 shows the behavior of CAR over 60 days be- fore and after the announcement date for SUE model. Decile 10 represents the largest group of SUE, which means the highest unexpected earnings; conversely, De- cile 1 represents the smallest group of SUE. 0 on abscissa represents the announcement date. Some conclusions can be drawn through the experi- ment s: • All groups show early response to the unexpected earnings. Take Decile 10 as an example. CAR surges up befo re the a nnounce ment d ate, a nd the magni tude is over 7%. • After the announcement date, high SUE value groups still show obvious positive CAR, which means positive unexpected earnings leading positive drifting pheno meno n. T o b e c ontr ast, l ow SUE gro ups sho w ne g- ative CAR and downside drifting phenomenon as well. The SUE model with quarterly report data validates PEAD dri ven by unexpected earnings. • All groups’ CAR show a slight fall on the an- nouncement date . The interp retation is that sto cks will be facing a higher selling pressure on the announcement date, no matter good or bad for the report. • Considering the Cross-section results of different periods, Decile 10 shows an enduring trend throughout the timeline (see Figure 2). PEAD is more obvious be- fore 2007, and after that, the drifting magnitude has been weakened but still r emarkable. Figure 1 . Behavior of CAR over [-60, 60] tr ading perio d for SUE model. 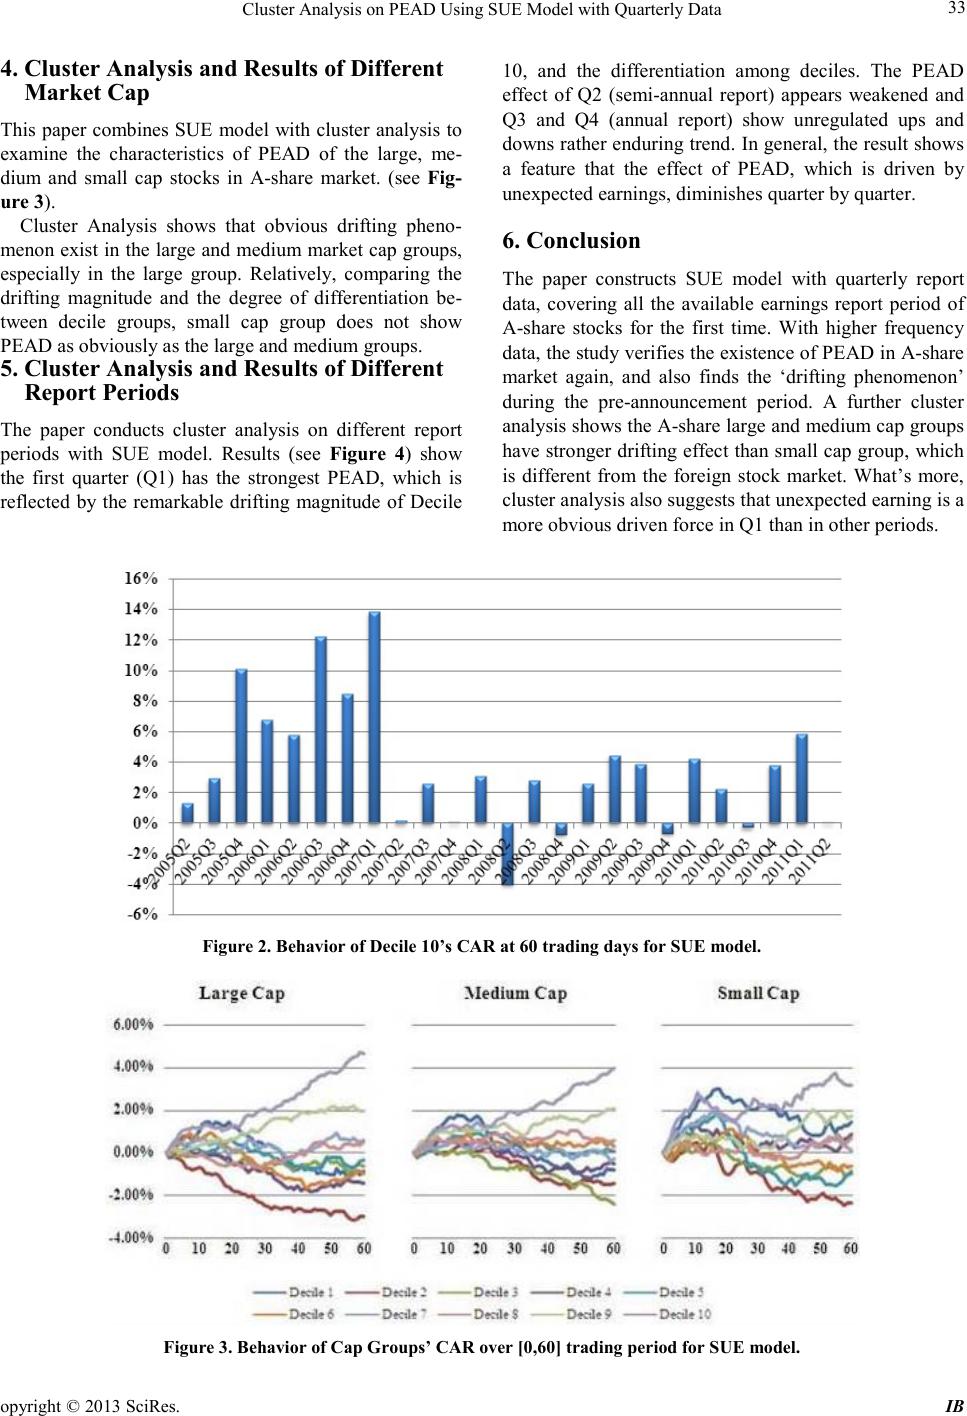 Cluster Analysis on PEAD Using SUE Model with Quarterly Data opyright © 2013 S ciRes. IB 33 4. Cluster Analysis and Results of Different Market Cap This paper combines SUE model with cluster analysis to examine the characteristics of PEAD of the large, me- dium and small cap stocks in A-share market. (see Fig- ure 3). Cluster Analysis shows that obvious drifting pheno- menon exist in the large and medium market cap groups, especially in the large group. Relatively, comparing the drifting magnitude and the degree of differentiation be- tween decile groups, small cap group does not show PEAD as obviously as the large and medium groups. 5. Cluster Analysis and Results of Different Report Peri od s The paper conducts cluster analysis on different report periods with SUE model. Results (see Figure 4) show the first quarter (Q1) has the strongest PEAD, which is reflected by the remarkable drifting magnitude of Decile 10, and the differentiation among deciles. The PEAD effect of Q2 (semi-annual report) appears weakened and Q3 and Q4 (annual report) show unregulated ups and do wns rather end urin g trend. In ge neral , the r esult sho ws a feature that the effect of PEAD, which is driven by unexpected earnings, diminishes quarter by quarter. 6. Conclusion The paper constructs SUE model with quarterly report data, covering all the available earnings report period of A-share stocks for the first time. With higher frequency data, the study verifies the existence of PEAD in A-share market again, and also finds the ‘drifting phenomenon’ during the pre-announcement period. A further cluster anal ysis s ho ws the A -share large and medium cap groups have str onger d rifting e ffect tha n small ca p group, which is different from the foreign stock market. What’s more, cluste r analysis als o s uggests that unexpecte d ea rning i s a more obvious driven force in Q1 than in other periods. Figure 2. Behavior of Decile 10 ’s CAR at 60 trading days for SUE model. Figure 3. Behavior of Cap Groups’ CA R over [ 0,60] trading period for SU E model. 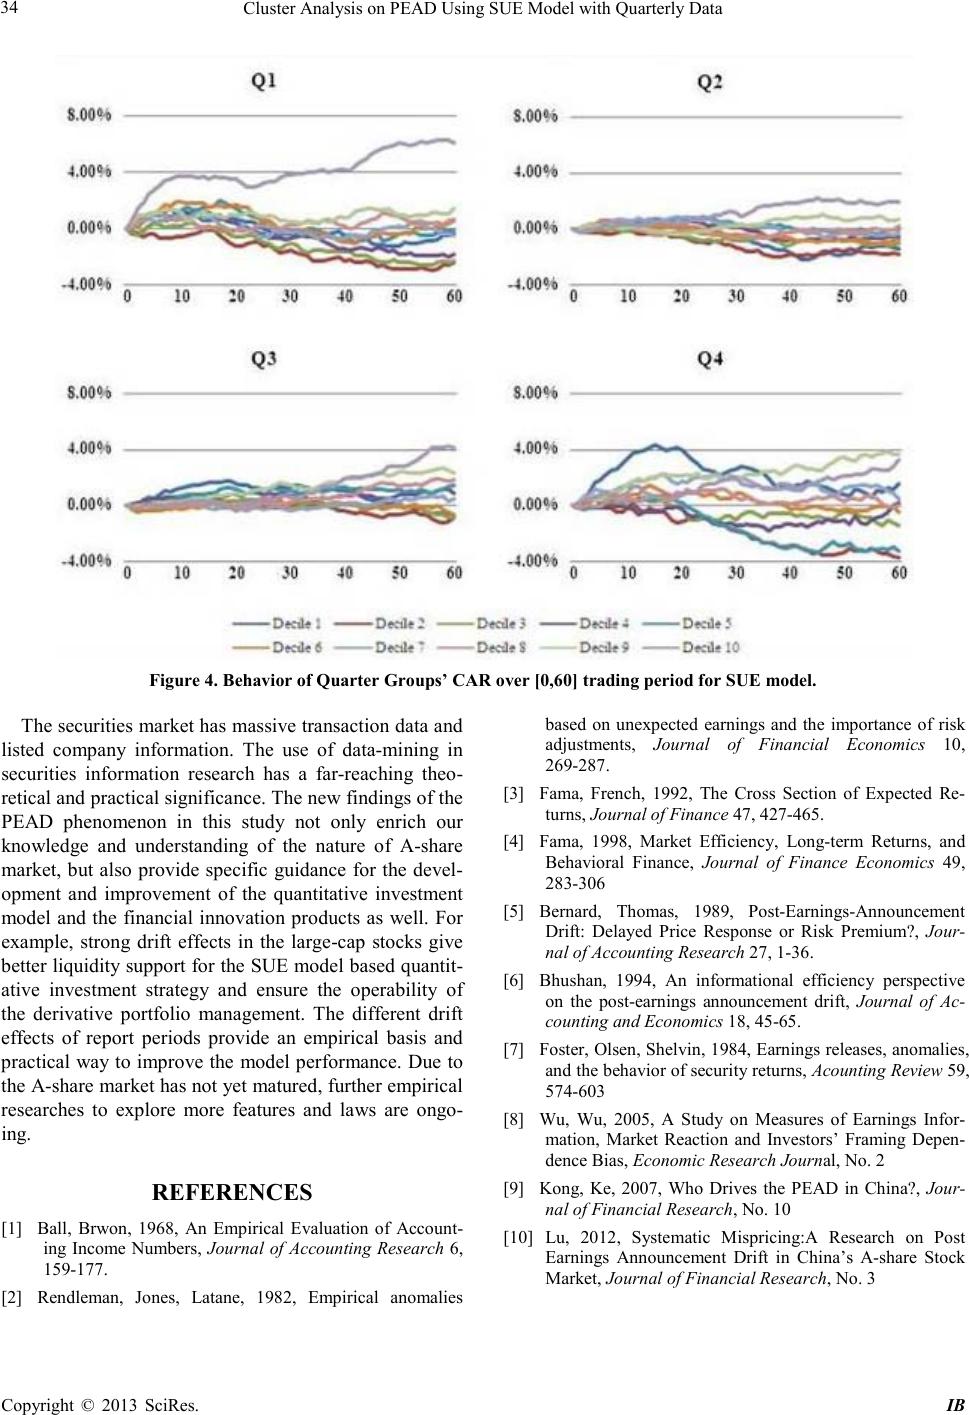 Cluster Analysis on PEAD Using SUE Model with Quarterly Data Copyright © 2013 SciRes. IB 34 Figure 4. B ehavior of Quarter Grou ps’ CA R over [0,60] t rading period for S UE model. The securities market has massive transaction data and listed company information. The use of data-mining in securities information research has a far-reaching theo- retical and practical significance. The new findings of the PEAD phenomenon in this study not only enrich our knowledge and understanding of the nature of A-share market, but also provide specific guidance for the devel- opment and improvement of the quantitative investment model and the financial innovation products as well. For example, strong drift effects in the large-cap stocks give better liquidity support for the SUE model based quantit- ative investment strategy and ensure the operability of the derivative portfolio management. The different drift effects of report periods provide an empirical basis and practical way to improve the model performance. Due to the A-share market has not yet matured, further empirical researches to explore more features and laws are ongo- ing. REFERENCES [1] Ball, Brwon, 1968, An Empirical Evaluation of Account- ing Income Numbers, Journal of Accounting Research 6, 159-177. [2] Rendleman, Jones, Latane, 1982, Empirical anomalies based on unexpected earnings and the importance of risk adjustments, Journal of Financial Economics 10, 269-287. [3] Fama, French, 1992, The Cross Section of Expected Re- turns, Journal of F in ance 47, 427-465. [4] Fama, 1998, Market Efficiency, Long-term Returns, and Behavioral Finance, Journal of Finance Economics 49, 283-306 [5] Bernard, Thomas, 1989, Post-Earnings-Announcement Drift: Delayed Price Response or Risk Premium?, Jour- nal of Accounting Research 27, 1-36. [6] Bhushan, 1994, An informational efficiency perspective on the post-earnings announcement drift, Journal of Ac- counting and Economics 18, 45-65. [7] Fo ster, Olsen , Shelvin, 1984, E arnings releases, an omalies, and the behavior of security returns, Acounting Review 59, 574-603 [8] Wu, Wu, 2005, A Study on Measures of Earnings Infor- mation, Market Reaction and Investors’ Framing Depen- dence Bias, Economic Research Journal, No. 2 [9] Kong, Ke, 2007, Who Drives the PEAD in China?, Jour- nal of Financial Research, No. 10 [10] Lu, 2012, Systematic Mispricing:A Research on Post Earnings Announcement Drift in China’s A-share Stock Market, Journal of Financial Research, No. 3 |