Paper Menu >>
Journal Menu >>
 iBusiness, 2013, 5, 1-5 doi:10.4236/ib.2013.51b001 Published Online March 2013 (http://www.scirp.org/journal/ib) Copyright © 2013 SciRes. IB 1 The Logit Model Based on Owners` Equity Statement in the Use of the Financial Risk Pre-warning Zhaoyuan Geng, Yini Wang, Fei Shao Department of Applied Economics, Business School of Zhejiang University City College, Hangzhou, China. Email: gengzy@zucc.edu.cn Received 2013 ABSTRACT Under the premise that the global economic environment is in the turbulence, companies need to strive to make their own in this environment and seek further development, which makes researches on the financial pre-warning particu- larly important.This article stand in the point of perspective of changes in equity, through the significant difference be- tween the U test build pre-warning indicators, the use of Logit models with owner changes in equity provided by the establishment of early warning financial indicators model, an empirical study of listed companies. The empirical results show that the Logit model based on owners` equity statement in the use of the financial risk pre-warning can accurately predict the financial distress of listed companies. Keywords: Owners` Equity Statement; Logit Model; Financial Risk Pre-warning 1. Introduction With the constantly adjusting of the nation’s economic structure and frame, the companies are facing to a more fierce competition. The failure of various economic deci- sions may lead to bankruptcy. Since the financial risk pre-warning can be regarded as a weatherglass of the economic function, well as a guiding light of the compa- nies’ business, it not only has the high academic value, but also be of great application value to do research of it [1]. According to the new accounting standard, the own- ers’ equity statement is added up to the audit report. So the author thinks that the owner’s equity statement is very important for the financial risk pre-warning and the perfection of the financial pre-warning system appears to be more significant [2]. This article is based on the re- search of the use of the logit model in the financial risk pre-warning. It adopts the average index of the financial data quoted from the ST and non-ST companies to judge this model can weather or not be used in the accurate financial risk pre-warning. 2. The Basic Theory of the Financial Risk Pre-Warning Logit Model 2.1. The Basic Theory of the Financial Pre-Warning Logit Model can be Mainly Divided into Two Parts 1) The basic theory of the sample selection: this article chooses 20 listed companies which are first announced as the ST (they are still now) between 2008 and 2010 as the sample of the financial risk company .It matches the ST companies and the non-ST companies in the ratio of 1:1. It also selects 21 companies as the sample of the healthy companies. These companies have never been announced as the ST. 2) The basic theory of the owners` equity statement financial risk pre-warning index: a) The profitability analysis is mainly relied on the re- turn on equity=comprehensive income/equity and the net return on capital=net profit/net capital. b) The profit distribution analysis is realized by the calculating of profit distribution rate=the distribution of profits to shareholders/net profit. c) The asset management capability analysis can be divided into asset margin rate (net profit/total assets) and capital gains rate (gain/total assets). d) The solvency analysis can be realized by the ana- lyzing of equity ratio (debt/equity). [3] 2.2. Sample Selection Through the researching of many models, the author finds that simple linear regression [4] is obviously simple with low overall identification accuracy. So it can’t fully reflect the overall financial characteristics. Although the Z model and the F model [5] have a better accuracy of the recognition, they are difficult to realize because of the high requirement for the sample. In terms of the in- dustry and company size, these models don’t have the 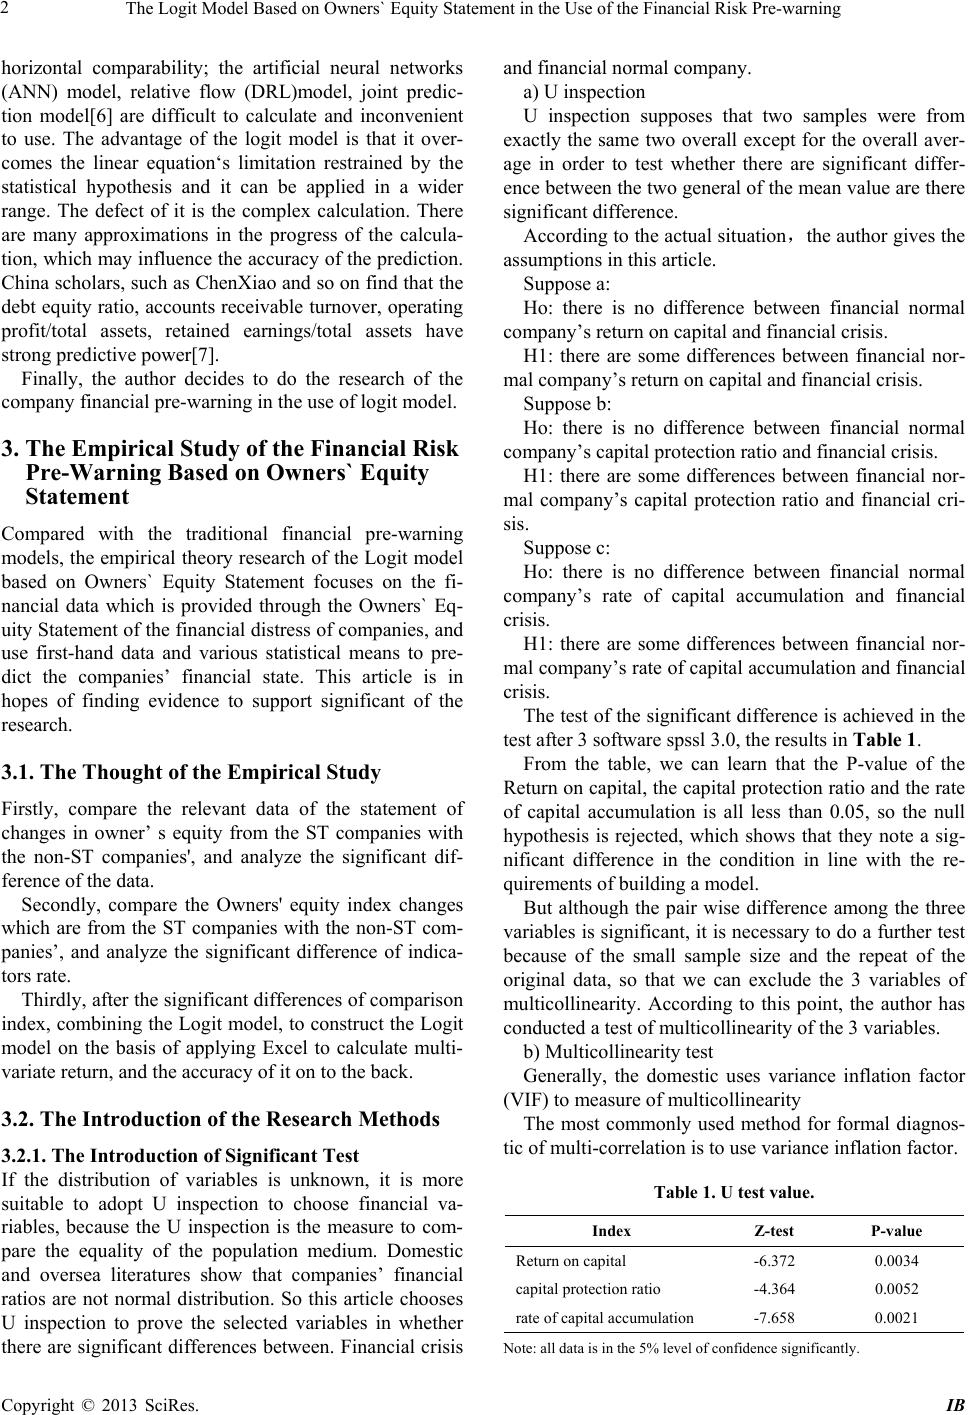 The Logit Model Based on Owners` Equity Statement in the Use of the Financial Risk Pre-warning Copyright © 2013 SciRes. IB 2 horizontal comparability; the artificial neural networks (ANN) model, relative flow (DRL)model, joint predic- tion model[6] are difficult to calculate and inconvenient to use. The advantage of the logit model is that it over- comes the linear equation‘s limitation restrained by the statistical hypothesis and it can be applied in a wider range. The defect of it is the complex calculation. There are many approximations in the progress of the calcula- tion, which may influence the accuracy of the prediction. China scholars, such as ChenXiao and so on find that the debt equity ratio, accounts receivable turnover, operating profit/total assets, retained earnings/total assets have strong predictive power[7]. Finally, the author decides to do the research of the company financial pre-warning in the use of logit model. 3. The Empirical Study of the Financial Risk Pre-Warning Based on Owners` Equity Statement Compared with the traditional financial pre-warning models, the empirical theory research of the Logit model based on Owners` Equity Statement focuses on the fi- nancial data which is provided through the Owners` Eq- uity Statement of the financial distress of companies, and use first-hand data and various statistical means to pre- dict the companies’ financial state. This article is in hopes of finding evidence to support significant of the research. 3.1. The Thought of the Empirical Study Firstly, compare the relevant data of the statement of changes in owner’ s equity from the ST companies with the non-ST companies', and analyze the significant dif- ference of the data. Secondly, compare the Owners' equity index changes which are from the ST companies with the non-ST com- panies’, and analyze the significant difference of indica- tors rate. Thirdly, after the significant differences of comparison index, combining the Logit model, to construct the Logit model on the basis of applying Excel to calculate multi- variate return, and the accuracy of it on to the back. 3.2. The Introduction of the Research Methods 3.2.1. The Introduction of Significant Test If the distribution of variables is unknown, it is more suitable to adopt U inspection to choose financial va- riables, because the U inspection is the measure to com- pare the equality of the population medium. Domestic and oversea literatures show that companies’ financial ratios are not normal distribution. So this article chooses U inspection to prove the selected variables in whether there are significant differences between. Financial crisis and financial normal company. a) U inspection U inspection supposes that two samples were from exactly the same two overall except for the overall aver- age in order to test whether there are significant differ- ence between the two general of the mean value are there significant difference. According to the actual situation,the author gives the assumptions in this article. Suppose a: Ho: there is no difference between financial normal company’s return on capital and financial crisis. H1: there are some differences between financial nor- mal company’s return on capital and financial crisis. Suppose b: Ho: there is no difference between financial normal company’s capital protection ratio and financial crisis. H1: there are some differences between financial nor- mal company’s capital protection ratio and financial cri- sis. Suppose c: Ho: there is no difference between financial normal company’s rate of capital accumulation and financial crisis. H1: there are some differences between financial nor- mal company’s rate of capital accumulation and financial crisis. The test of the significant difference is achieved in the test after 3 software spssl 3.0, the results in Table 1. From the table, we can learn that the P-value of the Return on capital, the capital protection ratio and the rate of capital accumulation is all less than 0.05, so the null hypothesis is rejected, which shows that they note a sig- nificant difference in the condition in line with the re- quirements of building a model. But although the pair wise difference among the three variables is significant, it is necessary to do a further test because of the small sample size and the repeat of the original data, so that we can exclude the 3 variables of multicollinearity. According to this point, the author has conducted a test of multicollinearity of the 3 variables. b) Multicollinearity test Generally, the domestic uses variance inflation factor (VIF) to measure of multicollinearity The most commonly used method for formal diagnos- tic of multi-correlation is to use variance inflation factor. Table 1. U test value. Index Z-test P-value Return on capital -6.372 0.0034 capital protection ratio -4.364 0.0052 rate of capital accumulation -7.658 0.0021 Note: all data is in the 5% level of confidence significantly. 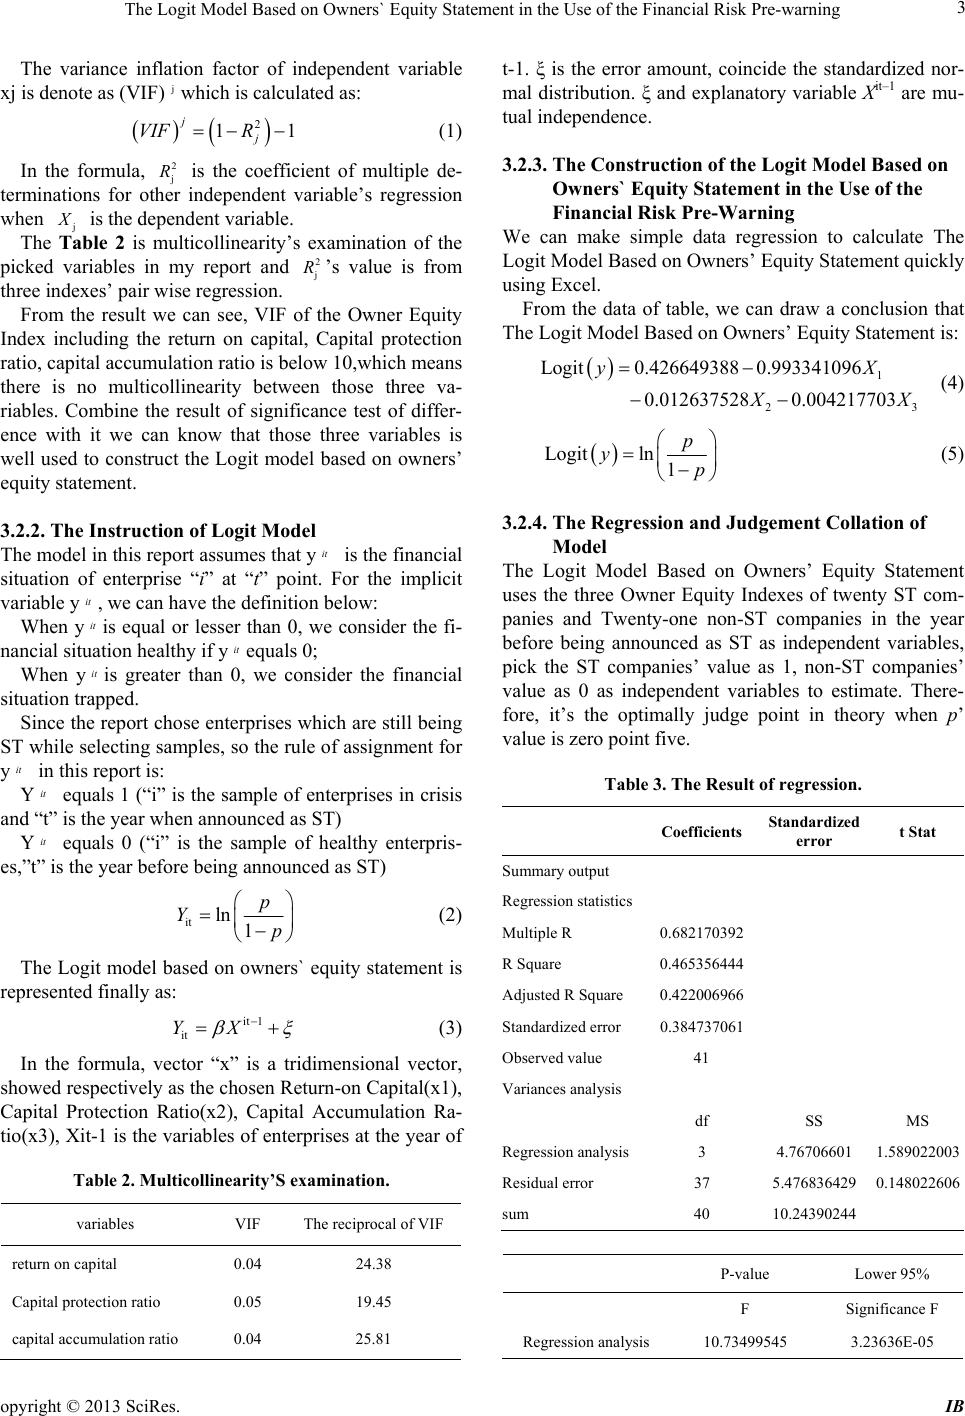 The Logit Model Based on Owners` Equity Statement in the Use of the Financial Risk Pre-warning opyright © 2013 SciRes. IB 3 The variance inflation factor of independent variable xj is denote as (VIF)jwhich is calculated as: 2 11 j j VIF R (1) In the formula, 2 j R is the coefficient of multiple de- terminations for other independent variable’s regression when j X is the dependent variable. The Table 2 is multicollinearity’s examination of the picked variables in my report and 2 j R ’s value is from three indexes’ pair wise regression. From the result we can see, VIF of the Owner Equity Index including the return on capital, Capital protection ratio, capital accumulation ratio is below 10,which means there is no multicollinearity between those three va- riables. Combine the result of significance test of differ- ence with it we can know that those three variables is well used to construct the Logit model based on owners’ equity statement. 3.2.2. The Instruction of Logit Model The model in this report assumes that yit is the financial situation of enterprise “i” at “t” point. For the implicit variable y it , we can have the definition below: When yit is equal or lesser than 0, we consider the fi- nancial situation healthy if yitequals 0; When yit is greater than 0, we consider the financial situation trapped. Since the report chose enterprises which are still being ST while selecting samples, so the rule of assignment for yit in this report is: Yit equals 1 (“i” is the sample of enterprises in crisis and “t” is the year when announced as ST) Yit equals 0 (“i” is the sample of healthy enterpris- es,”t” is the year before being announced as ST) it ln 1 p Yp (2) The Logit model based on owners` equity statement is represented finally as: it 1 it YX (3) In the formula, vector “x” is a tridimensional vector, showed respectively as the chosen Return-on Capital(x1), Capital Protection Ratio(x2), Capital Accumulation Ra- tio(x3), Xit-1 is the variables of enterprises at the year of Table 2. Multicollinearity’S examination. variables VIF The reciprocal of VIF return on capital 0.04 24.38 Capital protection ratio 0.05 19.45 capital accumulation ratio 0.04 25.81 t-1. ξ is the error amount, coincide the standardized nor- mal distribution. ξ and explanatory variable Xit–1 are mu- tual independence. 3.2.3. The Co nstruction of the Lo gi t Model Based on Owners` Equity Statement in the Use of the Financial Risk Pre-Warning We can make simple data regression to calculate The Logit Model Based on Owners’ Equity Statement quickly using Excel. From the data of table, we can draw a conclusion that The Logit Model Based on Owners’ Equity Statement is: 1 23 Logit0.426649388 0.993341096 0.0126375280.004217703 yX X X (4) Logitln 1 p yp (5) 3.2.4. The Regressi on and Judgement Collation of Model The Logit Model Based on Owners’ Equity Statement uses the three Owner Equity Indexes of twenty ST com- panies and Twenty-one non-ST companies in the year before being announced as ST as independent variables, pick the ST companies’ value as 1, non-ST companies’ value as 0 as independent variables to estimate. There- fore, it’s the optimally judge point in theory when p’ value is zero point five. Table 3. The Result of regression. Coefficients Standardized error t Stat Summary output Regression statistics Multiple R 0.682170392 R Square 0.465356444 Adjusted R Square 0.422006966 Standardized error 0.384737061 Observed value 41 Variances analysis df SS MS Regression analysis 3 4.76706601 1.589022003 Residual error 37 5.476836429 0.148022606 sum 40 10.24390244 P-value Lower 95% F Significance F Regression analysis 10.73499545 3.23636E-05 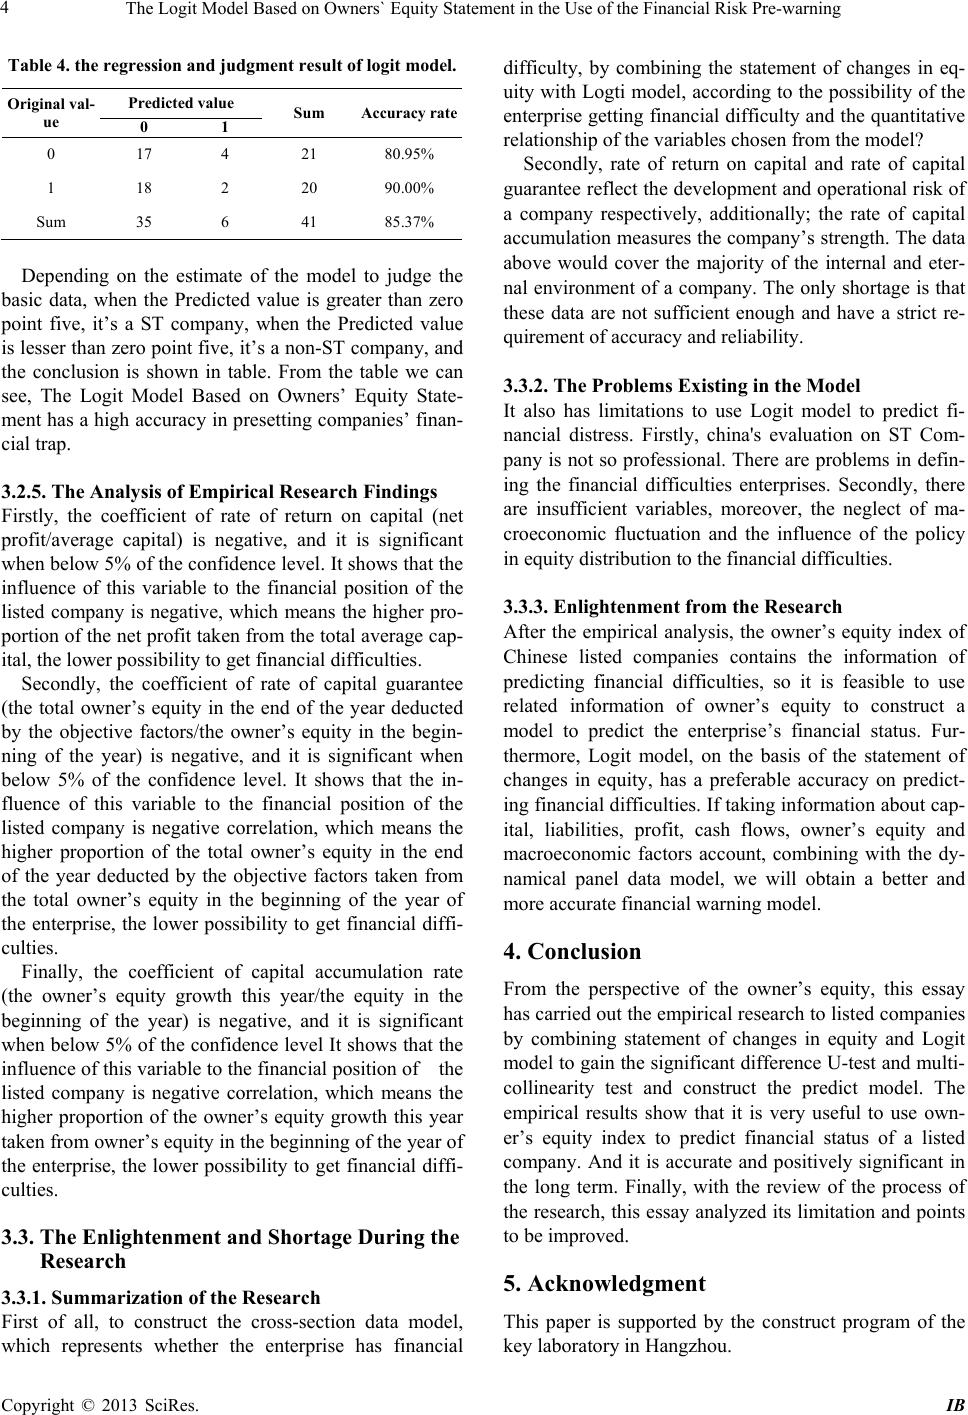 The Logit Model Based on Owners` Equity Statement in the Use of the Financial Risk Pre-warning Copyright © 2013 SciRes. IB 4 Table 4. the regression and judgment result of logit model. Original val- ue Predicted value Sum Accuracy rate 0 1 0 17 4 21 80.95% 1 18 2 20 90.00% Sum 35 6 41 85.37% Depending on the estimate of the model to judge the basic data, when the Predicted value is greater than zero point five, it’s a ST company, when the Predicted value is lesser than zero point five, it’s a non-ST company, and the conclusion is shown in table. From the table we can see, The Logit Model Based on Owners’ Equity State- ment has a high accuracy in presetting companies’ finan- cial trap. 3.2.5. The Analysis of Empirical Research Findings Firstly, the coefficient of rate of return on capital (net profit/average capital) is negative, and it is significant when below 5% of the confidence level. It shows that the influence of this variable to the financial position of the listed company is negative, which means the higher pro- portion of the net profit taken from the total average cap- ital, the lower possibility to get financial difficulties. Secondly, the coefficient of rate of capital guarantee (the total owner’s equity in the end of the year deducted by the objective factors/the owner’s equity in the begin- ning of the year) is negative, and it is significant when below 5% of the confidence level. It shows that the in- fluence of this variable to the financial position of the listed company is negative correlation, which means the higher proportion of the total owner’s equity in the end of the year deducted by the objective factors taken from the total owner’s equity in the beginning of the year of the enterprise, the lower possibility to get financial diffi- culties. Finally, the coefficient of capital accumulation rate (the owner’s equity growth this year/the equity in the beginning of the year) is negative, and it is significant when below 5% of the confidence level It shows that the influence of this variable to the financial position of the listed company is negative correlation, which means the higher proportion of the owner’s equity growth this year taken from owner’s equity in the beginning of the year of the enterprise, the lower possibility to get financial diffi- culties. 3.3. The Enlightenment and Shortage During the Research 3.3.1. Summa ri z ati on of the Research First of all, to construct the cross-section data model, which represents whether the enterprise has financial difficulty, by combining the statement of changes in eq- uity with Logti model, according to the possibility of the enterprise getting financial difficulty and the quantitative relationship of the variables chosen from the model? Secondly, rate of return on capital and rate of capital guarantee reflect the development and operational risk of a company respectively, additionally; the rate of capital accumulation measures the company’s strength. The data above would cover the majority of the internal and eter- nal environment of a company. The only shortage is that these data are not sufficient enough and have a strict re- quirement of accuracy and reliability. 3.3.2. The Problems Existing in the Model It also has limitations to use Logit model to predict fi- nancial distress. Firstly, china's evaluation on ST Com- pany is not so professional. There are problems in defin- ing the financial difficulties enterprises. Secondly, there are insufficient variables, moreover, the neglect of ma- croeconomic fluctuation and the influence of the policy in equity distribution to the financial difficulties. 3.3.3. Enlightenment from the Research After the empirical analysis, the owner’s equity index of Chinese listed companies contains the information of predicting financial difficulties, so it is feasible to use related information of owner’s equity to construct a model to predict the enterprise’s financial status. Fur- thermore, Logit model, on the basis of the statement of changes in equity, has a preferable accuracy on predict- ing financial difficulties. If taking information about cap- ital, liabilities, profit, cash flows, owner’s equity and macroeconomic factors account, combining with the dy- namical panel data model, we will obtain a better and more accurate financial warning model. 4. Conclusion From the perspective of the owner’s equity, this essay has carried out the empirical research to listed companies by combining statement of changes in equity and Logit model to gain the significant difference U-test and multi- collinearity test and construct the predict model. The empirical results show that it is very useful to use own- er’s equity index to predict financial status of a listed company. And it is accurate and positively significant in the long term. Finally, with the review of the process of the research, this essay analyzed its limitation and points to be improved. 5. Acknowledgment This paper is supported by the construct program of the key laboratory in Hangzhou.  The Logit Model Based on Owners` Equity Statement in the Use of the Financial Risk Pre-warning opyright © 2013 SciRes. IB 5 REFERENCES [1] Peng Shaobin,Xing Jingping. The Theory of Company Financial Crisis [M]. Published by Tsinghua Universi- ty,2007,9 [2] P. Ravi Kumar,V. Ravi .Bankruptcy Prediction in Banks and Firms Via Statistical and Intelligent Techniques – A review[J]. European Journal of Operational Research , 2007, July: 1-28 [3] Xu Xinan,Ou Yanghao,Chen Qingfang.Company and Profit Management and Construction of Financial Risk Pre-warning Model[J].Accounts and Company Mange- ment,2007,(6):85-121 [4] Li Jinmei,Zhang Weiguo,Tang Mingli.The Comparative Evaluation between the Financial System-Z Fraction Model and F Fraction Model.[J].Shanghai Account,2007 [5] Lu Yongyan,Wang weiguo.The Financial Risk Predict of Manufacturing Listed Company -Empirical Analysis Based On The Panel Logit model[J].Statistic and Infor- mation Forum,2010,25(4):47-51 [6] Su Hongtao,Zhao Shouguo.The Empirical Analysis of Chinese Listed Company’s Financial Risk Pre-warning – Setting Shanxi Province’s Listed Company as an Exam- ple[J].Xi’an ’Journal of Post and Telecommunications, 2007,7 [7] Beaver W H. Financial Ratios as Predictors of Failure [J]].Journal of Accounting Research,1966,4: 71-111. |