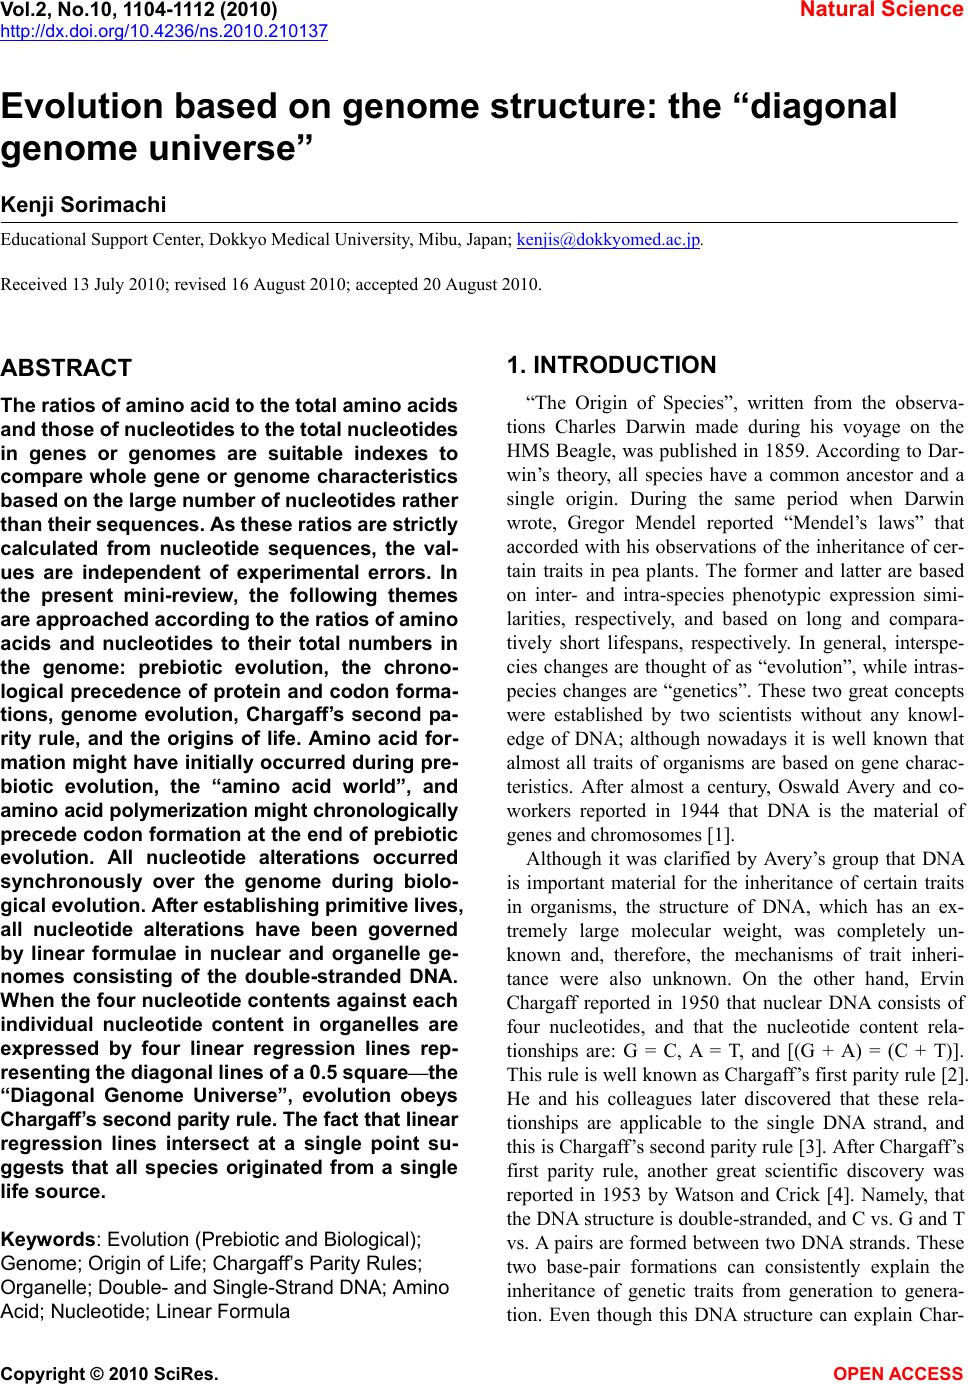
 Vol.2, No.10, 1104-1112 (2010) Natural Science http://dx.doi.org/10.4236/ns.2010.210137 Copyright © 2010 SciRes. OPEN ACCESS Evolution based on genome structure: the “diagonal genome universe” Kenji Sorimachi Educational Support Center, Dokkyo Medical University, Mibu, Japan; kenjis@dokkyomed.ac.jp. Received 13 July 2010; revised 16 August 2010; accepted 20 August 2010. ABSTRACT The ratios of amino acid to the total amino acids and those of nucleotides to the total nucleotides in genes or genomes are suitable indexes to compare whole gene or genome characteristics based on the large number of nucleotides rather than their sequences. As these ratios are strictly calculated from nucleotide sequences, the val- ues are independent of experimental errors. In the present mini-review, the following themes are approached according to the ratios of amino acids and nucleotides to their total numbers in the genome: prebiotic evolution, the chrono- logical precedence of protein and codon forma- tions, genome evolution, Chargaff’s second pa- rity rule, and the origins of life. Amino acid for- mation might have initially occurred during pre- biotic evolution, the “amino acid world”, and amino acid polymerization might chronologically precede codon formation at the end of prebiotic evolution. All nucleotide alterations occurred synchronously over the genome during biolo- gical evolution. After establishing primitive lives, all nucleotide alterations have been governed by linear formulae in nuclear and organelle ge- nomes consisting of the double-stranded DNA. When the four nucleotide contents against each individual nucleotide content in organelles are expressed by four linear regression lines rep- resenting the diagonal lines of a 0.5 square—the “Diagonal Genome Universe”, evolution obeys Chargaff’s second parity rule. The fact that linear regression lines intersect at a single point su- ggests that all species originated from a single life source. Keywords: Evolution (Prebiotic and Biological); Genome; Origin of Life; Chargaff’s Parity Rules; Organelle; Double- and Single-Strand DNA; Amino Acid; Nucleotide; Linear Formula 1. INTRODUCTION “The Origin of Species”, written from the observa- tions Charles Darwin made during his voyage on the HMS Beagle, was published in 1859. According to Dar- win’s theory, all species have a common ancestor and a single origin. During the same period when Darwin wrote, Gregor Mendel reported “Mendel’s laws” that accorded with his observations of the inheritance of cer- tain traits in pea plants. The former and latter are based on inter- and intra-species phenotypic expression simi- larities, respectively, and based on long and compara- tively short lifespans, respectively. In general, interspe- cies changes are thought of as “evolution”, while intras- pecies changes are “genetics”. These two great concepts were established by two scientists without any knowl- edge of DNA; although nowadays it is well known that almost all traits of organisms are based on gene charac- teristics. After almost a century, Oswald Avery and co- workers reported in 1944 that DNA is the material of genes and chromosomes [1]. Although it was clarified by Avery’s group that DNA is important material for the inheritance of certain traits in organisms, the structure of DNA, which has an ex- tremely large molecular weight, was completely un- known and, therefore, the mechanisms of trait inheri- tance were also unknown. On the other hand, Ervin Chargaff reported in 1950 that nuclear DNA consists of four nucleotides, and that the nucleotide content rela- tionships are: G = C, A = T, and [(G + A) = (C + T)]. This rule is well known as Chargaff’s first parity rule [2]. He and his colleagues later discovered that these rela- tionships are applicable to the single DNA strand, and this is Chargaff’s second parity rule [3]. After Chargaff’s first parity rule, another great scientific discovery was reported in 1953 by Watson and Crick [4]. Namely, that the DNA structure is double-stranded, and C vs. G and T vs. A pairs are formed between two DNA strands. These two base-pair formations can consistently explain the inheritance of genetic traits from generation to genera- tion. Even though this DNA structure can explain Char- 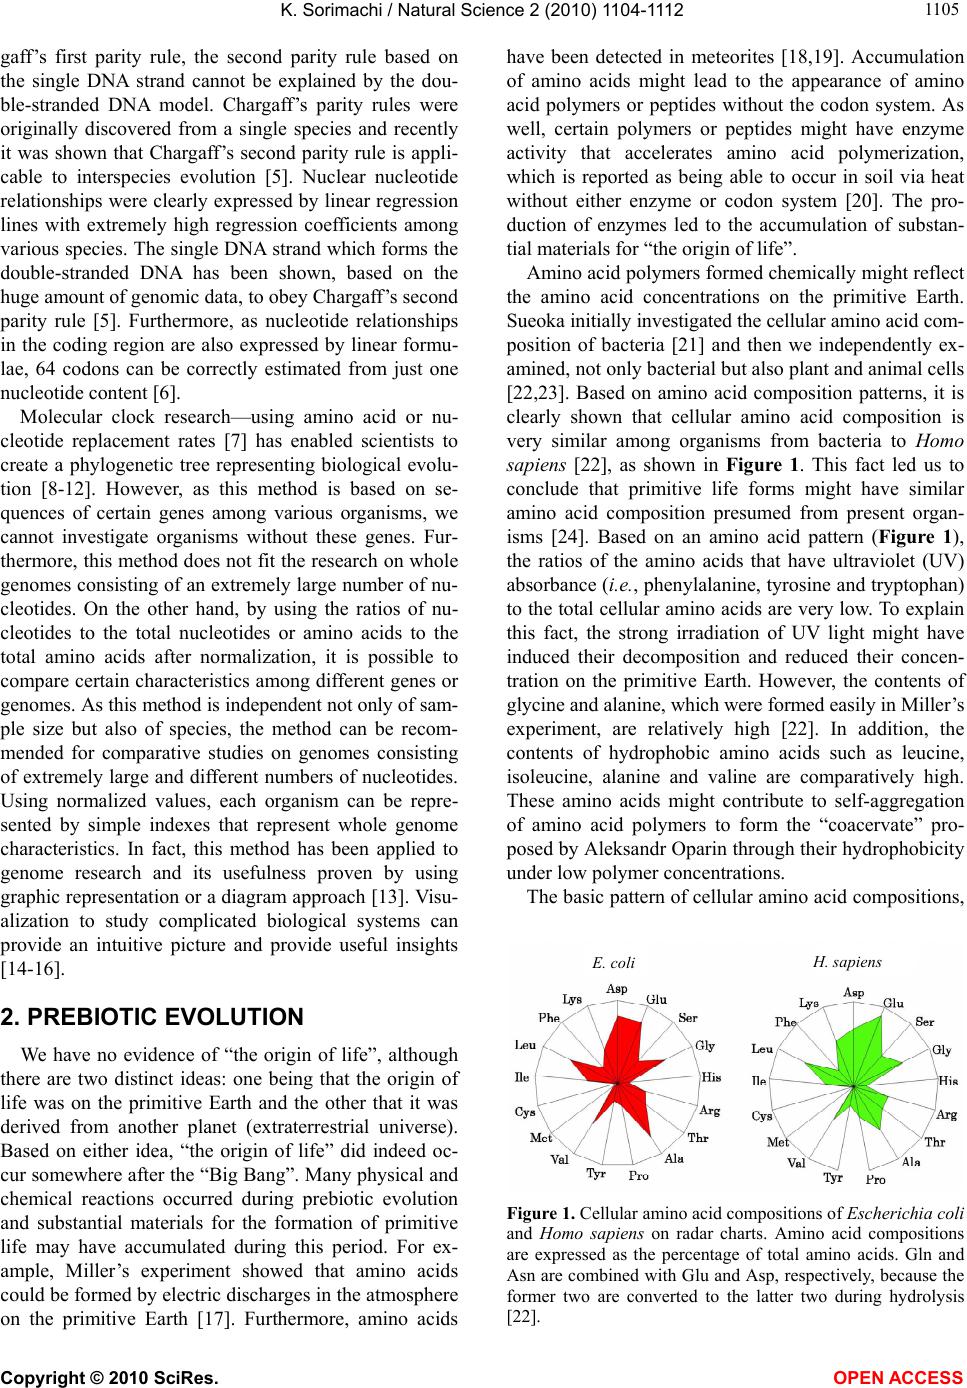 K. Sorimachi / Natural Science 2 (2010) 1104-1112 Copyright © 2010 SciRes. OPEN ACCESS 1105 gaff’s first parity rule, the second parity rule based on the single DNA strand cannot be explained by the dou- ble-stranded DNA model. Chargaff’s parity rules were originally discovered from a single species and recently it was shown that Chargaff’s second parity rule is appli- cable to interspecies evolution [5]. Nuclear nucleotide relationships were clearly expressed by linear regression lines with extremely high regression coefficients among various species. The single DNA strand which forms the double-stranded DNA has been shown, based on the huge amount of genomic data, to obey Chargaff’s second parity rule [5]. Furthermore, as nucleotide relationships in the coding region are also expressed by linear formu- lae, 64 codons can be correctly estimated from just one nucleotide content [6]. Molecular clock research—using amino acid or nu- cleotide replacement rates [7] has enabled scientists to create a phylogenetic tree representing biological evolu- tion [8-12]. However, as this method is based on se- quences of certain genes among various organisms, we cannot investigate organisms without these genes. Fur- thermore, this method does not fit the research on whole genomes consisting of an extremely large number of nu- cleotides. On the other hand, by using the ratios of nu- cleotides to the total nucleotides or amino acids to the total amino acids after normalization, it is possible to compare certain characteristics among different genes or genomes. As this method is independent not only of sam- ple size but also of species, the method can be recom- mended for comparative studies on genomes consisting of extremely large and different numbers of nucleotides. Using normalized values, each organism can be repre- sented by simple indexes that represent whole genome characteristics. In fact, this method has been applied to genome research and its usefulness proven by using graphic representation or a diagram approach [13]. Visu- alization to study complicated biological systems can provide an intuitive picture and provide useful insights [14-16]. 2. PREBIOTIC EVOLUTION We have no evidence of “the origin of life”, although there are two distinct ideas: one being that the origin of life was on the primitive Earth and the other that it was derived from another planet (extraterrestrial universe). Based on either idea, “the origin of life” did indeed oc- cur somewhere after the “Big Bang”. Many physical and chemical reactions occurred during prebiotic evolution and substantial materials for the formation of primitive life may have accumulated during this period. For ex- ample, Miller’s experiment showed that amino acids could be formed by electric discharges in the atmosphere on the primitive Earth [17]. Furthermore, amino acids have been detected in meteorites [18,19]. Accumulation of amino acids might lead to the appearance of amino acid polymers or peptides without the codon system. As well, certain polymers or peptides might have enzyme activity that accelerates amino acid polymerization, which is reported as being able to occur in soil via heat without either enzyme or codon system [20]. The pro- duction of enzymes led to the accumulation of substan- tial materials for “the origin of life”. Amino acid polymers formed chemically might reflect the amino acid concentrations on the primitive Earth. Sueoka initially investigated the cellular amino acid com- position of bacteria [21] and then we independently ex- amined, not only bacterial but also plant and animal cells [22,23]. Based on amino acid composition patterns, it is clearly shown that cellular amino acid composition is very similar among organisms from bacteria to Homo sapiens [22], as shown in Figure 1. This fact led us to conclude that primitive life forms might have similar amino acid composition presumed from present organ- isms [24]. Based on an amino acid pattern (Figure 1), the ratios of the amino acids that have ultraviolet (UV) absorbance (i.e., phenylalanine, tyrosine and tryptophan) to the total cellular amino acids are very low. To explain this fact, the strong irradiation of UV light might have induced their decomposition and reduced their concen- tration on the primitive Earth. However, the contents of glycine and alanine, which were formed easily in Miller’s experiment, are relatively high [22]. In addition, the contents of hydrophobic amino acids such as leucine, isoleucine, alanine and valine are comparatively high. These amino acids might contribute to self-aggregation of amino acid polymers to form the “coacervate” pro- posed by Aleksandr Oparin through their hydrophobicity under low polymer concentrations. The basic pattern of cellular amino acid compositions, E. coli . sapiens Figure 1. Cellular amino acid compositions of Escherichia coli and Homo sapiens on radar charts. Amino acid compositions are expressed as the percentage of total amino acids. Gln and Asn are combined with Glu and Asp, respectively, because the former two are converted to the latter two during hydrolysis [22]. 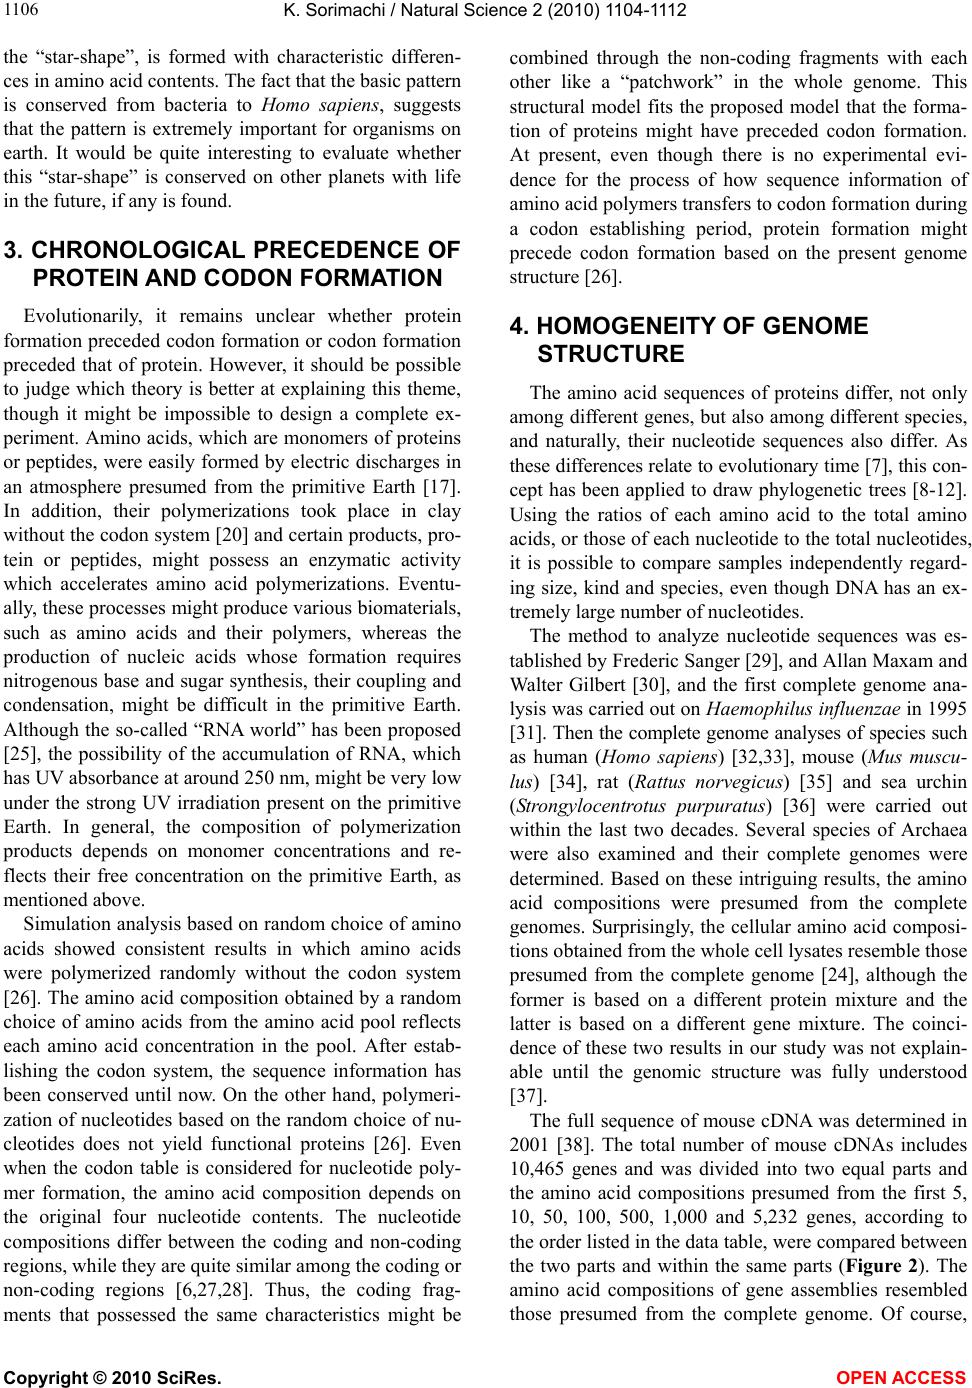 K. Sorimachi / Natural Science 2 (2010) 1104-1112 Copyright © 2010 SciRes. OPEN ACCESS 1106 the “star-shape”, is formed with characteristic differen- ces in amino acid contents. The fact that the basic pattern is conserved from bacteria to Homo sapiens, suggests that the pattern is extremely important for organisms on earth. It would be quite interesting to evaluate whether this “star-shape” is conserved on other planets with life in the future, if any is found. 3. CHRONOLOGICAL PRECEDENCE OF PROTEIN AND CODON FORMATION Evolutionarily, it remains unclear whether protein formation preceded codon formation or codon formation preceded that of protein. However, it should be possible to judge which theory is better at explaining this theme, though it might be impossible to design a complete ex- periment. Amino acids, which are monomers of proteins or peptides, were easily formed by electric discharges in an atmosphere presumed from the primitive Earth [17]. In addition, their polymerizations took place in clay without the codon system [20] and certain products, pro- tein or peptides, might possess an enzymatic activity which accelerates amino acid polymerizations. Eventu- ally, these processes might produce various biomaterials, such as amino acids and their polymers, whereas the production of nucleic acids whose formation requires nitrogenous base and sugar synthesis, their coupling and condensation, might be difficult in the primitive Earth. Although the so-called “RNA world” has been proposed [25], the possibility of the accumulation of RNA, which has UV absorbance at around 250 nm, might be very low under the strong UV irradiation present on the primitive Earth. In general, the composition of polymerization products depends on monomer concentrations and re- flects their free concentration on the primitive Earth, as mentioned above. Simulation analysis based on random choice of amino acids showed consistent results in which amino acids were polymerized randomly without the codon system [26]. The amino acid composition obtained by a random choice of amino acids from the amino acid pool reflects each amino acid concentration in the pool. After estab- lishing the codon system, the sequence information has been conserved until now. On the other hand, polymeri- zation of nucleotides based on the random choice of nu- cleotides does not yield functional proteins [26]. Even when the codon table is considered for nucleotide poly- mer formation, the amino acid composition depends on the original four nucleotide contents. The nucleotide compositions differ between the coding and non-coding regions, while they are quite similar among the coding or non-coding regions [6,27,28]. Thus, the coding frag- ments that possessed the same characteristics might be combined through the non-coding fragments with each other like a “patchwork” in the whole genome. This structural model fits the proposed model that the forma- tion of proteins might have preceded codon formation. At present, even though there is no experimental evi- dence for the process of how sequence information of amino acid polymers transfers to codon formation during a codon establishing period, protein formation might precede codon formation based on the present genome structure [26]. 4. HOMOGENEITY OF GENOME STRUCTURE The amino acid sequences of proteins differ, not only among different genes, but also among different species, and naturally, their nucleotide sequences also differ. As these differences relate to evolutionary time [7], this con- cept has been applied to draw phylogenetic trees [8-12]. Using the ratios of each amino acid to the total amino acids, or those of each nucleotide to the total nucleotides, it is possible to compare samples independently regard- ing size, kind and species, even though DNA has an ex- tremely large number of nucleotides. The method to analyze nucleotide sequences was es- tablished by Frederic Sanger [29], and Allan Maxam and Walter Gilbert [30], and the first complete genome ana- lysis was carried out on Haemophilus influenzae in 1995 [31]. Then the complete genome analyses of species such as human (Homo sapiens) [32,33], mouse (Mus muscu- lus) [34], rat (Rattus norvegicus) [35] and sea urchin (Strongylocentrotus purpuratus) [36] were carried out within the last two decades. Several species of Archaea were also examined and their complete genomes were determined. Based on these intriguing results, the amino acid compositions were presumed from the complete genomes. Surprisingly, the cellular amino acid composi- tions obtained from the whole cell lysates resemble those presumed from the complete genome [24], although the former is based on a different protein mixture and the latter is based on a different gene mixture. The coinci- dence of these two results in our study was not explain- able until the genomic structure was fully understood [37]. The full sequence of mouse cDNA was determined in 2001 [38]. The total number of mouse cDNAs includes 10,465 genes and was divided into two equal parts and the amino acid compositions presumed from the first 5, 10, 50, 100, 500, 1,000 and 5,232 genes, according to the order listed in the data table, were compared between the two parts and within the same parts (Figure 2). The amino acid compositions of gene assemblies resembled those presumed from the complete genome. Of course, 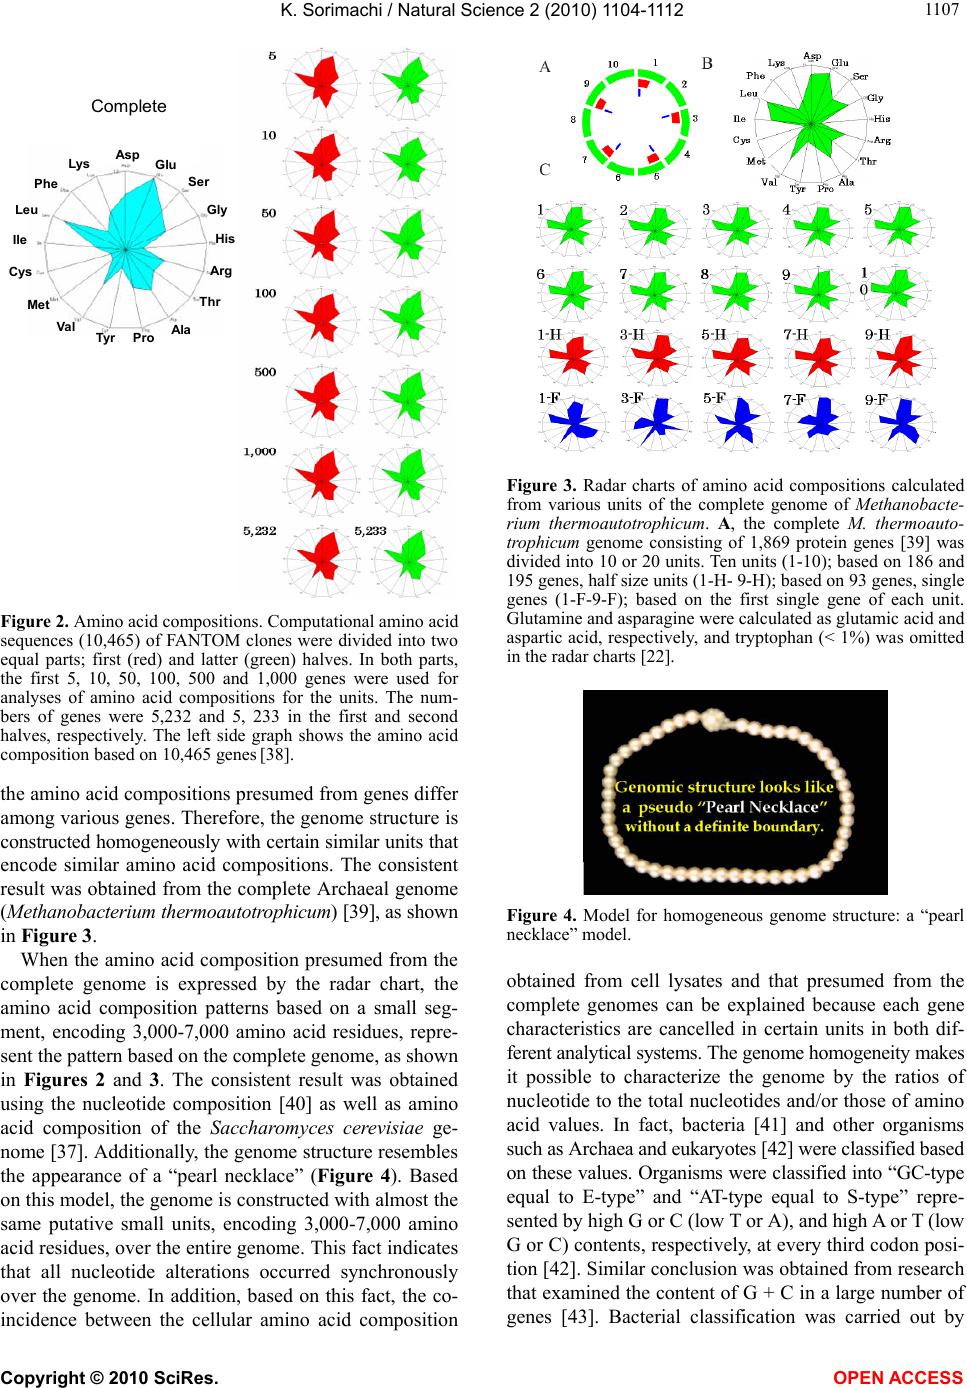 K. Sorimachi / Natural Science 2 (2010) 1104-1112 Copyright © 2010 SciRes. OPEN ACCESS 1107 Asp Glu Ser Gly His Arg Thr Val Met Phe Lys Tyr Pro Complete Ala Leu Cys Ile Figure 2. Amino acid compositions. Computational amino acid sequences (10,465) of FANTOM clones were divided into two equal parts; first (red) and latter (green) halves. In both parts, the first 5, 10, 50, 100, 500 and 1,000 genes were used for analyses of amino acid compositions for the units. The num- bers of genes were 5,232 and 5, 233 in the first and second halves, respectively. The left side graph shows the amino acid composition based on 10,465 genes [38]. the amino acid compositions presumed from genes differ among various genes. Therefore, the genome structure is constructed homogeneously with certain similar units that encode similar amino acid compositions. The consistent result was obtained from the complete Archaeal genome (Methanobacterium thermoautotrophicum) [39], as shown in Figure 3. When the amino acid composition presumed from the complete genome is expressed by the radar chart, the amino acid composition patterns based on a small seg- ment, encoding 3,000-7,000 amino acid residues, repre- sent the pattern based on the complete genome, as shown in Figures 2 and 3. The consistent result was obtained using the nucleotide composition [40] as well as amino acid composition of the Saccharomyces cerevisiae ge- nome [37]. Additionally, the genome structure resembles the appearance of a “pearl necklace” (Figure 4). Based on this model, the genome is constructed with almost the same putative small units, encoding 3,000-7,000 amino acid residues, over the entire genome. This fact indicates that all nucleotide alterations occurred synchronously over the genome. In addition, based on this fact, the co- incidence between the cellular amino acid composition Figure 3. Radar charts of amino acid compositions calculated from various units of the complete genome of Methanobacte- rium thermoautotrophicum. A, the complete M. thermoauto- trophicum genome consisting of 1,869 protein genes [39] was divided into 10 or 20 units. Ten units (1-10); based on 186 and 195 genes, half size units (1-H- 9-H); based on 93 genes, single genes (1-F-9-F); based on the first single gene of each unit. Glutamine and asparagine were calculated as glutamic acid and aspartic acid, respectively, and tryptophan (< 1%) was omitted in the radar charts [22]. Figure 4. Model for homogeneous genome structure: a “pearl necklace” model. obtained from cell lysates and that presumed from the complete genomes can be explained because each gene characteristics are cancelled in certain units in both dif- ferent analytical systems. The genome homogeneity makes it possible to characterize the genome by the ratios of nucleotide to the total nucleotides and/or those of amino acid values. In fact, bacteria [41] and other organisms such as Archaea and eukaryotes [42] were classified based on these values. Organisms were classified into “GC-type equal to E-type” and “AT-type equal to S-type” repre- sented by high G or C (low T or A), and high A or T (low G or C) contents, respectively, at every third codon posi- tion [42]. Similar conclusion was obtained from research that examined the content of G + C in a large number of genes [43]. Bacterial classification was carried out by  K. Sorimachi / Natural Science 2 (2010) 1104-1112 Copyright © 2010 SciRes. OPEN ACCESS 1108 another method with similar results [44]. 5. GENOME EVOLUTION All organism’s DNA consists of four nucleotides such as G, C, T and A, and it is possible to simulate their con- tents by a random choice of certain numbers [45]. In addition, the relationships of the four nucleotide contents can be mathematically expressed by linear formulae whether or not the four values correlate to each other. Based on the random choice of nucleotide contents, their relationships are heteroskedastic, although nucleotide content distributions are homogeneous [45]. On the other hand, for example, when plotting four nucleotide con- tents against certain nucleotide content in the complete chloroplast genome, their relationships were expressed by four linear regression lines with high regression coef- ficients [28], as shown in Figure 5. The lines G and C overlap, and the lines T and A overlap. This indicates that G = C and T = A in chloroplast DNA. Thus, chloro- plast genome evolution is governed by Chargaff’s sec- ond parity rule. Plant mitochondrial evolution was also governed by this rule, while animal mitochondrial evo- lution deviated from the rule [28]. These organelles were incorporated into only eukaryotes, which appeared evo- lutionarily later than bacteria. The contents of G or C were less than 0.25 and those of A or T were more than 0.25 [28], as shown in Figure 5. Thus, nucleotide con- tents are biased in organelle DNA because of a shorter evolutionary period compared with nuclear DNA. 6. CHARGAFF’S PARITY RULES Chargaff’s first parity rule was obtained experimen- tally in 1950 and the rule represents intraspecies: G = C, A = T and [(G + A) = (C + T)]. Nowadays we know that nuclear DNA structure is double-stranded [4] and the first parity rule is easily understandable. However, the 0.00 0.10 0.20 0.30 0.40 0.50 0.00 0.05 0.100.15 0.200.25 Nucleotide Content C Content Figure 5. Nucleotide content relationships in chloroplasts. Four nucleotide contents were expressed by C content. Pink squares, C; blue diamonds, G; red triangles, T and green trian- gles, A. This figure has been presented in Natural Science, 2(5); 519-525, 2010 and reproduced with permission. second parity rule, which is applicable to the single DNA strands forming the double-stranded DNA, has been an enigma of how to make the base pairs in the single DNA strand since being published in 1968 [3]. Recently, this puzzle has been solved mathematically [46] based on genome structure homogeneity [37,40] and similarity between the forward and reverse strands [6]. To solve this puzzle, however, the double-stranded structure was necessary [46], as shown in Figure 6. This fact indicates that the genome structure might be double-stranded at the stage of primitive life. Both rules are intraspecies rules. Mitchell and Bridge examined a large number of complete genomes to determine whether Chargaff’s se- cond parity rule was applicable to interspecies relation- ships [5] and concluded that only the single DNA strand forming the double-stranded DNA is applicable to the second parity rule [5]. This fact indicates that Chargaff’s second parity rule is clearly correlated to biological evo- lution. In addition, although codon evolution with- in the coding region is expressed by a linear formula, it devi- ates from Chargaff’s second parity rule [6]. However, when plotting nucleotide contents in the coding or non- coding region agafinst nucleotide content in the com- plete single DNA strand, genome evolution obeys Char- gaff’s second parity rule [28], as shown in Figure 7. Nucleotide content relationships in the coding or non- coding regions against the nucleotide content in the com- plete single DNA strand between chloroplast and plant mitochondria are expressed by different regression lines [27]. According to this plotting manner, linear regression lines between chloroplast and plant mitochondria inter- sect forming the “V-shape” [27], and similarly, linear regression lines between the coding and non-coding re- gions intersect forming the “V-shape” [27]. These two cases clearly indicate that chloroplast and plant mito- chondria, and the coding and non-coding regions de- scended from similar origins. Furthermore, when the four nucleotide contents are 3’ Gx , Cx , Tx , Ax Gy , Cy , Ty , Ay 5’ Gx’, Cx’, Tx’, Ax’ Gy’, Cy’, Ty’, Ay’ X Com lement X’Com lement Y’ Y 5’ 3’ Figure 6. Double-stranded DNA model. The complete genome was divided into two fragments [46]. The contents of Gx and Cx in the fragment X are expressed via the reverse (comple- mentary) strand by Cy and Gy, respectively, because (Gx ≈ Gy’ = Cy) and (Cx ≈ Cy’ = Gy). Therefore, (Gx + Gy ≈ Gx + Cx) and (Cx + Cy ≈ Cx + Gx). In both equations, as the right hand side is equal, Gx + Gy ≈ Cx + Cy. Finally, G ≈ C. Similarly, T ≈ A.  K. Sorimachi / Natural Science 2 (2010) 1104-1112 Copyright © 2010 SciRes. OPEN ACCESS 1109 Figure 7. Nucleotide relationships in normalized chloroplast values. Upper panel, coding region; lower panel, non-coding region. Red squares, G; green triangles, C; blue diamonds, A; and shallow blue crosses, T. The composition of each nucleo- tide in the coding or non-coding region was plotted against the G content in the complete single DNA strand. The vertical axis represents the composition of the four nucleotides; the hori- zontal axis represents the G content in the complete single DNA strand. This figure has been presented in Natural Science 2; 2010 and is reproduced with permission. plotted against the total nucleotide content among vari- ous species, linear regression lines with high regression coefficients are obtained: Using the normalized values, G + C + A + T = 1, Chargaff’s parity rule is alternated as follows: 2G + 2A = 1, A = 0.5 – G, T = 0.5 – G, C = G and (G = G). The lines G and C overlap and the lines A and T overlap, and the former is line symmetrical to the latter against a line (y = 0.25), as shown in Figure 8. Namely, four nucleotide contents expressing by two du- plicate nucleotide contents can be expressed by only one nucleotide content with linear formulae, as shown in Figure 8. The two duplicate nucleotide contents (G or C and A or T) are symmetrical. These formulae do not possess any obvious factor that is based on “Natural Se- lection” proposed by Charles Darwin. This fact clearly indicates that “Natural Selection” might contribute to biological evolution after genome alterations. According to Chargaff’s second parity rule, the intercepts of the 0.5 0.5 0.25 0.25 0 Nucleotide Content Nucleotide Contents Figure 8. The “Diagonal Genome Universe”. Plotting four nucleotide contents normalized to 1 against certain nucleotide content (i.e., G or C content), G and G contents are expressed by (G = G) and (G = C), respectively, and T and A contents are expressed by (T = 0.5 – G) and (A = 0.5 – G), respectively. For example, if G = 0.1 (white dashed line), C = 0.1, T = 0.4 and A = 0.4. White open square, A or T; yellow closed square, C or G. White dotted line represents the line of symmetry (y = 0.25). Similarly, plotting nucleotide contents against T of A content, (T = T), (T = A), (C = 0.5 – T or A) and (G = 0.5 – T or A) are obtained. lines G and C are close to the origin, while those of the lines A and T are close to 0.5 at the vertical and horizon- tal axes. The slopes of the lines G and C, and those of A and T are 1 and –1, respectively. All organisms from bacteria to Homo sapiens are located on the diagonal lines of a 0.5 square—the “Diagonal Genome Universe”, using the normalized values. These formulae are not obtained from a simulation analysis using a random choice of nucleotide contents assumed to be organism nucleotide contents [45]. In this case, the nucleotide re- lationships are completely heteroskedastic and Chargaff’s second parity rule has not been satisfied. The line A over- laps with the line T, and the line G overlaps with the line C [47]. The former overlapped line intersects with the latter overlapped line at 0.25 [47]. Thus, the exchanges of G and C or A and T never take place, while the ex- changes of G or C with T or A must take place synchro- nously, not only within the putative small unit, but also over the entire genome according to Chargaff’s second parity rule. The pair of two duplicate points, G = C and A = T, are symmetrical around y = 0.25, as shown in Figure 8. As a result of the synchronous nucleotide al- terations over the genome, the structure of the genome has become homogeneous. Samples that are applicable to Chargaff’s parity rules must satisfy these conditions. Thus, all nucleotide alterations are strictly controlled, not only by the total homo-nucleotide contents and their  K. Sorimachi / Natural Science 2 (2010) 1104-1112 Copyright © 2010 SciRes. OPEN ACCESS 1110 analog contents, but also by the total hetero-nucleotide and their analog contents, in the complete single DNA strand under Chargaff’s second parity rule [28]. In ani- mal mitochondrial evolution, which deviates from the rule, nucleotide alterations are strictly controlled by just homo-nucleotides and their analog total contents [28]. 7. ORIGIN OF LIFE Four nucleotide relationships within the coding or non-coding regions are linear; however, Chargaff’s sec- ond parity rule is not satisfied [6]. On the other hand, when plotting nucleotide contents in the coding or non- coding regions against the nucleotide content in a com- plete single DNA strand, their relationships are expre- ssed by linear regression lines with high regression coef- ficients in nuclear, chloroplast and plant mitochondrial DNA [27]. Furthermore, Chargaff’s second parity rule is satisfied in both coding and non-coding regions of these DNA strands [28]. In animal mitochondrial DNA, strong regulation is observed in homo- and their analog nucleo- tide relationships in both coding and non-coding regions [27,28]. Mitchell and Bridge reported that the four nu- cleotide relationships in organelle DNA were heteroske- dastic [5], while Nikolaou and Almirantis reported that mitochondria should be classified into three groups, and that chloroplast genome evolution resembled bacterial genome evolution [48]. It has been shown that classifi- cation of organelles into chloroplast, plant mitochondria, vertebrate mitochondria, invertebrate I mitochondria and invertebrate II mitochondria, makes it possible to ex- press their genome evolution by linear formulae [47]. Thus, in respect to complete genome evolution, it is clear that all nucleotide alterations are expressed by lin- ear formulae: y = ax + b, where “y” and “x” represent nucleotide contents, and “a” and “b” are constant values representing alteration rates and initial nucleotide con- tents, respectively. When evolutionary processes are expressed by the same regression line, these evolutionary processes must be controlled by the same rule. Therefore, the fact that two linear regression lines intersect at the top of the “V-shape” indicates that the two groups diverged from the same single origin (Figure 9(a)). Classifying inver- tebrate mitochondria into two groups, I and II, two linear regression lines based on nucleotide relationships inter- sect forming the “V-shape” [47]. Furthermore, as mito- chondria and chloroplast are derived from proteobacteria [49] and cyanobacteria [50], respectively, their regres- sion lines intersected at a point [47]. As the origin of these organelles appears to be from bacteria, their re- gression lines must intersect at a point [47]. The fact that many lines intersect at the same point indicate that many groups diverged from a single origin (Figure 9(b)). On ● ●● ● ● ● ● ● ● ● a c b d e ●● ●● ● ● Figure 9. Assumed numbers(s) of origin of life based on nu- cleotide regression lines. (a) and (b), single origin of life; (c), (d) and (e), multiple origins of life. Closed circles represent the origin of life. 0.35 0.30 0.25 0.20 0.15 0.10 0.05 0.00 G Conten C Content 0.00 0.05 0.10 0.15 0.20 0.25 0.30 0.35 Figure 10. C content (horizontal axis) and G content (vertical axis) in nuclei and various organelles. Blue diamonds, inverte- brate I and vertebrate mitochondria; pink diamonds, inverte- brate II mitochondria; red squares, plant mitochondria; green triangles, chloroplasts; and black squares, nuclei. This figure has been presented in Natural Science, 2(5); 519-525, 2010 and reproduced with permission. the other hand, many parallel regression lines indicate that there are many origins (Figure 9(c)), and the exis- tence of many crossing points (Figure 9(d)) also indi- cates the existence of many origins. However, when all evolutionary processes obey the same rule, the number of origins cannot be determined (Figure 9(e)). When plotting nucleotide contents against each individual nu- cleotide content, linear regression lines intersect at a single point among nuclear, chloroplast and mitochon- drial DNA [47], as shown in Figure 10. This fact clearly indicates that the origin of all species is a single life form [47]. This is the first demonstration that all species  K. Sorimachi / Natural Science 2 (2010) 1104-1112 Copyright © 2010 SciRes. OPEN ACCESS 1111 have a common ancestor and a single origin based on scientific data. Charles Darwin discussed on the evolu- tion over the course of generation through a presence of natural selection in “On the Origin of Species by Means of Natural Selection or the Preservation of Favoured Races”, while he discussed on neither “a single origin” nor “a common ancestor” of species. This concept has been presumed from Darwin’s theory since being pub- lished in 1859, and eventually phylogenetic trees, which have been drawn, represent apparently a single origin of species. 8. CONCLUSIONS Evolution of all species, from bacteria to Homo sapiens, is governed by genome alterations based on simple lin- ear formulae, including Chargaff’s second parity rule, although their phenotypic expressions show immeasur- able spectra over the past 3.5 billion years. Evolution based on genome alterations can be represented by two lines (G or C and A or T) that are symmetrical about y = 0.25 – the “Diagonal Genome Universe”. 9. ACKNOWLEDGEMENT The author expresses his great thanks to Prof. Kuo-Chen Chou, Edi- tor-in-Chief of Natural Science, for the opportunity to present this mini-review. REFERENCES [1] Avery, O.T., Macleod, C.M. and McCarty, M. (1944) Studies on the chemical nature of the substance inducing transformation of pneumococcal types: Induction of trans- formation isolated from pneumococcus type III. Journal of Experimental Medicine, 79(2), 137-158. [2] Chargaff, E. (1950) Chemical specificity of nucleic acids and mechanism of their enzymatic degradation. Experi- mentia, 6(6), 201-209. [3] Rudner, R., Karkas, J.D. and Chargaff, E. (1968) Separa- tion of B. subtilis DNA into complementary strands. 3. Direct analysis. Proceedings of the National Academy of Science, 60(3), 921-922. [4] Watson, J.D. and Crick, F.H.C. (1953) Genetical implica- tions of the structure of deoxyribonucleic acid. Nature, 171(4361), 964-967. [5] Mitchell, D. and Bridge, R. (2006) A test of Chargaff’s second rule. Biochemical and Biophysical Research Com- munications, 340(1), 90-94. [6] Sorimachi, K. and Okayasu, T. (2008) Codon evolution is governed by linear formulas. Amino Acids, 34(4), 661- 668. [7] Zuckerkandl, E. and Pauling, L.B. (1962) Molecular di- sease, evolution, and genetic heterogeneity. In: Kasha, M. and Pullman, B. Ed., Horizons in Biochemistry, New York Academic, New York, 189-225. [8] Dayhoff, M.O., Park, C.M. and McLaughlin, P.J. (1977) Building a phylogenetic trees: Cytochrome C. In: Day- hoff, M.O. Ed., Atlas of protein sequence and structure, National Biomedical Foundation, Washington, D.C., 5, 7-16. [9] Sogin, M.L., Elwood, H.J. and Gunderson, J.H. (1986) Evolutionary diversity of eukaryotic small subunit rRNA genes. Proceedings of the National Academy of Sciences, 83(5), 1383-1387. [10] DePouplana, L., Turner, R.J., Steer, B.A. and Schimmel, P. (1998) Genetic code origins: tRNAs older than their synthetases? Proceedings of the National Academy of Sciences, 95(19), 11295-11300. [11] Doolittle, W.F. and Brown, J.R. (1994) Tempo, mode, the progenote, and the universal root. Proceedings of the Na- tional Academy of Sciences, 91(15), 6721-6728. [12] Maizels, N. and Weiner, A.M. (1994) Phylogeny from function: Evidence from the molecular fossil record that tRNA originated in replication, not translation. Proceed- ings of the National Academy of Sciences, 91(15), 6729- 6734. [13] Sorimachi, K. (2009) Evolution from primitive life to Homo sapiens based on visible genome structures: The amino acid world. Natural Science, 1(2), 107-119. [14] Chou, K.-C. and Zhang, C.T. (1992) Diagrammatization of codon usage in 339 HIV proteins and its biological implication. AIDS Research and Human Retroviruses, 8(12), 1967-1976. [15] Zhang, C.-T. and Chou, K.-C. (1993) Graphic analysis of codon usage strategy in1490 human proteins. Journal of Protein Chemistry, 12(3), 329-335. [16] Qi, X.Q., Wen, J. and Qi, Z.H. (2007) New 3D graphical representation of DNA sequence based on dual nucleo- tides. Journal of Theoretical Biology, 249(4), 681-690. [17] Miller, S.L. (1953) Production of amino acids under pos- sible primitive earth conditions. Science, 117(3046), 528- 529. [18] Kvenvolden, K., Lawless, J., Pering, K., Peterson, E., Flores, J., Ponnamperuma, C., Kaplan, I.R. and Moore, C. (1970) Evidence for extraterrestrial amino-acids and hy- drocarbons in the Murchison meteorite. Nature, 228(52 75), 923-926. [19] Wolman, Y., Haverland, W. and Miller, S.L. (1972) Non- protein amino acids from spark discharges and their com- parison with the Muchison meteorite amino acids. Pro- ceedings of the National Academy of Sciences, 69(4), 809-811. [20] Lahav, N., White, D. and Chang, S. (1978) Peptide for- mation in the prebiotic era: Thermal condensation of gly- cine in fluctuating clay environments. Science, 201(4350), 67-69. [21] Sueoka, N. (1961) Correlation between base composition of deoxyribonucleic acid and amino acid composition in proteins. Proceedings of the National Academy of Sci- ences, 47(8), 1141-1149. [22] Sorimachi, K. (1999) Evolutionary changes reflected by the cellular amino acid composition. Amino Acids, 17(2), 207-226. [23] Sorimachi, K., Okayasu, T., Akimoto, K. and Niwa, A. (2000) Conservation of the basic pattern of cellular ami- no acid composition during biological evolution in plants. Amino Acids, 18(2), 193-196. [24] Sorimachi, K., Itoh, T., Kawarabayasi, Y., Okayasu, T.,  K. Sorimachi / Natural Science 2 (2010) 1104-1112 Copyright © 2010 SciRes. OPEN ACCESS 1112 Akimoto, K. and Niwa, A. (2001) Conservation of the basic pattern of cellular amino acid composition during biological evolution and the putative amino acid compo- sition of primitive life forms. Amino Acids, 21(4), 393- 399. [25] Gilbert, W.R. (1986) The RNA world. Nature, 319, 618. [26] Sorimachi, K. and Okayasu, T. (2007) Mathematical proof of the chronological precedence of protein formation over codon formation. Current Topics of Peptide and Protein Research, 8, 25-34. [27] Sorimachi, K. and Okayasu, T. (2008) Universal rules governing genome evolution expressed by linear formu- las. The Open Genomics Journal, 1(11), 33-43. [28] Sorimachi, K. (2010) Codon evolution in doublestra- nded organelle DNA: Strong regulation of homo-nucleo- tides and their analog alternations. Natural Science, 2(8), 846-854. [29] Sanger, F. and Coulson, A.R. (1975) A rapid method for determing sequences in DNA by primed synthesis with DNA polymerase. Journal of Molecular Biology, 94(3), 441-446. [30] Maxam, A.M. and Gilbert, W. (1977) A new method for sequencing DNA. Proceedings of the National Academy of Sciences, 74(2), 560-564. [31] Fleischmann, R.D., Adams, M.D., White, O., Clayton, R. A., Kirkness, E.F., Kerlavage, A.R., et al. (1995) Whole- genome random sequencing and assembly of Haemophi- lus influenzae Rd. Science, 269(5223), 496-512. [32] Lander, E.S., Linton, M.L., Birren, B., Nusbaum, C., Zody, M.C., Baldwin, J., et al. (2001) Initial sequencing and analysis of the human genome. Nature, 409(6822), 860-921. [33] Venter, J.C., Adams, M.D., Myers, E.W., Li, P.W., Mural, R.J., Sutton, G.G., Smith, H.O., Yandell, M., Evans, C.A., Holt, R.A., et al. (2001) The sequence of the human ge- nome. Science, 291(5507), 1304-1351. [34] Waterston, R.H., Lindblad-Toh, K., Birney, E., Rogers, J., Abril, J.F., Agarwal, P., et al. (2002) Initial sequencing and comparative analysis of the mouse genome. Nature, 420(6915), 520-562. [35] Gibbs, R.A., Weinstock, G.M., Metzker M.L., Muzny, D. M., Sondergren, E.J., Scherer, S., et al. (2004) Genome sequence of the Brown Norway rat yield insights into mammalian evolution. Nature, 428(6982), 493-521. [36] Sodergren, E., Weinstock, G.M., Davidson, E.H., Cam- eron, R.A., Gibbs, R.A., Angerer, L.M., et al. (2006) The genome of the sea urchin Strongylocentrotus purpuratus. Science, 314(5801), 941-952. [37] Sorimachi, K. and Okayasu, T. (2003) Gene assembly consisting of small units with similar amino acid compo- sition in the Saccharomyces cerevisiae genome. Myco- science, 44(5), 415-417. [38] Kawai, J. (2001) Functional annotation of a full-length mouse cDNA collection. Nature, 409(682), 685-690. [39] Smith, D.R., Doucette-Stamm, L.A., Deloughery, C., Lee, H., Dubois, J., Aldredge, T., et al. (1997) Complete ge- nome sequence of Methanobacterium thermoautotrophi- cum delta H: Functional analysis and comparative ge- nomics. Journal Bacteriology, 179(22), 7135-7155. [40] Sorimachi, K. and Okayasu, T. (2004) An evolutionary theories based on genomic structures in Saccharomyces cerevisiae and Enchephalitozoon cuniculi. Mycoscience, 45(5), 345-350. [41] Sorimachi, K. and Okayasu, T. (2004) Classification of eubacteria based on their complete genome: Where does Mycoplasmataceae belong? Proceedings of the Royal So- ciety of London. B (Supplement.), 271(4), S127-S130. [42] Okayasu, T. and Sorimachi, K. (2008) Organisms can essentially be classified according to two codon patterns. Amino Acids, 36(2), 261-271. [43] Sueoka, N. (1988) Directional mutation pressure and neutral molecular evolution. Proceedings of the National Academy of Sciences, 85(8), 2653-2657. [44] Qi, Z.H., Wang, J.M. and Qi, X.Q. (2009) Classification analysis of dual nucleotides using dimension reduction. Journal of Theoretical Biology, 260(1), 104-109. [45] Ebara, Y., Koge, T. and Sorimachi, K. (2010) Evaluation of Chargaff’s parity rules using simulation analysis. Dokkyo Journal of Medical Sciences, 37(2), 139-142. [46] Sorimachi, K. (2009) A proposed solution to the historic puzzle of Chargaff’s second parity rule. The Open Ge- nomics Journal, 2(3), 12-14. [47] Sorimachi, K. (2010) Genomic data provides simple evi- dence for a single origin of life. Natural Science, 2(5), 519-525. [48] Nikolaou, C. and Almirantis, Y. (2006) Deviations from Chargaff’s second parity rule in organelle DNA insights into the evolution of organelle genomes. Gene, 381, 34- 41. [49] Gray, M.W., Burger, G., Lang, B.F. (1999) Mitochondrial evolution. Science, 283(5407), 1476-1481. [50] Raven, J.A. and Allen, J.F. (2003) Genomics and chloro- plast evolution: What did cyanobacteria do for plants? Genome Biology, 4(3), 209-215.
|