Paper Menu >>
Journal Menu >>
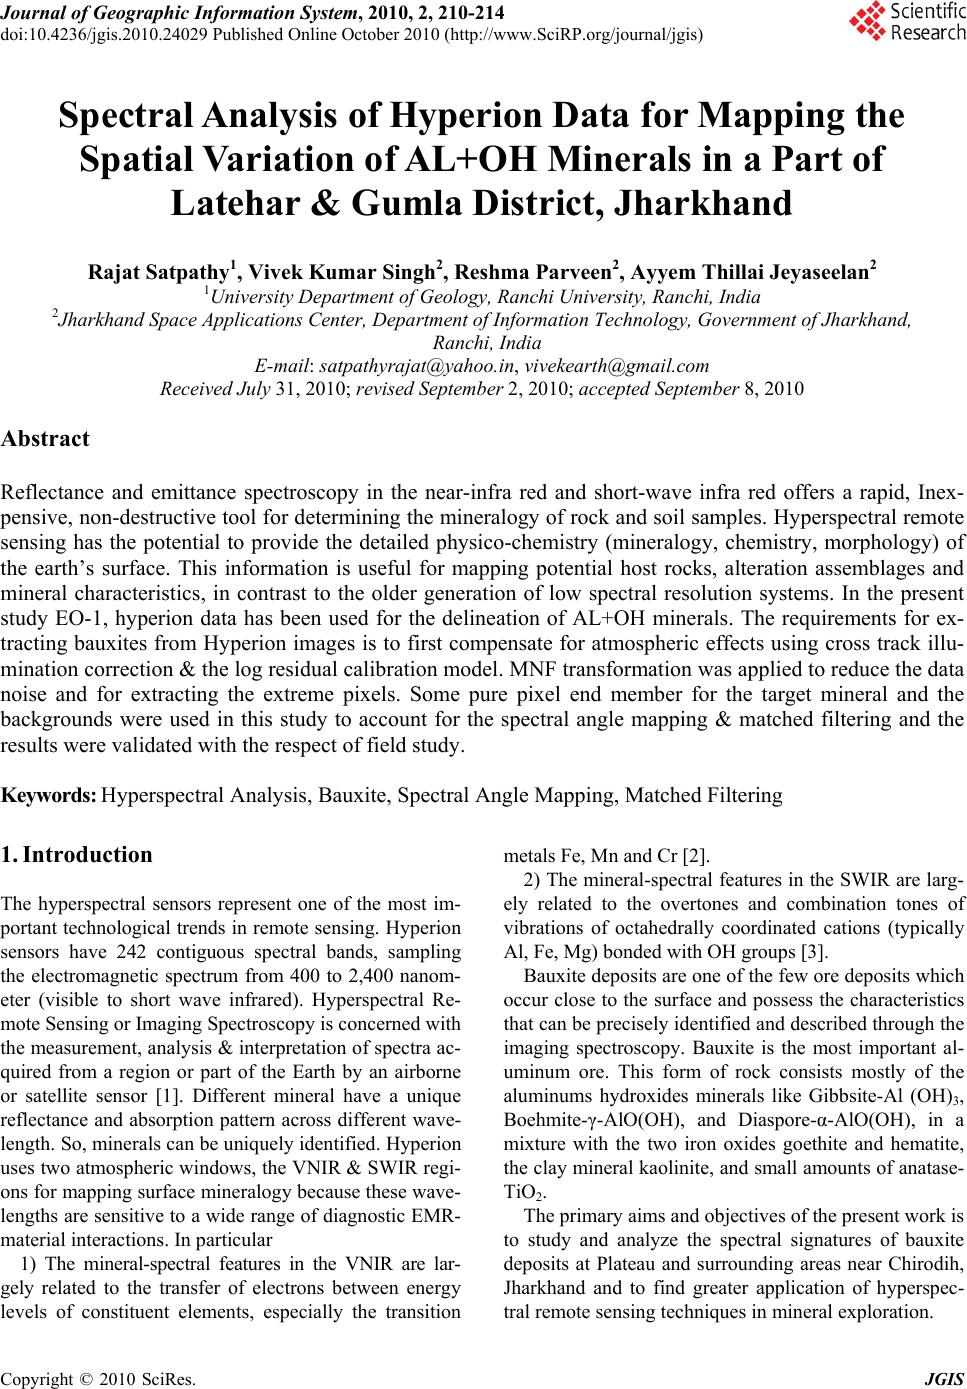 Journal of Geographic Information System, 2010, 2, 210-214 doi:10.4236/jgis.2010.24029 Published Online October 2010 (http://www.SciRP.org/journal/jgis) Copyright © 2010 SciRes. JGIS Spectral Analysis of Hyperion Data for Mapping the Spatial Variation of AL+OH Minerals in a Part of Latehar & Gumla District, Jharkhand Rajat Satpathy1, Vivek Kumar Singh2, Reshma Parveen2, Ayyem Thillai Jeyaseelan2 1University Department of Geology, Ranchi University, Ranchi, India 2Jharkhand Space Applications Center, Department of Information Technology, Government of Jharkhand, Ranchi, India E-mail: satpathyrajat@yahoo.in, vivekearth@gmail.com Received July 31, 2010; revised September 2, 2010; accepted September 8, 2010 Abstract Reflectance and emittance spectroscopy in the near-infra red and short-wave infra red offers a rapid, Inex- pensive, non-destructive tool for determining the mineralogy of rock and soil samples. Hyperspectral remote sensing has the potential to provide the detailed physico-chemistry (mineralogy, chemistry, morphology) of the earth’s surface. This information is useful for mapping potential host rocks, alteration assemblages and mineral characteristics, in contrast to the older generation of low spectral resolution systems. In the present study EO-1, hyperion data has been used for the delineation of AL+OH minerals. The requirements for ex- tracting bauxites from Hyperion images is to first compensate for atmospheric effects using cross track illu- mination correction & the log residual calibration model. MNF transformation was applied to reduce the data noise and for extracting the extreme pixels. Some pure pixel end member for the target mineral and the backgrounds were used in this study to account for the spectral angle mapping & matched filtering and the results were validated with the respect of field study. Keywords: Hyperspectral Analysis, Bauxite, Spectral Angle Mapping, Matched Filtering 1. Introduction The hyperspectral sensors represent one of the most im- portant technological trends in remote sensing. Hyperion sensors have 242 contiguous spectral bands, sampling the electromagnetic spectrum from 400 to 2,400 nanom- eter (visible to short wave infrared). Hyperspectral Re- mote Sensing or Imaging Spectroscopy is concerned with the measurement, analysis & interpretation of spectra ac- quired from a region or part of the Earth by an airborne or satellite sensor [1]. Different mineral have a unique reflectance and absorption pattern across different wave- length. So, minerals can be uniquely identified. Hyperion uses two atmospheric windows, the VNIR & SWIR regi- ons for mapping surface mineralogy because these wave- lengths are sensitive to a wide range of diagnostic EMR- material interactions. In particular 1) The mineral-spectral features in the VNIR are lar- gely related to the transfer of electrons between energy levels of constituent elements, especially the transition metals Fe, Mn and Cr [2]. 2) The mineral-spectral features in the SWIR are larg- ely related to the overtones and combination tones of vibrations of octahedrally coordinated cations (typically Al, Fe, Mg) bonded with OH groups [3]. Bauxite deposits are one of the few ore deposits which occur close to the surface and possess the characteristics that can be precisely identified and described through the imaging spectroscopy. Bauxite is the most important al- uminum ore. This form of rock consists mostly of the aluminums hydroxides minerals like Gibbsite-Al (OH)3, Boehmite-γ-AlO(OH), and Diaspore-α-AlO(OH), in a mixture with the two iron oxides goethite and hematite, the clay mineral kaolinite, and small amounts of anatase- TiO2. The primary aims and objectives of the present work is to study and analyze the spectral signatures of bauxite deposits at Plateau and surrounding areas near Chirodih, Jharkhand and to find greater application of hyperspec- tral remote sensing techniques in mineral exploration. 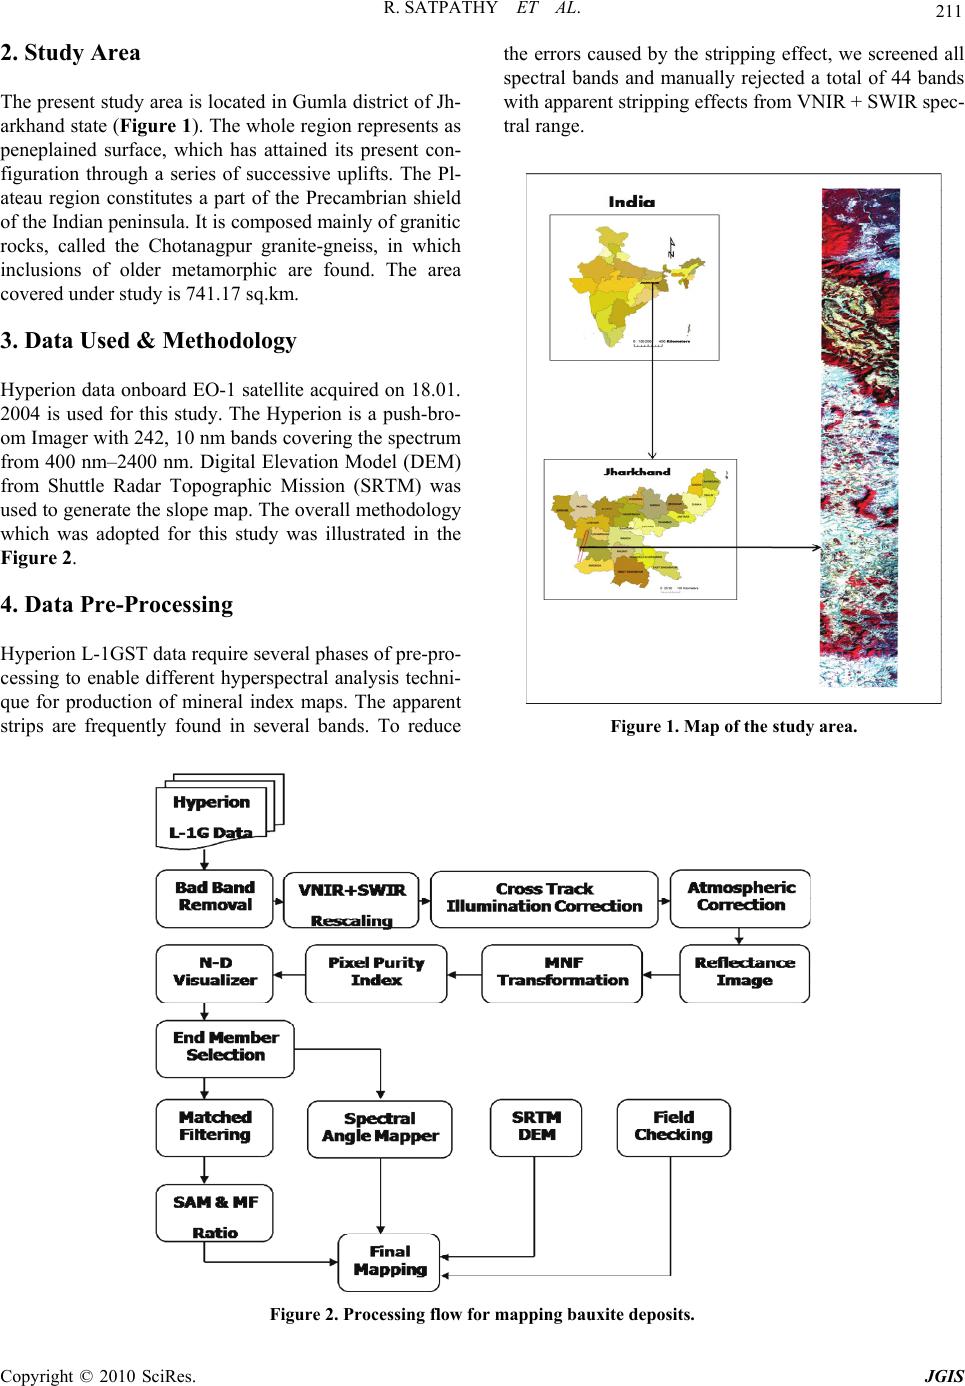 R. SATPATHY ET AL. Copyright © 2010 SciRes. JGIS 211 2. Study Area The present study area is located in Gumla district of Jh- arkhand state (Figure 1). The whole region represents as peneplained surface, which has attained its present con- figuration through a series of successive uplifts. The Pl- ateau region constitutes a part of the Precambrian shield of the Indian peninsula. It is composed mainly of granitic rocks, called the Chotanagpur granite-gneiss, in which inclusions of older metamorphic are found. The area covered under study is 741.17 sq.km. 3. Data Used & Methodology Hyperion data onboard EO-1 satellite acquired on 18.01. 2004 is used for this study. The Hyperion is a push-bro- om Imager with 242, 10 nm bands covering the spectrum from 400 nm–2400 nm. Digital Elevation Model (DEM) from Shuttle Radar Topographic Mission (SRTM) was used to generate the slope map. The overall methodology which was adopted for this study was illustrated in the Figure 2. 4. Data Pre-Processing Hyperion L-1GST data require several phases of pre-pro- cessing to enable different hyperspectral analysis techni- que for production of mineral index maps. The apparent strips are frequently found in several bands. To reduce the errors caused by the stripping effect, we screened all spectral bands and manually rejected a total of 44 bands with apparent stripping effects from VNIR + SWIR spec- tral range. Figure 1. Map of the study area. Figure 2. Processing flow for mapping bauxite deposits.  R. SATPATHY ET AL. Copyright © 2010 SciRes. JGIS 212 4.1. Rescaling The L1G digital values represent absolute radiance values stored as 16-bit signed integer. To get the at sensor radia- nce value, the data must be rescaled. The scaling factor is 40 for VNIR bands and 80 for SWIR bands [4]. 4.2. Cross-Track Illumination Corrections Cross-Track Illumination Correction is used to remove variation in the cross-track illumination of an image [5]. Cross track illumination variations (Figure 3) may be due to vignetting effects, instrument scanning, or other non-uniform illumination effects. A polynomial function is fit to the means and used to remove the variation. 4.3. Atmospheric Correction Hyperion data carry the influence of a number of exter- nal factors, which mask the fine spectral features of gro- und objects. These factors are – 1) Effects of the solar ir- radiance curve, 2) Atmosphere and topography. The effect of the solar irradiance curve arises from the fact that solar radiation intensity peaks at 0.48 µm and the radiation intensity drops off towards longer wavelengths, therefore the effects of solar irradiance is not uniform throughout the image. Atmospheric effects arise due to the fact that the Hyperion image data are collected over a wide wavelength range, which includes atmospheric windows as well as atmospheric absorption and scatter- ing. Topographic effects arise due to local landscape orientation. These above factors must be adequately normalized in order to compute ground reflectance val- ues in different channels. In this study ENVI based Log Residuals calibration algorithm is used to convert the radiance values to reflec- tance and remove the atmospheric artifacts. This algo- rithm is designed to remove solar irradiance, atmospheric transmittance, instrument gain, topographic effects, and albedo effects from radiance data. This transform creates a pseudo reflectance image that is useful for analyzing mineral-related absorption features. Log residuals calibr- ation is use in-scene statistics to produce a reflectance image. The logarithmic residuals of a dataset are defined as the input spectrum divided by the spectral geometric mean, then divided by the spatial geometric mean [5]. The geometric mean is used because the transmittance and other effects are considered multiplicative; it is cal- culated using logarithms of the data values. The spectral mean is the mean of all bands for each pixel and removes topographic effects. The spatial mean is the mean of all pixels for each band and accounts for the solar irradiance, atmospheric transmittance, and instrument gain. By this way the atmospheric artifacts were removed from the Hyperion datasets and radiance values were converted to round surface reflectance. 5. Hyperspectral Analysis The following procedures of hyperspectral analysis were employed, including the Minimum Noise Fraction (MNF) transformation for reducing spectral data, the Pixel Pu- rity Index (PPI) for identifying those extreme or spectra- lly pure pixels, and the n-Dimensional Visualizer for de- termining the endmember directly from the image. The approach of SAM was then employed to identify the bau- xite deposits. Finally, the Matched filtering technique is used to target the bauxite deposits. 5.1. MNF Transformation MNF transformation determines the inherent dimension- ality of image data, to segregate noise in the data, and to reduce the computational requirements for subsequent processing. This is a two step process. The first step re- sults in transformed data in which the noise has unit variance and no band-to-band correlations. The second step is a standard Principal Components transformation of the noise-whitened data. 5.2. Pixel Purity Index Pixel purity index (PPI) is a means to determine automa- tically the relative purity of the pixels from the higher or- der MNF eigen images using the convex geometry arg- ument [6]. By repeatedly projecting n-dimensional scat- ter plots of the MNF images onto a random unit vector, a PPI image is formed in which the digital number (DN) of each pixel corresponds to the total number of times that the pixel was judged as ‘‘extreme’’ (i.e., falling onto the ends of the unit vector) in all projections. Figure 3. Cross track illumination correction samples. 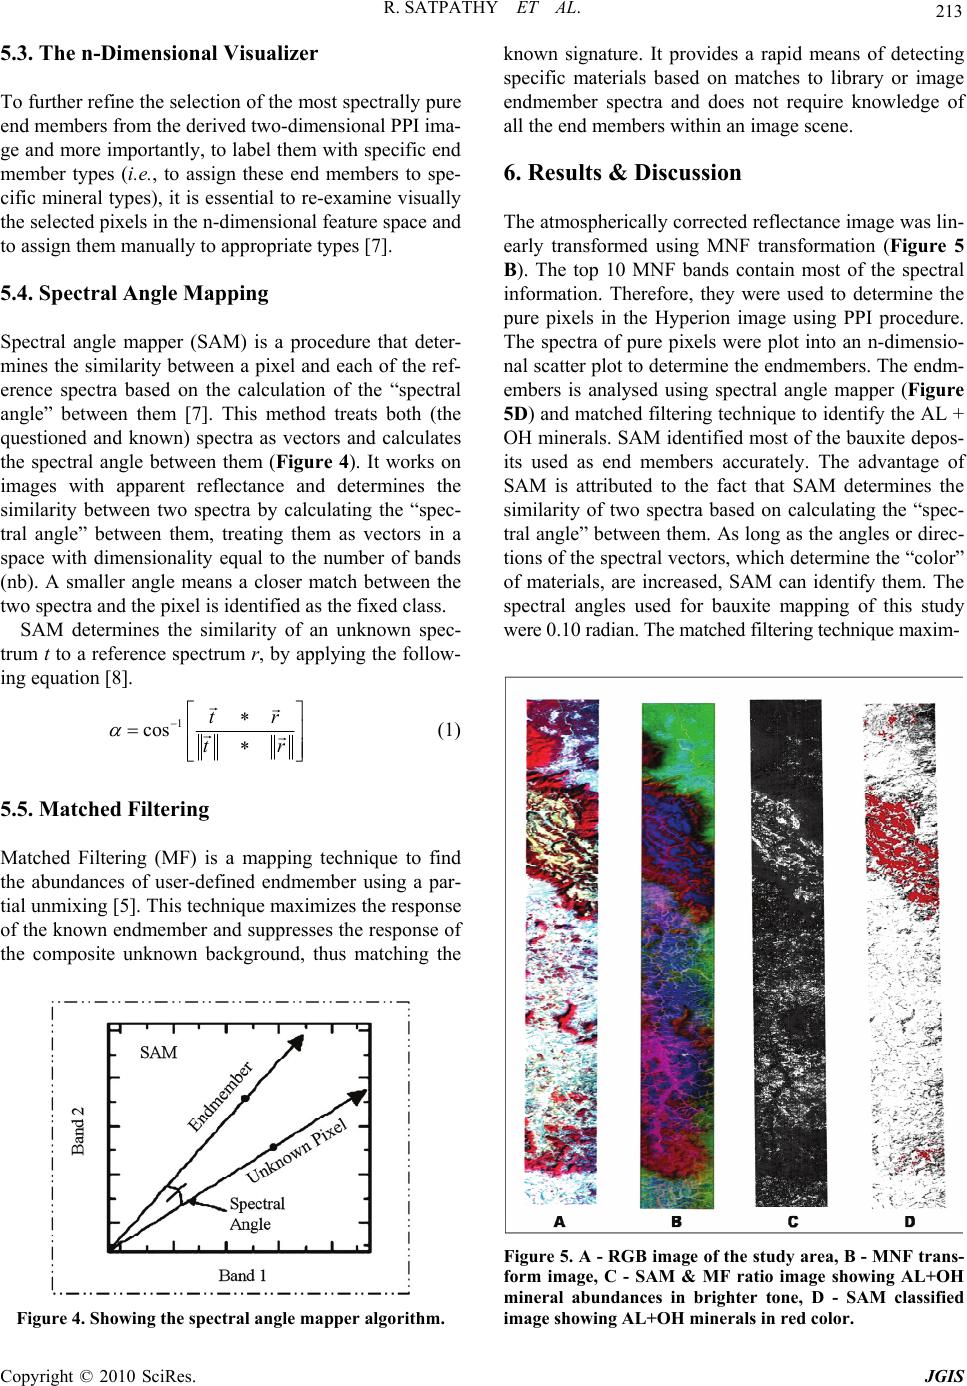 R. SATPATHY ET AL. Copyright © 2010 SciRes. JGIS 213 5.3. The n-Dimensional Visualizer To further refine the selection of the most spectrally pure end members from the derived two-dimensional PPI ima- ge and more importantly, to label them with specific end member types (i.e., to assign these end members to spe- cific mineral types), it is essential to re-examine visually the selected pixels in the n-dimensional feature space and to assign them manually to appropriate types [7]. 5.4. Spectral Angle Mapping Spectral angle mapper (SAM) is a procedure that deter- mines the similarity between a pixel and each of the ref- erence spectra based on the calculation of the “spectral angle” between them [7]. This method treats both (the questioned and known) spectra as vectors and calculates the spectral angle between them (Figure 4). It works on images with apparent reflectance and determines the similarity between two spectra by calculating the “spec- tral angle” between them, treating them as vectors in a space with dimensionality equal to the number of bands (nb). A smaller angle means a closer match between the two spectra and the pixel is identified as the fixed class. SAM determines the similarity of an unknown spec- trum t to a reference spectrum r, by applying the follow- ing equation [8]. 1 cos tr tr (1) 5.5. Matched Filtering Matched Filtering (MF) is a mapping technique to find the abundances of user-defined endmember using a par- tial unmixing [5]. This technique maximizes the response of the known endmember and suppresses the response of the composite unknown background, thus matching the Figure 4. Showing the spectral angle mapper algorithm. known signature. It provides a rapid means of detecting specific materials based on matches to library or image endmember spectra and does not require knowledge of all the end members within an image scene. 6. Results & Discussion The atmospherically corrected reflectance image was lin- early transformed using MNF transformation (Figure 5 B). The top 10 MNF bands contain most of the spectral information. Therefore, they were used to determine the pure pixels in the Hyperion image using PPI procedure. The spectra of pure pixels were plot into an n-dimensio- nal scatter plot to determine the endmembers. The endm- embers is analysed using spectral angle mapper (Figure 5D) and matched filtering technique to identify the AL + OH minerals. SAM identified most of the bauxite depos- its used as end members accurately. The advantage of SAM is attributed to the fact that SAM determines the similarity of two spectra based on calculating the “spec- tral angle” between them. As long as the angles or direc- tions of the spectral vectors, which determine the “color” of materials, are increased, SAM can identify them. The spectral angles used for bauxite mapping of this study were 0.10 radian. The matched filtering technique maxim- Figure 5. A - RGB image of the study area, B - MNF trans- form image, C - SAM & MF ratio image showing AL+OH mineral abundances in brighter tone, D - SAM classified image showing AL+OH minerals in red color. 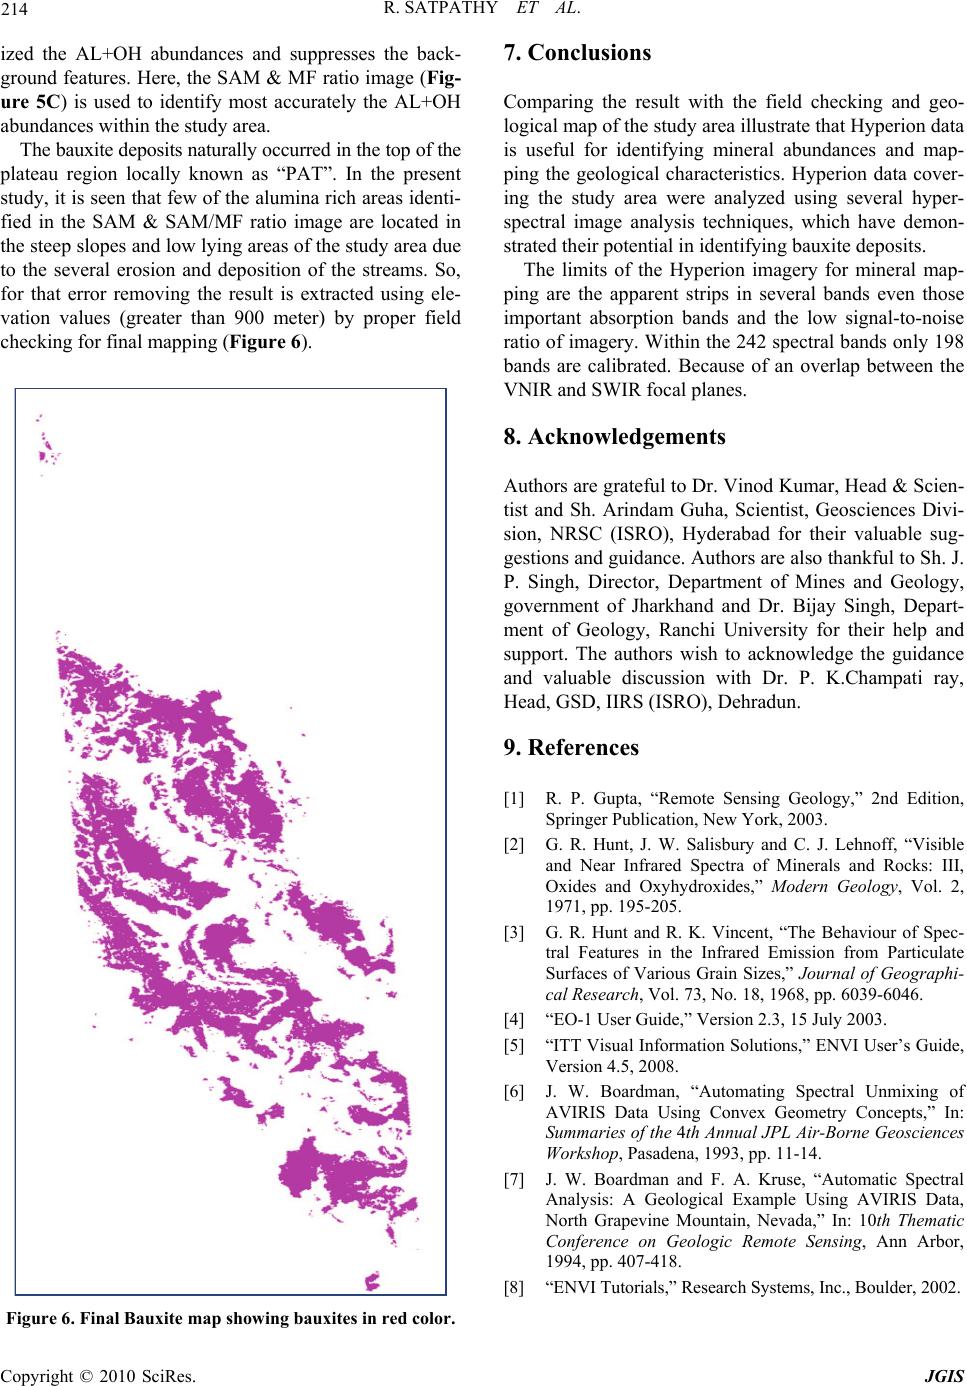 R. SATPATHY ET AL. Copyright © 2010 SciRes. JGIS 214 ized the AL+OH abundances and suppresses the back- ground features. Here, the SAM & MF ratio image (Fig- ure 5C) is used to identify most accurately the AL+OH abundances within the study area. The bauxite deposits naturally occurred in the top of the plateau region locally known as “PAT”. In the present study, it is seen that few of the alumina rich areas identi- fied in the SAM & SAM/MF ratio image are located in the steep slopes and low lying areas of the study area due to the several erosion and deposition of the streams. So, for that error removing the result is extracted using ele- vation values (greater than 900 meter) by proper field checking for final mapping (Figure 6). Figure 6. Final Bauxite map showing bauxites in red color. 7. Conclusions Comparing the result with the field checking and geo- logical map of the study area illustrate that Hyperion data is useful for identifying mineral abundances and map- ping the geological characteristics. Hyperion data cover- ing the study area were analyzed using several hyper- spectral image analysis techniques, which have demon- strated their potential in identifying bauxite deposits. The limits of the Hyperion imagery for mineral map- ping are the apparent strips in several bands even those important absorption bands and the low signal-to-noise ratio of imagery. Within the 242 spectral bands only 198 bands are calibrated. Because of an overlap between the VNIR and SWIR focal planes. 8. Acknowledgements Authors are grateful to Dr. Vinod Kumar, Head & Scien- tist and Sh. Arindam Guha, Scientist, Geosciences Divi- sion, NRSC (ISRO), Hyderabad for their valuable sug- gestions and guidance. Authors are also thankful to Sh. J. P. Singh, Director, Department of Mines and Geology, government of Jharkhand and Dr. Bijay Singh, Depart- ment of Geology, Ranchi University for their help and support. The authors wish to acknowledge the guidance and valuable discussion with Dr. P. K.Champati ray, Head, GSD, IIRS (ISRO), Dehradun. 9. References [1] R. P. Gupta, “Remote Sensing Geology,” 2nd Edition, Springer Publication, New York, 2003. [2] G. R. Hunt, J. W. Salisbury and C. J. Lehnoff, “Visible and Near Infrared Spectra of Minerals and Rocks: III, Oxides and Oxyhydroxides,” Modern Geology, Vol. 2, 1971, pp. 195-205. [3] G. R. Hunt and R. K. Vincent, “The Behaviour of Spec- tral Features in the Infrared Emission from Particulate Surfaces of Various Grain Sizes,” Journal of Geographi- cal Research, Vol. 73, No. 18, 1968, pp. 6039-6046. [4] “EO-1 User Guide,” Version 2.3, 15 July 2003. [5] “ITT Visual Information Solutions,” ENVI User’s Guide, Version 4.5, 2008. [6] J. W. Boardman, “Automating Spectral Unmixing of AVIRIS Data Using Convex Geometry Concepts,” In: Summaries of the 4th Annual JPL Air-Borne Geosciences Workshop, Pasadena, 1993, pp. 11-14. [7] J. W. Boardman and F. A. Kruse, “Automatic Spectral Analysis: A Geological Example Using AVIRIS Data, North Grapevine Mountain, Nevada,” In: 10th Thematic Conference on Geologic Remote Sensing, Ann Arbor, 1994, pp. 407-418. [8] “ENVI Tutorials,” Research Systems, Inc., Boulder, 2002. |