 J. Biomedical Science and Engineering, 2013, 6, 298-307 JBiSE http://dx.doi.org/10.4236/jbise.2013.63038 Published Online March 2013 (http://www.scirp.org/journal/jbise/) Segmentation and texture analysis with multimodel inference for the automatic detection of exudates in early diabetic retinopathy Jack Lee, Benny Zee*, Qing Li Division of Biostatistics, JC School of Public Health and Primary Care, The Chinese University of Hong Kong, Hong Kong, China Email: *bzee@cuhk.edu.hk Received 10 January 2013; revised 15 February 2013; accepted 2 March 2013 ABSTRACT Diabet ic retinopathy (DR) is an eye disease caused by the increase of insulin in blood and may cause blind- ness if not treated at an early stage. Exudates are the primary sign of DR. Currently there is no fully auto- mated method to detect exudates in the literature and it would be useful in large scale screening if fully automatic method is available. In this paper we devel- oped a novel method to detect exudates that based on interactions between texture analysis and segmen- tation with mathematical morphological technique by using multimodel inference. The texture analysis in- volves three components: they are statistical texture analysis, high order spectra analysis, and fractal analysis. The performance of the proposed method is assessed by the sensitivity, specificity and accuracy using the public data DIARETDB1. Our results show that the sensitivity, specificity and accuracy are 95.7%, 97.6% and 98.7% (SE = 0.01), respectively. It is shown that the proposed method can be run auto- matically and also improve the accuracy of exudates detection significantly over most of the previous me- thods. Keywords: Texture Analysis; Multimodel Inference; Morphological Technique; Exudates; Diabetic Retinopathy 1. INTRODUCTION Diabetic retinopathy is a severe and common eye disease which can be regarded as a manifestation of diabetes on the retina. It is a major public health problem and diabetic-related eye diseases are the commonest cause of vision defects and blindness in the world. The appea- rance of microaneurysms, hemorrhages and exudates represent to certain extent the degree of severity of the disease. Exudates are lipid leaks from blood vessels of abnormal retinas and are one of the most prevalent le- sions at the early stages of DR [1]. From visual in- spection, exudates appear to be yellowish or white color with varying sizes, shape and locations. Automatic exu- dates detection can assist ophthalmologists in the pre- vention and allowing the disease to be treated more efficiently. Many techniques have been employed to perform exudates detection. A complete comparative analysis of the most recent techniques is made on [2]. For these techniques, contextual information was used with Com- puter-aided detection systems. The context is based on the spatial relation with surrounding anatomical land- marks and similar lesions [3]. Fuzzy C-means clustering was incorporated with spatial neighbourhood information [4]. Mathematical morphologic methods have been used [5,6]. Neural Networks and Support-vector machines were used in [7]. Split-and-merge techniques, where re- gion candidates are detected using a combination of coarse and fine segmentation were used in [8]. An ap- proach based on Fisher’s linear discriminant analysis making use of color information was introduced in [9]. Naïve-Bayes and Support Vector Machines classifiers were employed in [10]. M. U. Akram et al. [11] proposed a technique that uses filter banks to extract the candidate regions for possible exudates. It also applied a Bayesian classifier as a combination of Gaussian functions to de- tect exudate and non-exudates regions. Among these techniques, as mentioned in [7], some of methods may incorrectly detect artifacts as exudates especially those appear to be like exudates, or only limit to work well in LUV color space with even illumination image, i.e., the accuracy is low for the case of uneven illumination image. Others may produce either high misclassified por- tion for images that do not contain exudates (low speci- ficity), or fails to detect faint exudates (low sensitivity). In order to improve the performance of exudates detection, we developed a method that based on the interactions between texture analysis and segmentation using morphological reconstruction. The texture analysis *Corresponding author. OPEN ACCESS 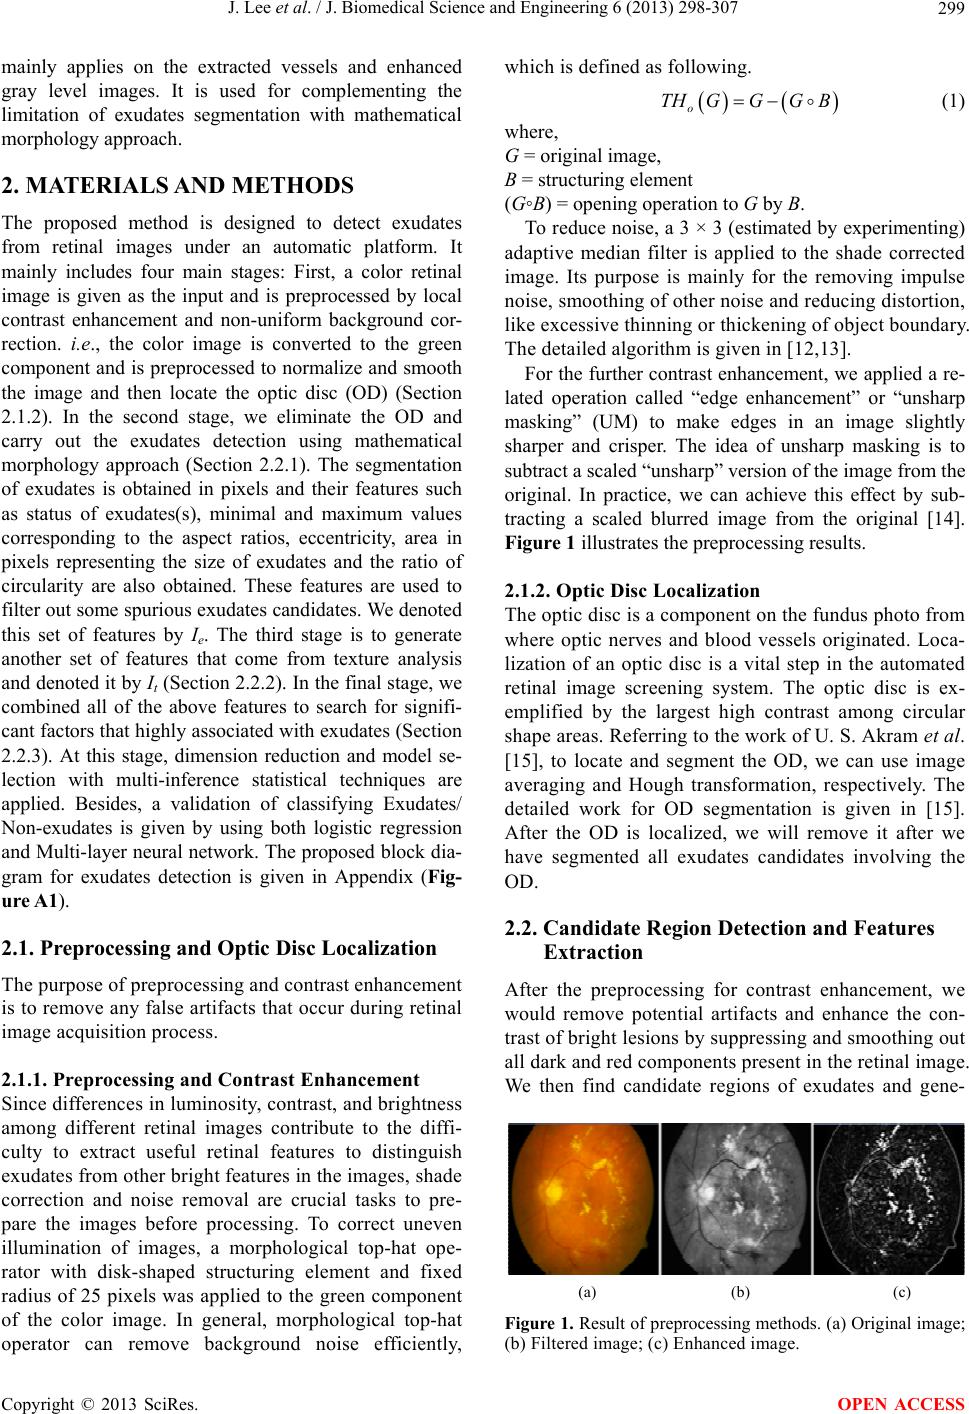 J. Lee et al. / J. Biomedical Science and Engineering 6 (2013) 298-307 299 mainly applies on the extracted vessels and enhanced gray level images. It is used for complementing the limitation of exudates segmentation with mathematical morphology approach. 2. MATERIALS AND METHODS The proposed method is designed to detect exudates from retinal images under an automatic platform. It mainly includes four main stages: First, a color retinal image is given as the input and is preprocessed by local contrast enhancement and non-uniform background cor- rection. i.e., the color image is converted to the green component and is preprocessed to normalize and smooth the image and then locate the optic disc (OD) (Section 2.1.2). In the second stage, we eliminate the OD and carry out the exudates detection using mathematical morphology approach (Section 2.2.1). The segmentation of exudates is obtained in pixels and their features such as status of exudates(s), minimal and maximum values corresponding to the aspect ratios, eccentricity, area in pixels representing the size of exudates and the ratio of circularity are also obtained. These features are used to filter out some spurious exudates candidates. We denoted this set of features by Ie. The third stage is to generate another set of features that come from texture analysis and denoted it by It (Section 2.2.2). In the final stage, we combined all of the above features to search for signifi- cant factors that highly associated with exudates (Section 2.2.3). At this stage, dimension reduction and model se- lection with multi-inference statistical techniques are applied. Besides, a validation of classifying Exudates/ Non-exudates is given by using both logistic regression and Multi-layer neural network. The proposed block dia- gram for exudates detection is given in Appendix (Fig- ure A1). 2.1. Preprocessing and Optic Disc Localization The purpose of preprocessing and contrast enhancement is to remove any false artifacts that occur during retinal image acquisition process. 2.1.1. Preprocessing and Contrast Enhancement Since differences in luminosity, contrast, and brightness among different retinal images contribute to the diffi- culty to extract useful retinal features to distinguish exudates from other bright features in the images, shade correction and noise removal are crucial tasks to pre- pare the images before processing. To correct uneven illumination of images, a morphological top-hat ope- rator with disk-shaped structuring element and fixed radius of 25 pixels was applied to the green component of the color image. In general, morphological top-hat operator can remove background noise efficiently, which is defined as following. o THGGG B (1) where, G = original image, B = structuring element (G◦B) = opening operation to G by B. To reduce noise, a 3 × 3 (estimated by experimenting) adaptive median filter is applied to the shade corrected image. Its purpose is mainly for the removing impulse noise, smoothing of other noise and reducing distortion, like excessive thinning or thickening of object boundary. The detailed algorithm is given in [12,13]. For the further contrast enhancement, we applied a re- lated operation called “edge enhancement” or “unsharp masking” (UM) to make edges in an image slightly sharper and crisper. The idea of unsharp masking is to subtract a scaled “unsharp” version of the image from the original. In practice, we can achieve this effect by sub- tracting a scaled blurred image from the original [14]. Figure 1 illustrates the preprocessing results. 2.1.2. Optic Disc Localization The optic disc is a component on the fundus photo from where optic nerves and blood vessels originated. Loca- lization of an optic disc is a vital step in the automated retinal image screening system. The optic disc is ex- emplified by the largest high contrast among circular shape areas. Referring to the work of U. S. Akram et al. [15], to locate and segment the OD, we can use image averaging and Hough transformation, respectively. The detailed work for OD segmentation is given in [15]. After the OD is localized, we will remove it after we have segmented all exudates candidates involving the OD. 2.2. Candidate Region Detection and Features Extraction After the preprocessing for contrast enhancement, we would remove potential artifacts and enhance the con- trast of bright lesions by suppressing and smoothing out all dark and red components present in the retinal image. We then find candidate regions of exudates and gene- (a) (b) (c) Figure 1. Result of preprocessing methods. (a) Original image; (b) Filtered image; (c) Enhanced image. Copyright © 2013 SciRes. OPEN ACCESS  J. Lee et al. / J. Biomedical Science and Engineering 6 (2013) 298-307 300 rate all possible features related to exudates. 2.2.1. Segmentation and Feature Set 1 Formulation Exudates detection using mathematical morphology, FCM, a combination of FCM and mathematical morphology, naïve Bayesian classifier, SVMs and some other tech- niques have been used. In this paper we apply the ma- thematical morphology with three different levels of ada- pted threshold values (applying 90% confidence interval for Otsu-approach threshold [16]). We apply the morphological method to eliminate high contrast vessels by using a closing operator before a local variation operator. To ensure that all the neighboring pix- els are included in the candidate region, a dilation opera- tor is also applied. Finally the exudates detection areas are obtained by applying a threshold operator to the dif- ference between the original image and the reconstructed image. Finally, the OD is eliminated from the above can- didate region(s) image. An example can be seen in Fig- ure 2 (An illustration of the OD localization and removal of OD region is also given in this figure). The candidate exudates region detection phase extracts as many possible regions as it possibly can for potential exudates. The threshold value is deliberately kept low so that not a single pixel containing exudates will be missed at this stage. We removed the spurious pixels or non- exudates regions in classification stage. Exudates appear as bright yellow spots with variable size and shape but they have strong and sharp edges. The candidate exudates region extraction stage gives all possible regions that can be considered as potential exu- dates. If a retinal image I contains k potential candidate regions, then the set representation for an image I is Ie’ = {v1, v 2, …, v k}. For an automated system to distinguish between exudates and non-exudates regions, a feature set is formed for each candidate region. Each object or can- didate exudates region is considered as a sample for classification and represented by a feature vector con- taining m features; i.e., for a sample candidate region v from an image I, the feature vector is v = {x1, x2, x3, …, xm}. The description of features we used for classifi- cation of exudates and non-exudates regions are as follows: (a) (b) (c) Figure 2. Result of exudates detected methods. (a) Candidates; (b) OD localized; (c) Exudates. 1) Area (x1) is the number of pixels in candidate exu- dates region and is defined as sum of all pixels in candidate region vi. 1 i v A 2) Compactness (x2) is the measure of shape defined as 24πACp, where p and A are the perimeter and area of candidate region, respectively. 3) “Eccentricity” (x3)— Scalar that specifies the eccen- tricity of the ellipse that has the same second-moments as the region. The eccentricity is the ratio of the distance between the foci of the ellipse and its major axis length. The value is between 0 and 1. (0 and 1 are degenerate cases; an ellipse whose eccentricity is 0 is actually a circle, while an ellipse whose eccentricity is 1 is a line segment.) 4) Aspect ratio (x4) of an image describes the pro- portional relationship between its width and its height (in rectangle shape). For our study, we formulated two subgroup features sets: features set 1 is generated from exudates segmenta- tion and features set 2 is generated from texture analysis (see next section). Here in features set 1 we have four features from the segmented candidate exudates region and defined as: ;1,,; 1,, min;1,,;1, 2,, 4 max;1,,;;1, 2,, 4 ij minj ij maxj ij vxi Kj m vxiKj vxiKj (2) K is varied but m (=4) is fixed. Therefore, there are 9 variables from the segmented exudates candidates for each threshold of every image (8 from above features and one from the status of exudates). Overall, we gene- rated a total of 27 features from three thresholds of each image, i.e., Ie = {e1, e2, …, e27}. Other information of features will be obtained from the approach of texture analysis. Such approach will cover information of features from exudates candidate region such as Mean hue, Mean saturation, Mean value; Mean gradient magnitude for edge pixels and related entropy values [11]. Moreover, some complement infor- mation will also be generated from whole image instead of extracted exudates candidate regions since we are not guarantee (surely) to extract all exudates candidates without missing. Other features (features set 2) from the texture analy- sis for each image are given from both segmented blood vessels and enhanced gray level image. 2.2.2. Texture Analysis and Feature Set 2 Formulation There are three approaches from texture analysis: 1) Sta- tistical texture analysis involving gray level co-occur- rence matrix (GLCM) and run-length matrix; 2) HOS analysis; and 3) fractal analysis to generate some useful Copyright © 2013 SciRes. OPEN ACCESS  J. Lee et al. / J. Biomedical Science and Engineering 6 (2013) 298-307 301 features from the enhanced image. There are a total of 75 features generated initially. It includes 50 features com- ing from HOS analysis and 17 features generated from statistical texture analysis, and 8 features (three from mono-spectrum and five from multi-spectrum) from fractal analysis. The following are discussion of methods from the approach of statistical texture analysis, HOS and fractal analysis. 1) Statistical based texture analysis for image pro- cessing All related texture features from the statistical-based texture analysis were generated from each retinal image that derived from gray level co-occurrence matrix (GLCM) and run-length matrix [17-25]. For an image of size M × N, the gray level co-occur- rence matrix (GLCM) is defined as in [19] ,,,, ,, , d Cijpqpxqy: pqiI pxqyj , (3) where (p,q), and ,,pxqyMNd xy denotes the cardinality of a set. Given a gray level i in an image, the probability that the gray level of a pixel at a , y distance away is j is ,, dd d PijC ijC ij, (4) From each co-occurrence matrix we computed the following features: Energy: 2 Angular Second Moment, d ij Pij Entropy: ,ln , d ij EnPi jPi j Contrast: 2 ,, d ij ijP ij Homogeneity: 2 1, 1, d ij Pij ij Energy measures the textural uniformity of the image, i.e., the repetition of pixel pairs. Basically it is just the measurement of the denseness or order in the image. Entropy measures disorder or randomness of the image and it is an indication of the complexity within an image, thus, more complex images have higher entropy values. Contrast is a measure of the local variations present (or differences in the GLCM) in the image, so higher con- trast values indicate large local variations. Homogeneity (also called an inverse difference moment) is inversely proportional to contrast at constant energy. Similarly at constant contrast, homogeneity is inversely proportional to energy (Park, Lawrence, Windham, Chen, & Chao, 2002). It measures how close the distribution of elements in the GLCM is to the diagonal of GLCM. Other measurements such as Moments 1 - 4 are defined as: , g g ij mijP , d ij (5) where g is the integer power exponent that defines the moment order. Moments are the statistical expectation of certain power functions of a random variable and are characterized as follows [19]: moment 1 is the mean which is the average of pixel values in an image [20]; moment 2 is the standard deviation; moment 3 measures the degree of asymmetry in the distribution; and moment 4 measures the relative peakedness or flatness of a distribution and is also known as kurtosis [21]. Other similar approach can also be used: having the GLCM normalized, we can then derive eight second order statistic features which are also known as haralick features [22] for each image, which are: contrast, corre- lation, energy, entropy, homogeneity, dissimilarity, in- verse difference momentum, maximum probability. In addition to these features, we also applied correlation, dissimilarity, inverse difference momentum and maxi- mum probability, which is different from above men- tioned features. The grey level run-length matrix (RLM) is defined as the numbers of runs with pixels of gray level i and run length j for a given direction [23]. RLMs was generated for each sample image segment having directions (0˚, 45˚, 90˚ & 135˚), then the following five statistical features were derived: short run emphasis, long run emphasis, gray level non-uniformity, run length non-uniformity and run percentage. Basically it allows extraction of higher order statistical texture features. These five measures related method from run-length matrixes of θ = 0˚, 45˚, 90˚, and 135˚ were also provided in [25]. 2) High order spectra analysis (HOS) for image processing Higher order spectra (HOS) are known to have the ability to detect non-linearity and deviations from Gaussianity. Motivated by these, a set of HOS based parameters were proposed as features to differentiate the exudates, and non-exudates. HOS are spectral represen- tations of higher moments and they are derived from the averaged Fourier spectrum signal. The bispectrum 12 ,Bf f, of a signal is the Fourier transform (FT) of the third order correlation of the signal. It is given by 12121 2 ,*BffEXfXf Xff (6) where X(f) is the FT of the signal x(nT), * represents complex conjugation and E[.] stands for the expectation operation. It retains Fourier phase information. The fre- quency f may be normalized by the Nyquist frequency to be between 0 and 1. The bispectrum, given by Equation (6), is a complex-valued function of two frequencies. The bispectrum which is the product of three Fourier coeffi- cients exhibits symmetry and need only be computed in a non-redundant region. Assuming that there is no bispec- Copyright © 2013 SciRes. OPEN ACCESS  J. Lee et al. / J. Biomedical Science and Engineering 6 (2013) 298-307 302 tral aliasing, the bispectrum of a real-valued signal is uniquely defined with the triangle 0 ≤ f2 ≤ f1 ≤ f1 + f2 ≤ 1. This is termed as Ω, the principal domain or the non- redundant region (See the triangle region in Figure A2 in Appendix). Briefly, HOS based and spectral based features are: Mean of spectral magnitude for HOS [26]: 12 1, ave Bf f L (7) where B(f1, f2) is the bispectrum of the signal. Other features such as Entropy 1, 2 and 3 are defined as: Entropy 1: 1log kk k Pp p where 12 12 , , k Bf f pBf f , and Entropy 2: 2log ii i Pq q where 2 12 2 12 , , i Bf f q Bf f for HOS. Entropy 3: 2log nn n Pr r where 3 12 3 12 , , n Bf f r Bf f for HOS. And the feature of bispectrum phase entropy (EntPh): log nn n EntPh p where 2π1 2π ππ,0,1,,1 n n nnN NN and 12 Ω 1,, is indicator function n pIbff L I n : Bispectrum phase angle L: Number of points within the samples We used each of these bispectral invariant features for every 18˚ from 0˚ to 180˚. Therefore we obtained total 50 features of HOS. In the next section we will discuss the model-based methods such as fractal model approach. The fractal model is useful for modeling certain natural textures that have a statistical quality of roughness at different scales, and also for texture analysis and dis- crimination. 3) Fractal analysis Fractal model (analysis) may be considered as the model-based texture analysis. We can classify it into mono-fractal and multi-fractal. Since the surface com- plexity is fundamental to several properties and physical phenomena of a pattern. The diversified complexity of fractal may be described with the concept of fractal di- mension [27], which may easily describe the incom- pleteness or fragmentation of an entirety. Moreover, re- cent studies show that such surface complexity of image may be described not only by its fractal dimension but also its multifractal spectra, which its mathematical description of a surface can accurately reflect its features, and can be compatible with the various theoretical models which are related to surface structures. Thus we can apply fractal analysis to determine the surface com- plexity which is measured on the gray scale and by using multifractal spectra one can obtain more detailed in- formation than is possible with the fractal dimension alone. Recently this kind of technique is widely used in retinal vessels analysis. Measuring fractal dimension has previously attempted to quantify small changes to the human retinal vascula- ture, not immediately apparent by human observation, and act as an early marker of disease [28-30]. Mono- fractal analysis is an indicator of vascular change or disease has achieved limited success as retinal vessels may have different properties in different regions and different characteristics can be found depending on the location or scale of the measurement considered. Greater success has been reported by considering the retinal vascular pattern to be geometrical multi-fractal charac- terized by a hierarchy of exponents rather than a single fractal dimension [31]. We first applied box-counting algorithm (with Haus- dorff dimension) approach to calculate fractal dimension in binary type of image (segmentation of vessels) and then the Fourier fractal dimension (FFD) approach, which have been proposed by [28-30]. FFD has been used to quantify the grayscale images projected on to 3-D fractal surface [31]. The advantage of FFD is that it computes the fractal dimension of gray scale images, and eliminates the need for image segmentation [31]. It has also been found to be relatively insensitive to noise and it is believed to work effectively with data having low signal-to-noise ratio [31,32]. We adapted the similar FFD approach proposed by Azemin M. and et al. [30]. The parameters related such as slope and intercept are gene- rated based on this approach. Finally we applied the multifractal spectra since it can describe the evolution of the probability distribution of fractal structures [28, 31-33]. Instead of using simple fractals (or monofractals), multifractals are characterized by a hierarchy of ex- ponents, rather than a single fractal dimension. In this paper the box-counting method was used to characterize multiple spectra [31]. Copyright © 2013 SciRes. OPEN ACCESS  J. Lee et al. / J. Biomedical Science and Engineering 6 (2013) 298-307 303 Based on the above three approaches, the feature set 2 formulated from the texture analysis is given as 12 ,,, ; tn I where n is the number of features set 2 for each image. Total features generated from each image are defined as 128 27 ,,,,,, ,, ten nn IIIff f ff . Since n is 75 and so we have a total of 102 features used for classifying the exudates and non-exudates. 2.2.3. Dimension Reduction and Best Model Searching Since there are a total of 102 related variables (factors) for the analysis, but the number of samples is limited thus we need to reduce the dimension (filtering out some not-as-useful factors). This will help us find a more suitable diagnostic model in order to detect exudates with more efficiency. The following are the two major steps. 1) Dimension reduction We first reduce dimension since most of the features are correlated or redundant in the model. A penalized logistic regression method (Pelora) [35] was used to cluster the datasets from the above procedures combining all 102 parameters (factors). This is a supervised clu- stering algorithm that has been used with external infor- mation about response variables for clustering genes in genetic study. This algorithm is mainly based on penalize logistic regression analysis and it combines feature selec- tion, supervision, feature clustering and sample classi- fication in a single step. We have adapted this method for features selection generated from retinal images and then classified the variables (potential factors) obtained. This approach will preserve the property of the classified (identified) groups with complex interactions. 2) Model selection with multimodel inference After the dimensions have been reduced, we applied the method of automated model selection and model- averaging that provides a wrapper for GLM and similar functions, automatically generating all possible models with the specified response of exudates(s) and explana- tory variables, and determine the best models with a defined criterion (e.g. AIC or AICc). The best model is mainly based on the bias-variance trade-off. Statistical models are probability density functions, where we can maximize the likelihood ˆ,argmax f by minimize the Kullback-Lei- bler distance from the true model to the approximating model, i.e., .. ˆ,, as argmaxKL gf Here KL distance is one way to measure the distance between two densities: ,,log d , gy Lgf gyy fy g(y) for the discrepancy is weighted by the probability observing the data y, and , y fy is the ratio that mea- sures the discrepancy between the two models for data y. AIC selects the model closest to the true model on average. Since the true distribution of g is unknown, so we replace it with the empirical (observed) distribution. Thus the estimation of KL distance is introduced and a bias will also be given. To determine the expected value of this bias, the so called Takeuchi Information Criterion (TIC) is used. Finally under the assumption of appro- ximate model correct, we derived AIC and related crite- ria. On the other hands, since AIC selects the model closest to the true model on average (Atypical datasets have lower influence than typical ones) to deal with the model selection uncertainty and usual sampling uncer- tainty. To do this, we bootstrap the data and produce the distribution of best models. Then apply the smoothed model weights and finally determine: 1) the value of the parameter on average (also its variance) for solving the model selection uncertainty problem; and 2) the standard error for a given model that follows a ˆ distribution (conditional variance of the estimator), this is to deal with usual sampling uncertainty. Thus we can combine the above two variances to form the overall variance for the estimator ˆ . Such approach reduces the spurious estimates (false positive) problem, which standard model selection techniques often encountered (see Freedman’s paradox). Because algorithm convergence for the best model is not guaranteed and the number of models is large when involving interactions in model, we used a genetic algorithm (better when the number of models to explore is prohibitively large). The model AICc values and com- plexity are obtained for the selection of the best model. We then applied GLMULTI, an R package for automated model selection and multi-model inference with GLM and related functions. The basic idea of this approach is that from a list of explanatory variables, GLMULTI builds all possible models involving these variables and, optionally, included their pairwise interactions (for the computing of simplicity and easy interpretation reasons we will not consider higher order interaction in this paper). Restrictions can be specified for candidate mod- els, by excluding specific terms, enforcing marginality, or controlling model complexity. Detailed information is referred to [36-39]. The model selection (variable selection in multiple re- gression framework) framework is given in Figure 3. Copyright © 2013 SciRes. OPEN ACCESS  J. Lee et al. / J. Biomedical Science and Engineering 6 (2013) 298-307 Copyright © 2013 SciRes. 304 Model SelectionInference Set of Candidate models Best ModelEstimates/Predictions Figure 3. Multi-model inference approach diagram. 2.2.4. Classification and Validation Two different classification methods were investigated to detect exudates. We first applied logistic regression with ROC to classify and validate the abnormal of DR with exudates. Then we applied the approach of Multilayer perception (MLP), a multilayer feed-forward network which is an important class of NNs that can represent non-linear functional mapping between a set of input variables and a set of output variables [40,41]. A MLP with enough units in a single hidden layer can approxi- mate any function, provided the activation function of the neurons satisfies some general constraints [42,43]. From these considerations, we decide to use a MLP with one hidden layer, for which the optimum number of hid- den neurons was experimentally determined. As neuron activation function in the hidden layer, we chose the hy- perbolic tangent sigmoid function (tan-sigmoid) an anti- symmetric function in the interval (−1,1). Tan-sigmoid satisfies the constraints in [42,43]. Moreover, it improves the learning speed of MLP [40]. In the output layer, we used the logistic sigmoid activation function, that also satisfies the aforementioned constraints and whose out- puts lie in the range (0,1). This choice was motivated by the fact of interpreting the outputs of the network as pos- terior probabilities [41]. OPEN ACCESS The problem of training a NN can be formulated in terms of the minimization of an error function. The choice of a suitable error function and minimization al- gorithm can improve the performance of MLP. It has been demonstrated [41] that a cross-entropy error func- tion simplifies the optimization process when the logistic sigmoid activation function is used in the output layer. Therefore, we considered this function as an appropriate choice in our study. Regarding the minimization algorithm, several choices are available for MLP. We selected the scaled conjugate gradients algorithm, for which the error function is guaranteed not to increase during training [41]. Moreover, it generally shows faster convergence when compared to gradient descent-based techniques or even conventional conjugate gradient algorithms [41]. To avoid overfitting and improve generalization, we can also employ a weight decay regularizer [41]. The re- gularization parameter, ν, was experimentally settled. If the output is above 0.5 for some input vector, the pro- bability of the image region represented by that input vector of being an EX is greater than that of being a non-EX. Therefore, the output threshold was set to 0.5. 3. RESULTS AND DISCUSSION Many experiments have been performed on normal and abnormal retinal images based on presenting of exudates. To test and validate our proposed method, the following 89 images from the DIARETDB1 database of resolution 1500 × 1152 with their clinician marked images [44] were used to validate our method at the pixel level. 47 of these images contain exudates while the remaining 42 either contain other type of lesions or are normal. We used this database to measure the accuracy of the pro- posed method based on its ability to distinguish between normal and abnormal images. An example of the classi- fication with MLP is shown in Table 1 (with AUC = 0.98). The performance of the proposed approach for exu- dates detection was assessed quantitatively by comparing the results of extractions with the ophthalmologist’s ground-truth images. The comparison for the results of the proposed approach (classified using logistic regres- sion and MLP in SPSS) and other previous methods are shown in Table 2. In classification stage, MLP method is used and a training set was obtained from approximately 70% of whole dataset randomly. The remaining about 30% will be used for testing. The similar procedure was repeat used in 50 times. The average of measured cor- rectness obtained as the final results. 4. CONCLUSION We propose a novel method to automatically detect exu- dates from retinal images. The method combined both exudates segmentation and the analysis using statistical texture features, higher order spectra related features and fractal analysis related features. For the segmentation process, we also generate few (four) segmented region properties including maximum of Eccentricity, minimum and maximum of aspect ratio, and also the area of exu- dates in pixels. For the texture analysis, we generated some multifractal spectrum related features and also some related interaction. We may consider fitting gener- alized linear models with L1(lasso) and/or L2(ridge) pe-  J. Lee et al. / J. Biomedical Science and Engineering 6 (2013) 298-307 305 Table 1. Example of classification. Classification Predicted Sample Observed 0 1 Percent Correct 0 28 1 96.6% 1 1 34 97.1% Training Overall Percent 45.3% 54.7% 96.9% 0 13 0 100.0% 1 0 12 100.0% Testing Overall Percent 52.0% 48.0% 100.0% Dependent variable: Exudates. Table 2. Comparison of exudates detection methods. Validation Method/Reference (using DIARETDB1) AUC (%) Sensitivity Specificity Kande et al. [4] ------ 86 98 Welfer et al. [5] ------ 70.48 98.84 Jaafar et al. [8] 99.4 89.3 99.3 Our proposed method LR classifier MPLNN classifiera 100 (97.8, 94.2) 100 (95.8, 91) 100 98.45 (Using other database) Sopharak et al. [10] 98.41 92.28 98.52 Garcia et al. [7] 97 88.14 92.6 Ravishankar et al. [6] ------ 94.16 91.1 aSensitivity and specificity are given in the form of (training, testing). nalizes combined with bootstrap technique for feature selection involving Higher order interaction (>2) in fu- ture. Overall, the application of multi-inference approach statistical model increased both sensitivity and specificity. For instance, our proposed model without pair-wise in- teraction, the results of sensitivity, specificity and AUC are 0.915, 0.857 and 0.94, respectively (used logistic regression classifier). The final result with interaction terms is dramatically improved for the detection of exu- dates from retinal images. However, despite its superior performance and ability to deal with variant image qua- lity, the proposed method still need to be examined in a large amount of retinal images and also expanded to in- clude all signs of DR. Thus, our future work will under- take detecting the other type of lesions associated with DR. REFERENCES [1] Fong, D.S. et al., (2003) Diabetic retinopathy. Diabetes Care, 26, 226-229. doi:10.2337/diacare.26.1.226 [2] Sopharak, A., Uyyanonvara, B., Barman, S. and Willia- son, T. (2010) Comparative analysis of automatic exu- date detection algorithms. WCE, London. [3] Sánchez, C.I., et al. (2010) Improving hard exudates de- tection in retinal images through a combination of local and contextual information. 2010 IEEE International Symposium on Biomedical Imaging: From Nano to Ma- cro, Rotterdam, 14-17 April 2010, 5-8. [4] Kande, G., Subbaiah, P. and Savithri, T. (2008) Segmen- tation of exdates and optic disk in retinal images. IEEE Processing of 6th Indian Conference on Computer Vision, Graphic & Image, Bhubaneshwar, 16-19 December 2008. [5] Welfer, D., et al. (2009) A coarse-to-fine strategy for automatically detecting exudates in color eye fundus im- ages. Computerized Medical Imaging and Graphics, 34, 228-235. [6] Ravishankar, S., Jain, A. and Mittal, A. (2009) Auto- mated feature extraction for early detection of diabetic retinopathy in fundus images.IEEE Conference on Com- puter Vision and Pattern Recognition (CVPR), Miami, 20-25 June 2009. [7] Garcia, M., et al. (2009) Neural network based detection of hard exudates in retinal images. Computer Methods and Programs in Biomedicine, 93, 9-19. doi:10.1016/j.cmpb.2008.07.006 [8] Jaafar, H., Nandi, A. and Al-Nuaimy, W. (2010) Auto- mated detection of exudates in retinal images using a split and merge algorithm. EUSIPCO,Aalborg, 23-27 August 2010. [9] Sanchez, C.I., et al. (2008) A novel automatic image pro- cessing algorithm for detection of hard exudates based on retinal image analysis. Medical Engineering & Physics, 30, 350-357. doi:10.1016/j.medengphy.2007.04.010 [10] Sopharak, A., et al. (2009) Machine learning approach to automatic exudate detection in retinal images from dia- betic retinopathy. Journal of Modern Optics, 57, 1-12. [11] Akram, M.U., et al. (2012) Automated detection of exu- dates in colored retinal images for diagnosis of diabetic retinopathy. Applied Optics, 51, 4858-4866. [12] Gonzalez, R.C. and Woods, R.E. (2008) Digital image processing. 3rd Edition, Prentice Hall, Upper Saddle Ri- ver. [13] Hwang, H. and Haddad, R.A. (1995) Adoptive median filters: New algorithm and results. IEEE Transactions on Image Processing, 4, 499, doi:10.1109/83.370679 [14] Tanaka, G., Suetake, N. and Uchino, E. (2010) Image en- hancement based on nonlinear smoothing and sharpening for noisy images. Journal of Advanced Computational Intelligence and Intelligent Informatics (JACIII), 14, 200- 207. [15] Akram, M.U., Khan, A., Iqbal, K. and Butt, W.H. (2010) Retinal image: Optic disk localization and detection. Im- age Analysis and Recognition, Lecture Notes in Com- puter Science, 6112, 40-49. doi:10.1007/978-3-642-13775-4_5 [16] Otsu, N. (1979) A threshold selection method from gray- level histograms. IEEE Transactions on Systems, Man, and Cybernetics, 9, 62-66. doi:10.1109/TSMC.1979.4310076 Copyright © 2013 SciRes. OPEN ACCESS 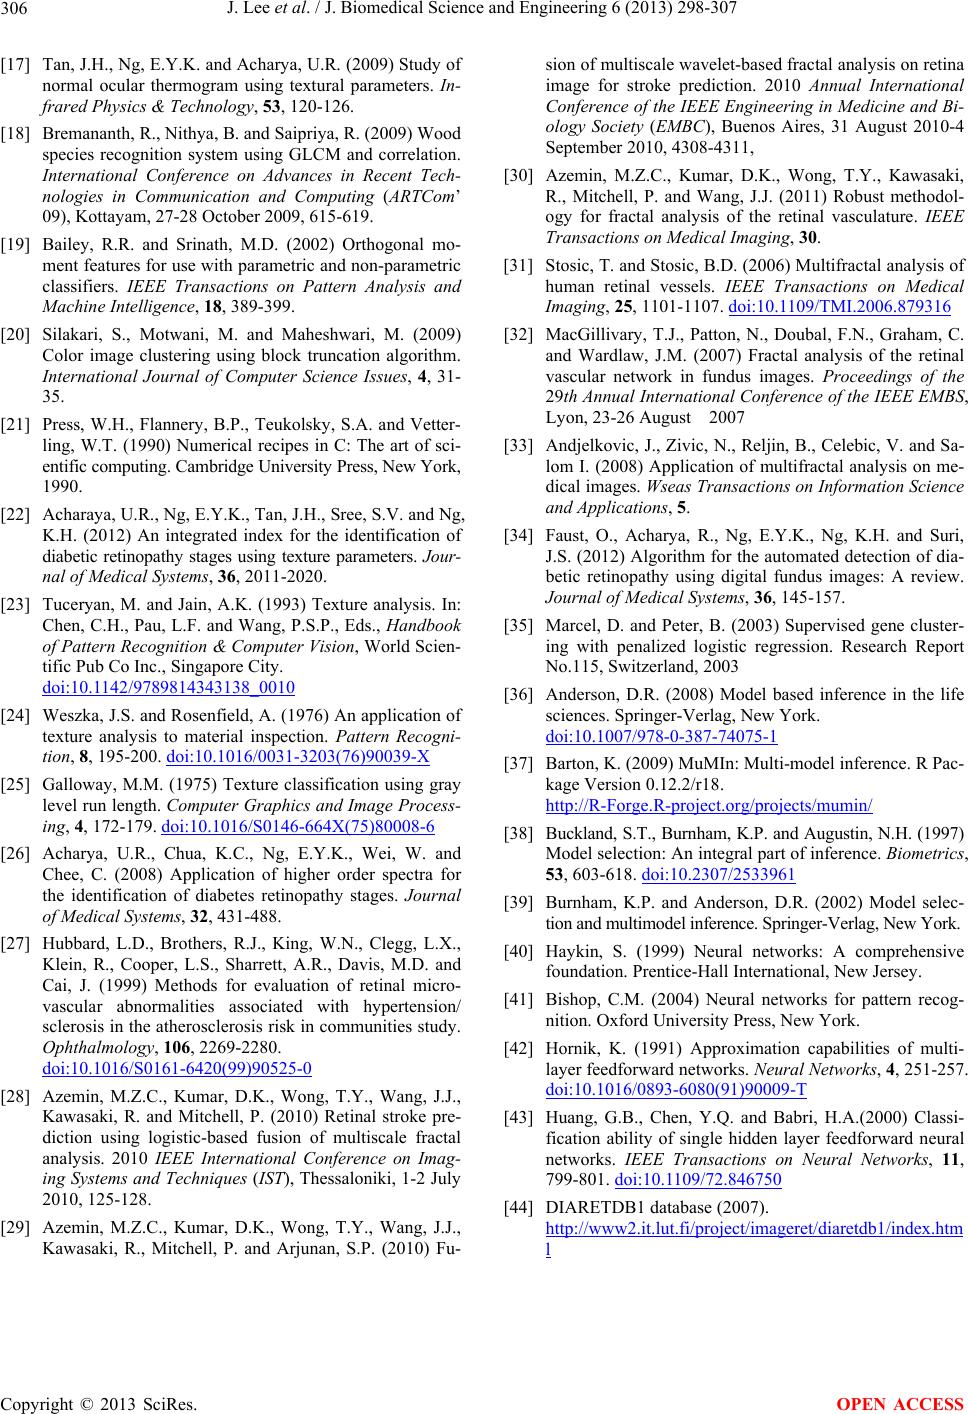 J. Lee et al. / J. Biomedical Science and Engineering 6 (2013) 298-307 Copyright © 2013 SciRes. 306 OPEN ACCESS [17] Tan, J.H., Ng, E.Y.K. and Acharya, U.R. (2009) Study of normal ocular thermogram using textural parameters. In- frared Physics & Technology, 53, 120-126. [18] Bremananth, R., Nithya, B. and Saipriya, R. (2009) Wood species recognition system using GLCM and correlation. International Conference on Advances in Recent Tech- nologies in Communication and Computing (ARTCom’ 09), Kottayam, 27-28 October 2009, 615-619. [19] Bailey, R.R. and Srinath, M.D. (2002) Orthogonal mo- ment features for use with parametric and non-parametric classifiers. IEEE Transactions on Pattern Analysis and Machine Intelligence, 18, 389-399. [20] Silakari, S., Motwani, M. and Maheshwari, M. (2009) Color image clustering using block truncation algorithm. International Journal of Computer Science Issues, 4, 31- 35. [21] Press, W.H., Flannery, B.P., Teukolsky, S.A. and Vetter- ling, W.T. (1990) Numerical recipes in C: The art of sci- entific computing. Cambridge University Press, New York, 1990. [22] Acharaya, U.R., Ng, E.Y.K., Tan, J.H., Sree, S.V. and Ng, K.H. (2012) An integrated index for the identification of diabetic retinopathy stages using texture parameters. Jour- nal of Medical Systems, 36, 2011-2020. [23] Tuceryan, M. and Jain, A.K. (1993) Texture analysis. In: Chen, C.H., Pau, L.F. and Wang, P.S.P., Eds., Handbook of Pattern Recognition & Computer Vision, World Scien- tific Pub Co Inc.,Singapore City. doi:10.1142/9789814343138_0010 [24] Weszka, J.S. and Rosenfield, A. (1976) An application of texture analysis to material inspection. Pattern Recogni- tion, 8, 195-200. doi:10.1016/0031-3203(76)90039-X [25] Galloway, M.M. (1975) Texture classification using gray level run length. Computer Graphics and Image Process- ing, 4, 172-179. doi:10.1016/S0146-664X(75)80008-6 [26] Acharya, U.R., Chua, K.C., Ng, E.Y.K., Wei, W. and Chee, C. (2008) Application of higher order spectra for the identification of diabetes retinopathy stages. Journal of Medical Systems, 32, 431-488. [27] Hubbard, L.D., Brothers, R.J., King, W.N., Clegg, L.X., Klein, R., Cooper, L.S., Sharrett, A.R., Davis, M.D. and Cai, J. (1999) Methods for evaluation of retinal micro- vascular abnormalities associated with hypertension/ sclerosis in the atherosclerosis risk in communities study. Ophthalmology, 106, 2269-2280. doi:10.1016/S0161-6420(99)90525-0 [28] Azemin, M.Z.C., Kumar, D.K., Wong, T.Y., Wang, J.J., Kawasaki, R. and Mitchell, P. (2010) Retinal stroke pre- diction using logistic-based fusion of multiscale fractal analysis. 2010 IEEE International Conference on Imag- ing Systems and Techniques (IST), Thessaloniki, 1-2 July 2010, 125-128. [29] Azemin, M.Z.C., Kumar, D.K., Wong, T.Y., Wang, J.J., Kawasaki, R., Mitchell, P. and Arjunan, S.P. (2010) Fu- sion of multiscale wavelet-based fractal analysis on retina image for stroke prediction. 2010 Annual International Conference of the IEEE Engineering in Medicine and Bi- ology Society (EMBC), Buenos Aires, 31 August 2010-4 September 2010, 4308-4311, [30] Azemin, M.Z.C., Kumar, D.K., Wong, T.Y., Kawasaki, R., Mitchell, P. and Wang, J.J. (2011) Robust methodol- ogy for fractal analysis of the retinal vasculature. IEEE Transactions on Medical Imaging, 30. [31] Stosic, T. and Stosic, B.D. (2006) Multifractal analysis of human retinal vessels. IEEE Transactions on Medical Imaging, 25, 1101-1107. doi:10.1109/TMI.2006.879316 [32] MacGillivary, T.J., Patton, N., Doubal, F.N., Graham, C. and Wardlaw, J.M. (2007) Fractal analysis of the retinal vascular network in fundus images. Proceedings of the 29th Annual International Conference of the IEEE EMBS, Lyon, 23-26 August 2007 [33] Andjelkovic, J., Zivic, N., Reljin, B., Celebic, V. and Sa- lom I. (2008) Application of multifractal analysis on me- dical images. Wseas Transactions on Information Science and Applications, 5. [34] Faust, O., Acharya, R., Ng, E.Y.K., Ng, K.H. and Suri, J.S. (2012) Algorithm for the automated detection of dia- betic retinopathy using digital fundus images: A review. Journal of Medical Systems, 36, 145-157. [35] Marcel, D. and Peter, B. (2003) Supervised gene cluster- ing with penalized logistic regression. Research Report No.115, Switzerland, 2003 [36] Anderson, D.R. (2008) Model based inference in the life sciences. Springer-Verlag, New York. doi:10.1007/978-0-387-74075-1 [37] Barton, K. (2009) MuMIn: Multi-model inference. R Pac- kage Version 0.12.2/r18. http://R-Forge.R-project.org/projects/mumin/ [38] Buckland, S.T., Burnham, K.P. and Augustin, N.H. (1997) Model selection: An integral part of inference. Biometrics, 53, 603-618. doi:10.2307/2533961 [39] Burnham, K.P. and Anderson, D.R. (2002) Model selec- tion and multimodel inference. Springer-Verlag, New York. [40] Haykin, S. (1999) Neural networks: A comprehensive foundation. Prentice-Hall International, New Jersey. [41] Bishop, C.M. (2004) Neural networks for pattern recog- nition. Oxford University Press, New York. [42] Hornik, K. (1991) Approximation capabilities of multi- layer feedforward networks. Neural Networks, 4, 251-257. doi:10.1016/0893-6080(91)90009-T [43] Huang, G.B., Chen, Y.Q. and Babri, H.A.(2000) Classi- fication ability of single hidden layer feedforward neural networks. IEEE Transactions on Neural Networks, 11, 799-801. doi:10.1109/72.846750 [44] DIARETDB1 database (2007). http://www2.it.lut.fi/project/imageret/diaretdb1/index.htm l  J. Lee et al. / J. Biomedical Science and Engineering 6 (2013) 298-307 307 APPENDIX Input Retinal Image Pre-processing Detection of Optic Disc Detection of ExudatesTexture Analysis Removal of OD region Candidate Exudates Regions Features Set 1 Formation Features Set 2 Formation HOSA Fractal Analysis STA Classifier Non-exudate Exudate Figure A1. The proposed block diagram for exudates detection. 0.5 f 2 f 1 0 0.5 1 Non-redundant Zonr: Ω Figure A2. Non-redundant region (Ω) of computation of the bispectrum for real signals. Parameters are calculated from this region. Copyright © 2013 SciRes. OPEN ACCESS
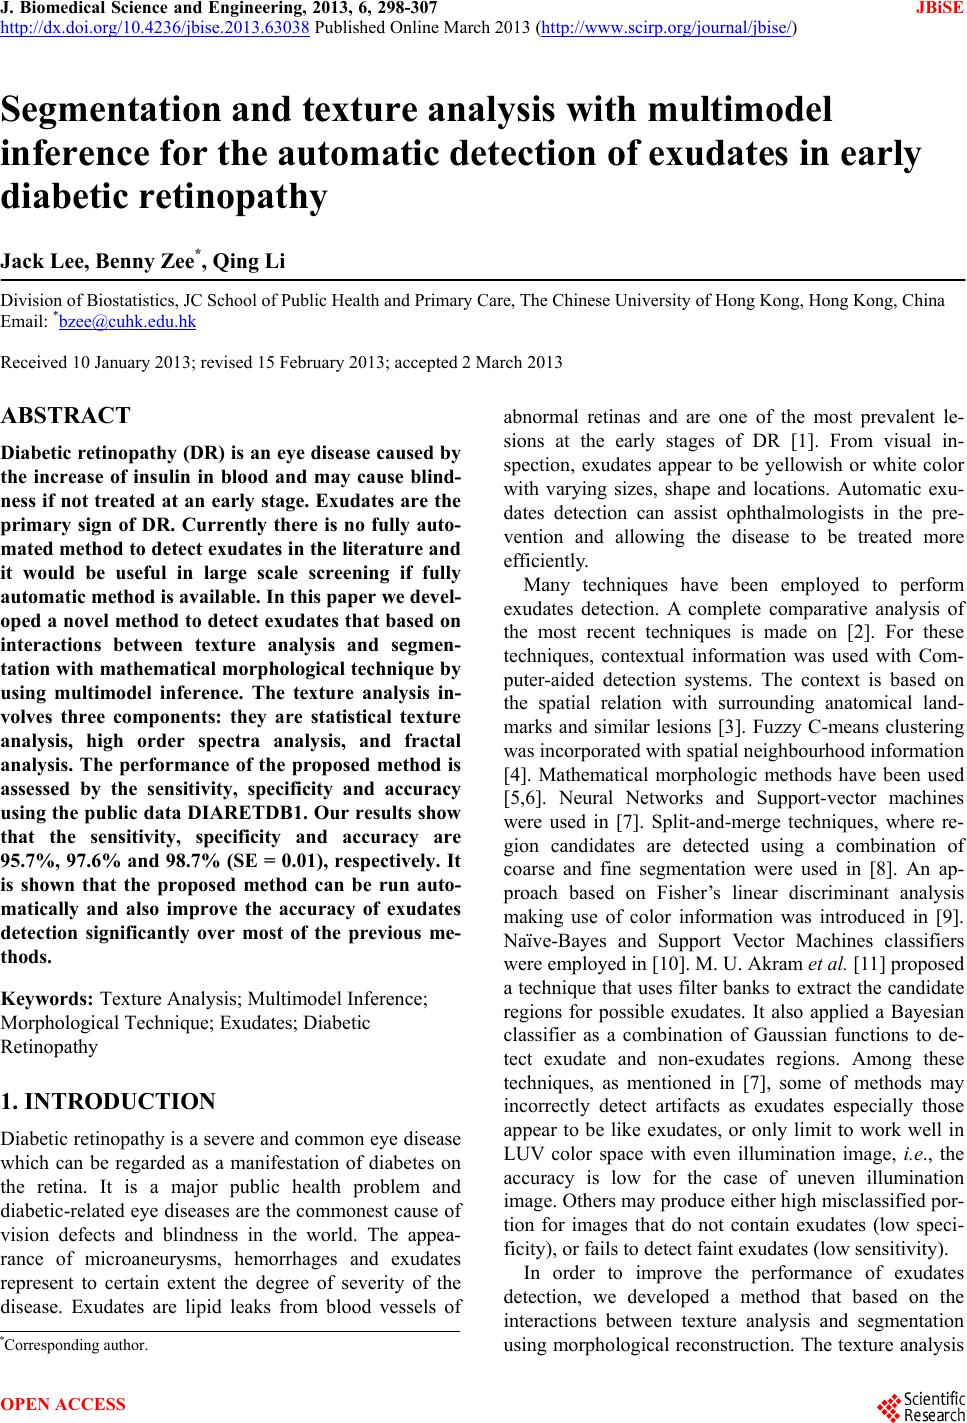
|