 Low Carbon Economy, 2013, 4, 36-44 http://dx.doi.org/10.4236/lce.2013.41004 Published Online March 2013 (http://www.scirp.org/journal/lce) Accounting for Greenhouse Gas Emissions of Materials at the Urban Scale-Relating Existing Process Life Cycle Assessment Studies to Urban Material and Waste Composition Meidad Kissinger1, Cornelia Sussmann2, Jennie Moore2, William E. Rees2 1Department of Geography and Environmental Development, Ben Gurion University of the Negev, Beer Sheva, Israel; 2School of Community and Regional Planning, University of British Columbia, Vancouver, Canada. Email: meidadk@bgu.ac.il Received November 9th, 2012; revised December 10th, 2012; accepted January 5th, 2013 ABSTRACT Although many cities are engaged in efforts to calculate and reduce their greenhouse gas (GHG) emissions, most are accounting for “scope one” emissions i.e., GHGs produced within urban boundaries (for example, following the proto- col of the International Council for Lo cal Environmental Initiatives). Cities should also account for the emissions asso- ciated with goods, services and materials consumed within their boundaries, “scope three” emissions. The emissions related to urban consumption patterns and choices greatly influence overall emissions that can be associated with an urban area. However, data constraints and GHG accounting complexity present challenges. In this paper we propose one approach that cities can take to measure the GHG emissions of their material consumption: the solid waste life cy- cle assessment (LCA) based approach. We used this approach to identify a set of materials commonly consumed within cities, and reviewed published life cycle assessment data to determine the GHG emissions associated with production of each. Our review reveals that among fourteen commonly consumed materials, textiles and aluminum are associated with the highest GHG emissions per tonne of production. Paper and plastics have relatively lower production emissions, but a potentially higher impact on overall emissions owing to their large proportions, by weight, in the consumption stream. Keywords: Greenhouse Gas Emissions; Scope 3 Emissions; Life Cycle Assessment; Urban Sustainability 1. Introduction It has been estimated that about 78% of global carbon emissions can be directly and indirectly related tocities [1,2]. To avoid the most catastrophic consequences of global climate change, greenhouse gas (GHG) emissions associated with urban centres must be dramatically re- duced [3-5]. Toward this goal, many cities are engaged in efforts to calculate and reduce th eir green house gas emis- sions. Most are accounting for GHGs produced within urban boundaries, often referred to as “scope one” emis- sions. A growing awareness among researchers suggests that in order to achieve globally relevant reductions in atmospheric carbon levels, municipal governments and urban residents should also take responsibility for urban “lifestyle” or consumption emissions: emissions mostly related to the GHGs embodied in the life cycle of mate- rial goods (as well as food) consumed in the city (scope 3 emissions) [6-10]. Information about the GHG emissions associated with the manufacturing of specific materials can be used to generate public awareness about implica- tions of material consumption choices and habits. It can also be used to develop municipal policies and programs targeting high-emissions materials for reduction. How- ever, data constraints and GHG accounting complexity present challenges. We suggest that cities can use the solid waste life cycle assessment (LCA) based approach to account for their material consumption. We used the approach to identify a set of materials commonly con- sumed in cities, and then reviewed published LCA data to develop a range of GHG emissions values for each ma- terial. Our review of the studies and our dataset of emis- sions values are presented. Cities that measure their GHG emissions follow inter- national protocols such as the International Local Gov- ernment GHG Emissions Analysis Protocol [11]. These protocols account for emissions perceived to be directly within the control of the local government. “Scope one” Copyright © 2013 SciRes. LCE  Accounting for Greenhouse Gas Emissions of Materials at the Urban Scale-Relating Existing Process Life Cycle Assessment Studies to Urban Material and Waste Composition 37 includes emissions from facilities that are owned by the local government or emissions produced by citizens’ ac- tivities within city limits, for example, from motor vehi- cle transportation. Emissions associated with electrical energy used to operate buildings and emissions from solid waste management are also counted, even though these emissions are sometimes generated outside the city, e.g. at a remote power station. Several studies have followed similar principals in ge- nerating GHG emissions inventories for urban settlements [12-15]. Bi et al. [14] produced a bottom up GHG emis- sions inventory for Nanjing, China. They included emis- sions from industrial, transport, commercial and house- hold energy consumption; emissions from industrial pro- cesses located within the city, and emissions from waste treatment. Kennedy et al. [13] generated GHG emissions inventories for ten cities on four continents. Their me- thod includes seven components: electricity, heating and industrial fuels, industrial processes, ground transporta- tion, aviation transportation, marine transportation, and waste. Few researchers have conducted studies that include urban consumption related or, scope 3, emissions. One challenge has been data limitations [15]. Hillman and Ra- maswami [16] calculated GHG emissions for eight US cities including embodied emissions in food, transport fuels, shelter and cross-border freight demands. Yang and Suh [17] accounted for the GHG emissions related to products consumed by Chinese urban and rural house- holds; and Druckman and Jackson [18] calculated the GHG emissions required to satisfy average UK house- hold demand for goods and services between 1990 and 2004. To date, no standard method for assessing GHG emissions from urban material consumption has been de- termined. One GHG accounting approach increasingly being used at the sub-national/urban scale is “environmental input- output analysis” (EIOA) [19-21]. It uses local expendi- ture data ($) for some consumption items like food and materials, and relates them to carbon emissions in an ex- tension of conventional monetary input-output analysis. However, that approach usually does not provide data at the scale of specific material types such as newsprint and cardboard, or even at the scale of product groups like paper or plastic. Rather, EIOA operates at the industry scale (e.g., emissions per $ value of the national paper or plastic industry). Further, the approach requires cities to have detailed residents’ expenditure data to generate in- put-output tables, a requirement that many cities cannot easily meet. It follows that if cities are to take on measurement, monitoring and development of policies to reduce mate- rial consumption-related GHG emissions, they require local data and a method that is not too onerous [22]. The “solid waste LCA based approach” [23-26] we suggest here overcomes data limitations by using data many cit- ies already collect, solid waste volume and composition data, to identify p atterns of material consumption. It then uses data from a wide range of life cycle assessment stud - ies to determine the GHG emissions associated with pro- duction of a material or product. For this paper, we used the approach to identify fourteen materials commonly consumed in cities in high income countries, and con- ducted a thorough review of published, process life cycle studies to determine GHG emissions values for each ma- terial. The range of GHG emissions values we present for each material reflects the variability of life cycle charac- teristics associated with production method and location. 2. Methods While cities do not commonly monito r or document their residents’ material consumption, they do manage and monitor solid waste. The “component solid waste LCA based approach” uses urban waste stream data to identify the major types of materials consumed in urban areas. This approach to estimating urban material consumption was developed by Simmons et al. [24]; Chambers et al. [26], and Barrett et al. [23] as part of their studies on urban sustainability u sing ecological footprint an alysis. It has been used since by some footprint studies at the ur- ban scale [21,22]. The logic behind the approach is that most materials consumed end up in the waste stream, some in a matter of minutes after consumption, others after years. Although waste stream data will not represen t the exact quantities of all materials consumed in a city over a given period of time, it is reasonable to assume that the proportions of materials (by weight) found in the waste stream reflect the proportions consumed. In this way, a set of regularly consumed materials can be identi- fied by type and weight. In absence of other urban mate- rial consumption data, the waste stream serves as a useful proxy. We reviewed waste stream documentation and report- ing protocols for ten cities in relatively high income countries: Canada, United Kingdom, the United States, Australia and Israel. The purpose of the review was to identify a general trend in the way solid waste is docu- mented, and to generate a list of commonly reported waste items. Cities that monitor and document comer- cial and household waste composition collect data on the following major categories: metal; glass; plastics; paper; organics; textiles; rubber; and hazardous wastes. Many use more detailed categories. For example, paper is bro- ken down into paper, newsprint, and cardboard. Plastics are identified by type (polyethylene terephthalate [PET]; high density polyethylene [HDPE]; low density polyeth- Copyright © 2013 SciRes. LCE 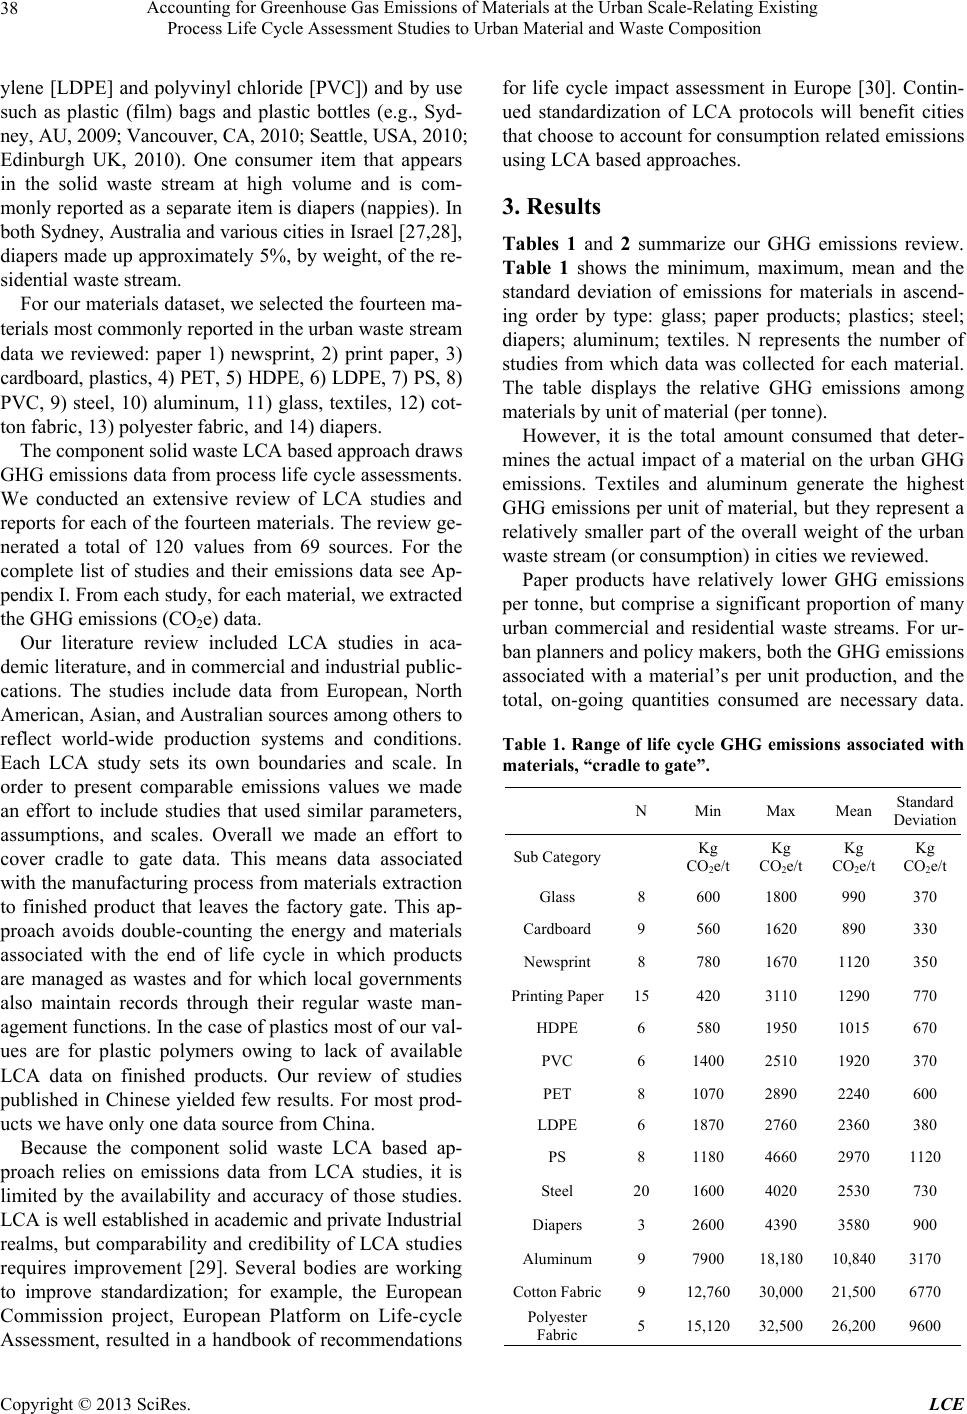 Accounting for Greenhouse Gas Emissions of Materials at the Urban Scale-Relating Existing Process Life Cycle Assessment Studies to Urban Material and Waste Composition 38 ylene [LDPE] and polyvinyl chloride [PVC]) and by use such as plastic (film) bags and plastic bottles (e.g., Syd- ney, AU, 2009; Vancouver, CA, 2010; Seattle, USA, 2010; Edinburgh UK, 2010). One consumer item that appears in the solid waste stream at high volume and is com- monly reported as a separate item is diapers (nappies). In both Sydney, Australia and various cities in Israel [27 ,2 8] , diapers made up approximately 5%, by weight, of the re- sidential waste stream. For our materials dataset, we selected the fourteen ma- terials most commonly reported in the urban waste stream data we reviewed: paper 1) newsprint, 2) print paper, 3) cardboard, plastics, 4) PET, 5) HDPE, 6) LDPE, 7) PS, 8) PVC, 9) steel, 10) aluminum, 11) glass, textiles, 12) cot- ton fabri c, 13) pol yester fabric, an d 14) diapers. The component solid waste LCA based approach draws GHG emissions data from process life cycle assessments. We conducted an extensive review of LCA studies and reports for each of the fourteen materials. The review ge- nerated a total of 120 values from 69 sources. For the complete list of studies and their emissions data see Ap- pendix I. From each study, for each material, we extr ac te d the GHG emissions (CO2e) data. Our literature review included LCA studies in aca- demic literature, and in commercial and industrial public- cations. The studies include data from European, North American, Asian, and Australian sources among others to reflect world-wide production systems and conditions. Each LCA study sets its own boundaries and scale. In order to present comparable emissions values we made an effort to include studies that used similar parameters, assumptions, and scales. Overall we made an effort to cover cradle to gate data. This means data associated with the manufacturing process from materials extraction to finished product that leaves the factory gate. This ap- proach avoids double-counting the energy and materials associated with the end of life cycle in which products are managed as wastes and for which local governments also maintain records through their regular waste man- agement functions. In the case of plastics most of our val- ues are for plastic polymers owing to lack of available LCA data on finished products. Our review of studies published in Chinese yielded few results. For most prod- ucts we have only one data source from China. Because the component solid waste LCA based ap- proach relies on emissions data from LCA studies, it is limited by the availability and accuracy of those studies. LCA is well established in academic and private Industrial realms, but comparability and credibility of LCA stud ies requires improvement [29]. Several bodies are working to improve standardization; for example, the European Commission project, European Platform on Life-cycle Assessment, resulted in a handbook of recommendations for life cycle impact assessment in Europe [30]. Contin- ued standardization of LCA protocols will benefit cities that choose to account for consumption related emissions using LCA based approaches. 3. Results Tables 1 and 2 summarize our GHG emissions review. Table 1 shows the minimum, maximum, mean and the standard deviation of emissions for materials in ascend- ing order by type: glass; paper products; plastics; steel; diapers; aluminum; textiles. N represents the number of studies from which data was collected for each material. The table displays the relative GHG emissions among materials by unit of material (per tonne). However, it is the total amount consumed that deter- mines the actual impact of a material on the urban GHG emissions. Textiles and aluminum generate the highest GHG emissions per unit of material, but they represent a relatively smaller part of the overall weight of the urban waste stream (or consumption) in cities we reviewed. Paper products have relatively lower GHG emissions per tonne, but comprise a significant proportion of many urban commercial and residential waste streams. For ur- ban planners and policy makers, both the GHG emissions associated with a material’s per unit production, and the total, on-going quantities consumed are necessary data. Table 1. Range of life cycle GHG emissions associated with materials, “cradle to gate”. N Min Max Mean Standard Deviation Sub Category Kg CO2e/t Kg CO2e/t Kg CO2e/t Kg CO2e/t Glass 8 600 1800 990 370 Cardboard 9 560 1620 890 330 Newsprint 8 780 1670 1120 350 Printing Paper15 420 3110 1290 770 HDPE 6 580 1950 1015 670 PVC 6 1400 2510 1920 370 PET 8 1070 2890 2240 600 LDPE 6 1870 2760 2360 380 PS 8 1180 4660 2970 1120 Steel 20 1600 4020 2530 730 Diapers 3 2600 4390 3580 900 Aluminum 9 7900 18,180 10,8403170 Cotton Fabric9 12,760 30,000 21,5006770 Polyester Fabric 5 15,120 32,500 26,2009600 Copyright © 2013 SciRes. LCE 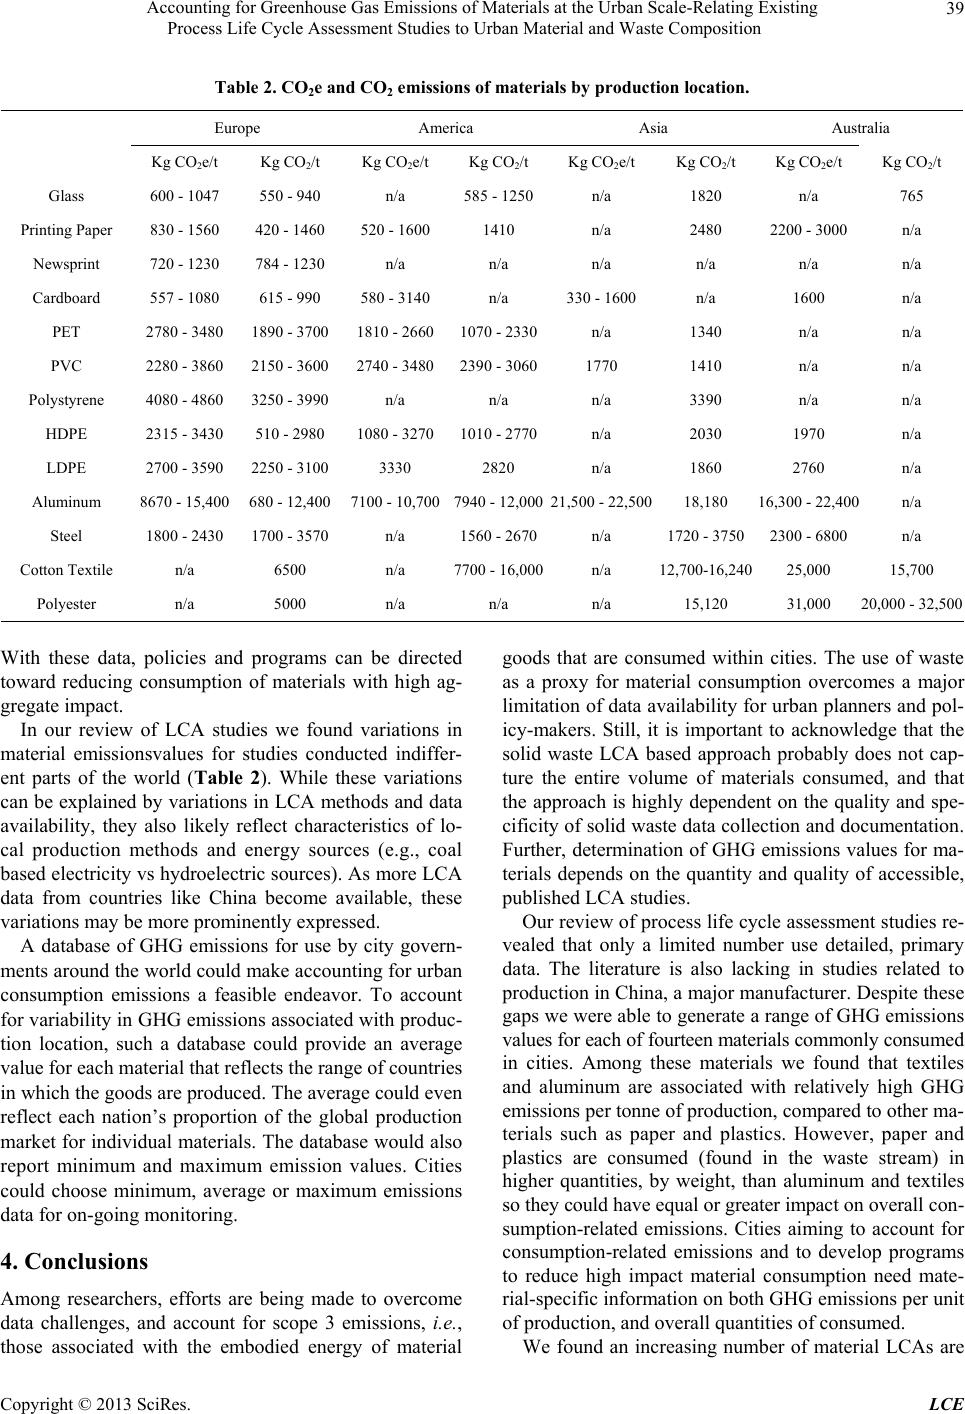 Accounting for Greenhouse Gas Emissions of Materials at the Urban Scale-Relating Existing Process Life Cycle Assessment Studies to Urban Material and Waste Composition Copyright © 2013 SciRes. LCE 39 Table 2. CO2e and CO2 emissions of materials by production location. Australia Asia America Europe Kg CO2/t Kg CO2e/t Kg CO2/t Kg CO2e/t Kg CO2/t K g CO2e/t Kg CO2/t Kg CO2e/t 765 n/a 1820 n/a 585 - 1250 n/a 550 - 940 600 - 1047 Glass n/a 2200 - 3000 2480 n/a 1410 520 - 1600 420 - 1460 830 - 1560 Printing Paper n/a n/a n/a n/a n/a n/a 784 - 1230 720 - 1230 Newsprint n/a 1600 n/a 330 - 1600 n/a 580 - 3140 615 - 990 557 - 1080 Cardboard n/a n/a 1340 n/a 1070 - 23301810 - 26601890 - 3700 2780 - 3480 PET n/a n/a 1410 1770 2390 - 30602740 - 34802150 - 3600 2280 - 3860 PVC n/a n/a 3390 n/a n/a n/a 3250 - 3990 4080 - 4860 Polystyrene n/a 1970 2030 n/a 1010 - 27701080 - 3270510 - 2980 2315 - 3430 HDPE n/a 2760 1860 n/a 2820 3330 2250 - 3100 2700 - 3590 LDPE n/a 16,300 - 22,400 18,180 21,500 - 22,5007940 - 12,0007100 - 10,700680 - 12,400 8670 - 15,400 Aluminum n/a 2300 - 6800 1720 - 3750 n/a 1560 - 2670n/a 1700 - 3570 1800 - 2430 Steel 15,700 25,000 12,700-16,240 n/a 7700 - 16,000n/a 6500 n/a Cotton Textile 20,000 - 32,50031,000 15,120 n/a n/a n/a 5000 n/a Polyester With these data, policies and programs can be directed toward reducing consumption of materials with high ag- gregate impact. In our review of LCA studies we found variations in material emissionsvalues for studies conducted indiffer- ent parts of the world (Table 2). While these variations can be explained by variations in LCA methods and data availability, they also likely reflect characteristics of lo- cal production methods and energy sources (e.g., coal based electricity vs hydroelectric sources). As more LCA data from countries like China become available, these variations may be more prominently expressed. A database of GHG emissions for use by city govern- ments around the world could make accounting for urban consumption emissions a feasible endeavor. To account for variability in GHG emissions asso ciated with produc- tion location, such a database could provide an average value for each material that reflects the range of countries in which th e goods are pr oduc ed . Th e av e r ag e co u ld ev en reflect each nation’s proportion of the global production market for individual materials. The database would also report minimum and maximum emission values. Cities could choose minimum, average or maximum emissions data for on-go ing monitoring. 4. Conclusions Among researchers, efforts are being made to overcome data challenges, and account for scope 3 emissions, i.e., those associated with the embodied energy of material goods that are consumed within cities. The use of waste as a proxy for material consumption overcomes a major limitation of data availability fo r urban planners and pol- icy-makers. Still, it is important to acknowledge that the solid waste LCA based approach probably does not cap- ture the entire volume of materials consumed, and that the approach is highly dependent on the quality and spe- cificity of solid waste data co llection and documentation . Further, determination of GHG emissions values for ma- terials depends on the quantity and quality of accessible, published LCA studies. Our review of process life cycle assessment studies re- vealed that only a limited number use detailed, primary data. The literature is also lacking in studies related to production in China, a major manufacturer. Despite these gaps we were able to generate a range of GHG emissions values for each of fourteen materials commonly cons umed in cities. Among these materials we found that textiles and aluminum are associated with relatively high GHG emissions per tonne of production, compared to other ma- terials such as paper and plastics. However, paper and plastics are consumed (found in the waste stream) in higher quantities, by weight, than aluminum and textiles so they could have equal or greater impact on overall con- sumption-related emissions. Cities aiming to account for consumption-related emissions and to develop programs to reduce high impact material consumption need mate- rial-specific information on both GHG emissions per unit of production, and overall quantities of consumed. We found an increasing number of material LCAs are  Accounting for Greenhouse Gas Emissions of Materials at the Urban Scale-Relating Existing Process Life Cycle Assessment Studies to Urban Material and Waste Composition 40 being conducted or commissioned by commercial and in- dustrial associations such as the World Aluminum Asso- ciation, the European Container Glass Federation or the European plastic producers association. Individual com- panies are also publishing information on the GHG emis- sions of their products. Perhaps more industry based stud- ies will become available as carbon taxes and cap and trade systems are expanded. Consumer pressure for more ecologically benign products may also encourage more reporting. We see the material LCA approach as a valuable, ac- cessible approach for cities working to assess, monitor and develop policy to reduce their consumption based contributions to global GHG emissions. 5. Acknowledgements This research was funded through a grants from the So- cial Sciences and Humanities Research Council to Wil- liam Rees (Getting Serious About Urban Sustainability 410-2007-0473), and the Foreign Affairs and Interna- tional Trade Canada (DFAIT) fellowship to Meidad Kis- singer (“Understanding Canada-Canadian Studies Pro- gram”). REFERENCES [1] G. L. R. Brown, “Eco-Economy: Building an Economy for the Earth,” Norton, New York, 2001. [2] N. Grimm, S. Faeth, N. Golubiewski, C. Redman, J. Wu, X. Bai and J. Briggs, “Global Change and the Ecology of Cities,” Science, Vol. 319, No. 5864, 2008, pp. 756-760. doi:10.1126/science.1150195 [3] W. E. Rees, “Cities as Dissipative Structures: Global Change and the Vulnerability of Urban Civilization,” In: M. P. Weinstein and R. E. Turner, Eds., Sustainability Sc i- ence: The Emerging Paradigm and the Urban Environ- ment, Springer, New York, 2012, pp. 247-273. [4] World Bank, “Cities and Climate Change: An Urgent Agenda,” Urban Development Series Knowledge Papers, Vol. 10, International Bank for Reconstruction and De- velopment, World Bank, Washington DC, 2010. [5] P. Newman, T. Beatley and H. Boyer, “Resilient Cities: Responding to Peak Oil and Climate Change,” Island P re s s, Washington DC, 2009. [6] J. Moore, “Measuring Cli mate Action in Vancouver: Co m- paring a City’s Greenhouse Gas Emissions Inventory Pro- tocol to the Inventory of Consumption,” In: B. Richard- son, Ed., Local Climate Change Law: Environmental Re- gulation in Cities and Other Localities, Edward Elgar Publishing Ltd., Cheltenham, 2012. [7] D. Dodman, “Blaming Cities for Climate Change? An Analysis of Urban Greenhouse Gas Emissions Invento- ries,” Environment and Urbanization, Vol . 21, No. 1, 2009, pp. 185-201. doi:10.1177/0956247809103016 [8] S. Bastioni, F. Pulsellini and E. Tiezzi, “The Problem of Assigning Responsibility for Greenhouse Gas Emissions,” Ecological Economics, Vol. 49, No. 4, 2004, pp. 253-257. doi:10.1016/j.ecolecon.2004.01.018 [9] J. Feng, “Allocating the Responsibility of CO2 Over-Emis- sions from the Perspectives of Benefit Principle and Eco- logical Deficit,” Ecological Economics, Vol. 46, No. 1, 2003, pp. 121-141. doi:10.1016/S0921-8009(03)00104-6 [10] J. Munksgard and K. A. Pedersen, “CO2 Accounts for Open Economies: Producer or Consumer Responsibility?” Energy Polic y, Vol. 29, No. 4, 2001, pp. 327-334. doi:10.1016/S0301-4215(00)00120-8 [11] ICLEI, “International Local Government Greenhouse Gas Emissions Analysis Protocol—Version 1.0,” 2009. [12] R. Barthelmie, S. Morris and P. Schechter, “Carbon Neu- tral Biggar: Calculating the Community Carbon Footprint and Renewable Energy Options for Footprint Reduction,” Sustainability Science, Vol. 3, No. 2, 2008, pp. 267-282. doi:10.1007/s11625-008-0059-8 [13] C. Kennedy, J. Steinberger, B. Gasson, Y. Hansen, T, Hillman, M. Havranek, D. Pataki, D. Phdungsilp, A. Ra- maswami and G. Mendez, “Greenhouse Gas Emissions from Global Cities,” Environmental Science and Tech- nology, Vol. 43, No. 19, 2009, pp. 7297-7302. doi:10.1021/es900213p [14] J. Bi, R. Zhang, H. Wang, M. Liu and Y. Wu, “The Benchmarks of Carbon Emissions and Policy Implica- tions for China’s Cities: Case of Nanjing,” Energy Policy, Vol. 39, No. 9, 2011, pp. 4785-4794. doi:10.1016/j.enpol.2011.06.045 [15] C. Kennedy, J. Cuddihy and J. Engel-Yan, “The Chang- ing Metabolism of Cities,” Journal of Industrial Ecology, Vol. 11, No. 2, 2007, pp. 43-59. doi:10.1162/jie.2007.1107 [16] T. Hillman and A. Ramaswami, “Greenhouse Gas Emis- sion Footprints and Energy Use Benchmarks for Eight US Cities,” Environmental Science and Technology, Vol. 44, No. 6, 2010, pp.1902-1910. doi:10.1021/es9024194 [17] Y. Yang and S. Suh, “Environmental Impacts of Prod- ucts in China,” Environmental Science and Technology, Vol. 45, No. 14, 2011, pp. 4102-4109. doi:10.1021/es103206g [18] A. Druckman and T. Jackson, “The Carbon Footprint of UK Households 1990-2004: A Socio-economically Dis- aggregated, Quasi-multi-regional Input-output Model,” Eco- logical Economics, Vol. 68, No. 6, 2009, pp. 2066-2077. doi:10.1016/j.ecolecon.2009.01.013 [19] M. Lenzen and G. Peters, “How City Dwellers Affect Their Resource Hinterland—A Spatial Impact Study of Australian Household,” Journal of Industrial Ecology, Vol. 14, No. 1, 2009, pp. 73-90. doi:10.1111/j.1530-9290.2009.00190.x [20] J. Munksgaard, M. Wier, M. Lenzen and C. Dey, “Using Input-Output Analysis to Measure the Environme ntal Pr es - sure of Consumption at Different Spatial Levels,” Journal of Industrial Ecology, Vol. 9, No. 1-2, 2005, pp. 169-185. doi:10.1162/1088198054084699 [21] J. Moore, M. Kissinger and W. E. Rees, “An Urban Me- Copyright © 2013 SciRes. LCE  Accounting for Greenhouse Gas Emissions of Materials at the Urban Scale-Relating Existing Process Life Cycle Assessment Studies to Urban Material and Waste Composition Copyright © 2013 SciRes. LCE 41 tabolism Assessment of Metro Vancouver,” Journal of Environmental Management, in Press. [22] M. Kissinger and A. Haim, “Urban Hinterlands: The Case of an Israeli Town Ecological Footprint,” Environment Development and Sustainability, Vol. 10, No. 4, 2008, pp. 391-405. doi:10.1007/s10668-006-9071-2 [23] J. Barrett, H. Vallack, A. Jones and G. Haq, “A Material Flow Analysis and Ecological Footprint of York,” Stock- holm Environmental Institute, Stockholm, 2001. [24] C. Simmons, K. Lewis and J. Barrett, “Two Feet—Two Approaches: A Component-Based Model of Ecological Footprinting,” Ecological Economics, Vo l . 32, N o . 3 , 2000, pp. 375-380. [25] C. Simmons and N. Chambers, “Footprinting UK House- holds: How Big Is Your Ecological Garden?” Local En- vironment, Vol. 3, No. 3, 1998, pp. 355-362. doi:10.1080/13549839808725571 [26] N. Chambers, C. Simmons and M. Wackernagel, “Shar- ing Natures Interest,” Earthscan, London, 2000. [27] APC, “Kerbside Domestic Waste and Recycling Audit,” APC Environmental Management, Sydney, 2009. [28] IMEP, “Israel Ministry of Environmental Protection, 2005 Waste Composition Study,” 2006. [29] B. Vigon, “Euro pean Platform on Life cy cle Assessment ,” Society of Environmental Toxicology and Chemistry, Vol. 7, No. 2, 2006, pp. 39-40. [30] European Commission—Joint Research Centre—Institute for Environment and Sustainability, “International Refer- ence Life Cycle Data System (ILDC) Handbook—Rec- ommendations for Life Cycle Impact Assessment in the European Context,” Publications Office of the European Union, Luxemburg, 2011. 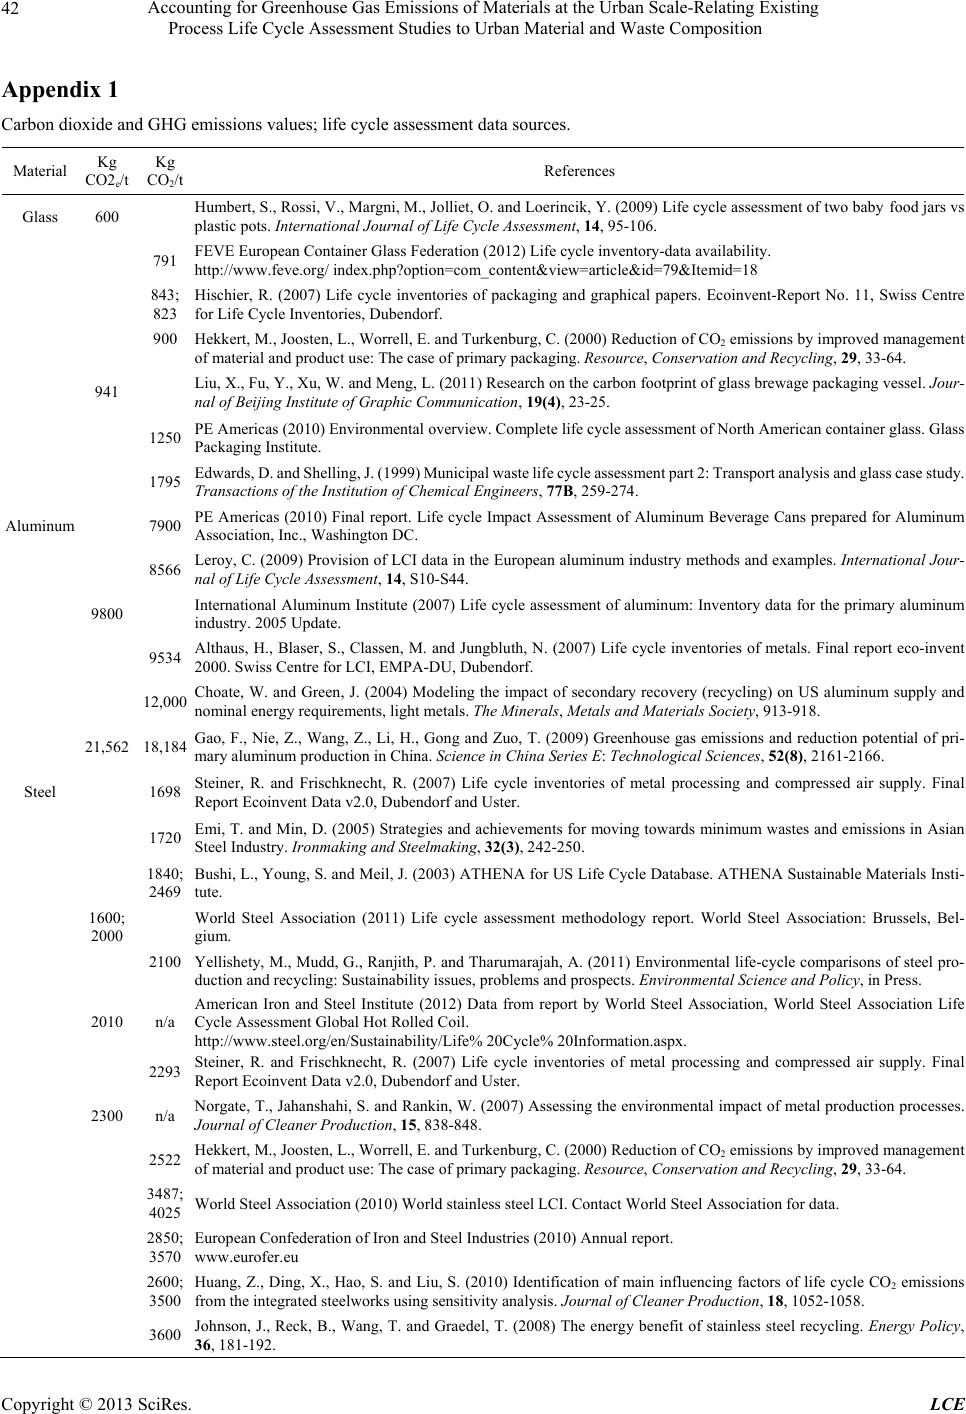 Accounting for Greenhouse Gas Emissions of Materials at the Urban Scale-Relating Existing Process Life Cycle Assessment Studies to Urban Material and Waste Composition 42 Appendix 1 Carbon dioxide and GHG emissions values; life cycle assessment data sources. Material Kg CO2e/t Kg CO2/t References Glass 600 Humbert, S., Rossi, V., Margni, M., J olliet, O. and Loerincik, Y. (2009) Life cycle assessment of two baby food jars vs plastic pots. International Journal of Life Cycle Assessment, 14, 95-106. 791 FEVE European Container Glass Federation (2012) Life cycle inventory-data availability. http://www.feve.org/ index.php?option=com_content&view=article&id=79&Itemid=18 843; 823 Hischier, R. (2007) Life cycle inventories of packaging and graphical papers. Ecoinvent-Report No. 11, Swiss Centre for Life Cycle I n ventories, Dubend o rf. 900 Hekkert, M., Joosten, L., Worrell, E. and Turkenburg, C. (2000) Reduction of CO2 emissions by improved management of material and product use: The case of primar y p a c k a g i n g . Resource, Conservation and Recycling, 29, 33-64. 941 Liu, X., Fu, Y., Xu, W. and Meng, L. (2011) Research on the carbon footprint of glass brewage packaging vessel. Jour- nal of Beijing Institute of Graphic Communication, 19(4), 23-25. 1250 PE Americas (2010) Environmental overview. Complete life cycle assessment of North American container glass. Glass Packaging Institute. 1795 Edwards, D. and Shelling, J. (1999) M unicipal waste life cycle ass essment part 2: Transport an alysis and glas s case study. Transactions of the Institution of Chemical Engineers, 77B, 259-274. Aluminum 7900 PE Americas (2010) Final report. Life cycle Impact Assessment of Aluminum Beverage Cans prepared for Aluminum Association, Inc., Washington DC. 8566 Leroy, C. (2009) Provision of LCI data in the European aluminum industry methods and examples. International Jour- nal of Life Cycle Assessment, 14, S10-S44. 9800 International Aluminum Institute (2007) Life cycle assessment of aluminum: Inventory data for the primary aluminum industry. 2005 Update. 9534 Althaus, H., Blaser, S., Classen, M. and Jungbluth, N. (2007) Life cycle inventories of metals. Final report eco-inven 2000. Swiss Centre f o r LCI, EMPA-DU, Dubendorf. 12,000 Choate, W. and Green, J. (2004) Modeling the impact of secondary recovery (recycling) on US aluminum supply and nominal energy requirements, light metals. The Minerals, Metals and Materials Society, 913-918. 21,562 18,184 Gao, F., Nie, Z., Wang, Z., Li, H., Gong and Zuo, T. (2009) Greenhouse gas emissions and reduction potential of pri- mary aluminum production in Chi na. Science in China Series E: Technological Sciences, 52(8), 2161-2166. Steel 1698 Steiner, R. and Frischknecht, R. (2007) Life cycle inventories of metal processing and compressed air supply. Final Report Ecoinvent Data v2. 0, Dubendorf and Uste r. 1720 Emi, T. and Min, D. (2005) Strategies and achievements for moving towards minimum wastes and emissions in Asian Steel Industry. Ironmaking and Steelmaking , 32(3), 242-250. 1840; 2469 Bushi, L., Young, S. and Meil, J. (2003) ATHENA for US Life Cycle Database. ATHENA Sustainable Materials Insti- tute. 1600; 2000 World Steel Association (2011) Life cycle assessment methodology report. World Steel Association: Brussels, Bel- gium. 2100 Yellishety, M., Mudd, G., Ranjith, P. and Tharumarajah, A. (2011) Environmental life-cycle comparisons of steel pro- duction and recycling: Sustainability issues, problems and prospects. Environmental Science and Policy, in Press. 2010 n/a American Iron and Steel Institute (2012) Data from report by World Steel Association, World Steel Association Life Cycle Assessment Global Hot Rolled Coil. http://www.steel.org/en/Sustainability/Life% 20Cycle% 20Information.aspx. 2293 Steiner, R. and Frischknecht, R. (2007) Life cycle inventories of metal processing and compressed air supply.Final Report Ecoinvent Data v2. 0, Dubendorf and Uste r. 2300 n/a Norgate, T., Jahanshahi, S. and Rankin, W. (2007) Assessing the environmental impact of metal production processes. Journal of Cleaner Production, 15, 838-848. 2522 Hekkert, M., Joosten, L., Worrell, E. and Turkenburg, C. (2000) Reduction of CO2 emissions by improved management of material and product use: The case of primar y p a c k a g i n g . Resource, Conservation and Recycling, 29, 33-64. 3487; 4025 World Steel Association (2010) World stainless steel LCI. Contact World Steel Association for data. 2850; 3570 European Confederation of Iron and Steel Industries (2010) An nual report. www.eurofer.eu 2600; 3500 Huang, Z., Ding, X., Hao, S. and Liu, S. (2010) Identification of main influencing factors of life cycle CO2 emissions from the integrated steelworks using sensitivity analysis. Journal of Cleaner Production, 18, 1052-1058. 3600 Johnson, J., Reck, B., Wang, T. and Graedel, T. (2008) The energy benefit of stainless steel recycling. Energy Policy, 36, 181-192. Copyright © 2013 SciRes. LCE 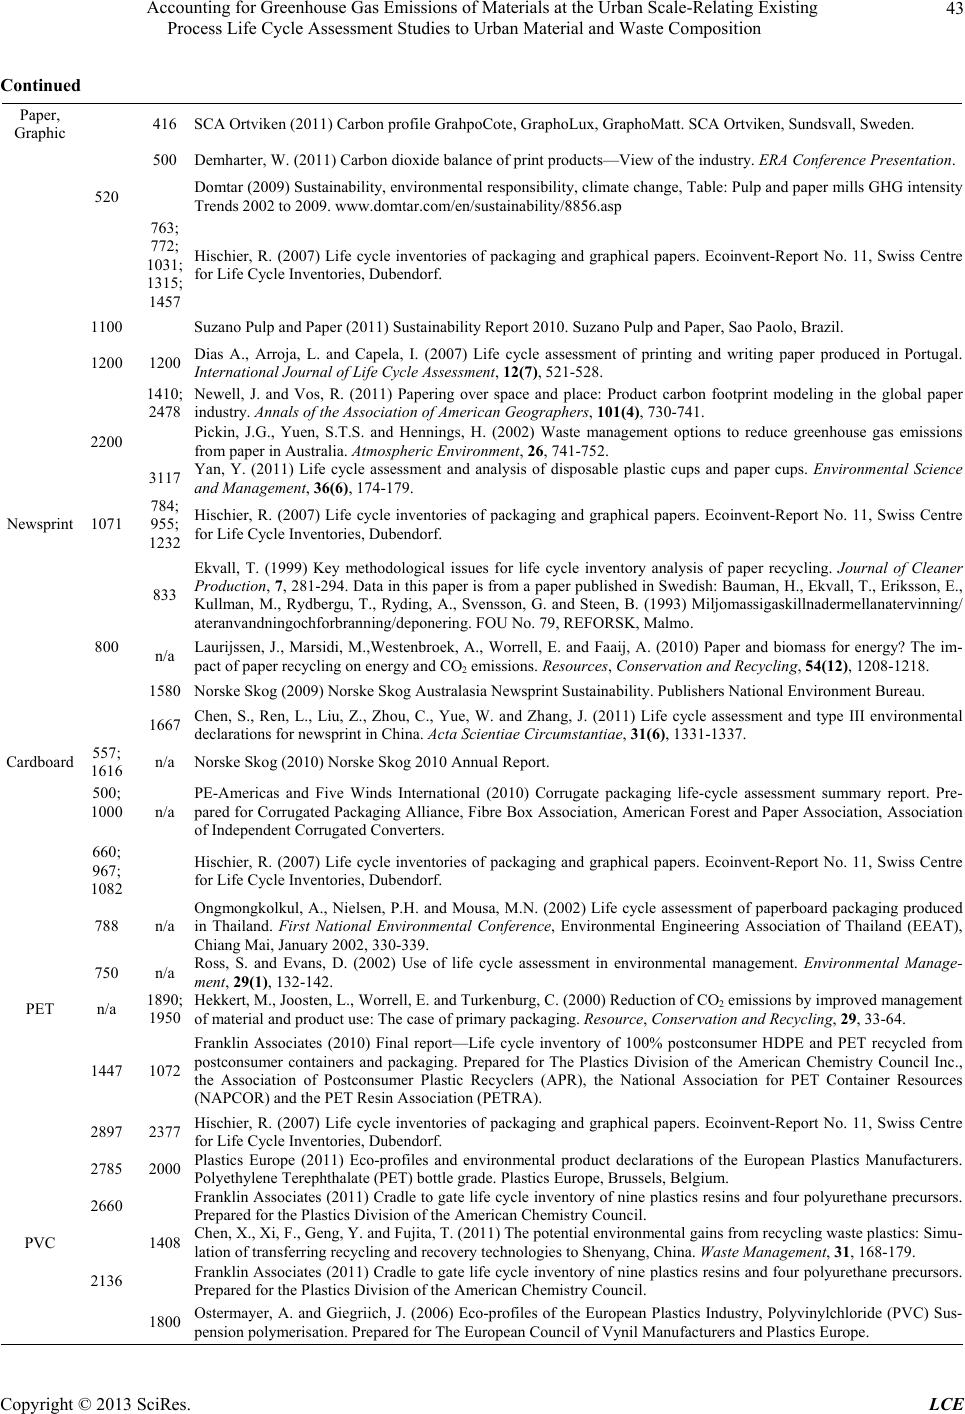 Accounting for Greenhouse Gas Emissions of Materials at the Urban Scale-Relating Existing Process Life Cycle Assessment Studies to Urban Material and Waste Composition 43 Continued Paper, Graphic 416 SCA Ortviken (2011) Carbon profile GrahpoCote, GraphoLux, GraphoMatt. SCA Ortviken, Sundsvall, Sweden. 500 Demharter, W. (2011) Carbon dioxide bala nce of print products—View of the industry. ERA Conference Presentation. 520 Domtar (2009) Sustainability, environmental responsibility, climate change, Table: Pulp and paper mills GHG intensity Trends 2002 to 2009. www.domtar.com/en/sustainability/8856.asp 763; 772; 1031; 1315; 1457 Hischier, R. (2007) Life cycle inventories of packaging and graphical papers. Ecoinvent-Report No. 11, Swiss Centre for Life Cycle I n ventories, Dubend o rf. 1100 Suzano Pulp and Paper (2011) Sustainability Report 2010. Suzano Pulp and Paper, Sao Paolo, Brazil. 1200 1200 Dias A., Arroja, L. and Capela, I. (2007) Life cycle assessment of printing and writing paper produced in Portugal. International Journal of Life Cycle Assessment, 12(7), 521-528. 1410; 2478 Newell, J. and Vos, R. (2011) Papering over space and place: Product carbon footprint modeling in the global pape industry. Annals of the Association of American Geographers, 101(4), 730-741. 2200 Pickin, J.G., Yuen, S.T.S. and Hennings, H. (2002) Waste management options to reduce greenhouse gas emissions from paper in Australia. Atmospheric Environment, 26, 741-752. 3117 Yan, Y. (2011) Life cycle assessment and analysis of disposable plastic cups and paper cups. Environmental Science and Management, 36(6), 174-179. Newsprint 1071 784; 955; 1232 Hischier, R. (2007) Life cycle inventories of packaging and graphical papers. Ecoinvent-Report No. 11, Swiss Centre for Life Cycle I n ventories, Dubend o rf. 833 Ekvall, T. (1999) Key methodological issues for life cycle inventory analysis of paper recycling. Journal of Cleane Production, 7, 281-294. Data in this paper is from a paper published in Swedish: Bauman, H., Ekvall, T., Eriksson, E., Kullman, M., Rydbergu, T., Ryding, A., Svensson, G. and Steen, B. (1993) Miljomassigaskillnadermellanatervinning ateranvandningochforbranning/deponering. FOU No. 79, REFORSK, Malmo. 800 n/a Laurijssen, J., Marsidi, M.,Westenbroek, A., Worrell, E. and Faaij, A. (2010) Paper and biomass for energy? The im- pact of paper recycling on energy a n d C O2 emissions. Resources, Conservation and Recycling, 54(12), 1208-1218. 1580 Norske Skog (2009) Norske Skog Australasia Newsprint Sustainability. Publishers National Environment Bureau. 1667 Chen, S., Ren, L., Liu, Z., Zhou, C., Yue, W. and Zhang, J. (2011) Life cycle assessment and type III environmental declarations for newsprint in China. Acta Scientiae Circumstantiae, 31(6), 1331-1337. Cardboard 557; 1616 n/a Norske Skog (2010) Norske Skog 2010 Annual Report. 500; 1000 n/a PE-Americas and Five Winds International (2010) Corrugate packaging life-cycle assessment summary report. Pre- pared for Corrugated Packaging Alliance, Fibre Box Association, American Forest and Paper Association, Association of Independent Corrugated Converters. 660; 967; 1082 Hischier, R. (2007) Life cycle inventories of packaging and graphical papers. Ecoinvent-Report No. 11, Swiss Centre for Life Cycle I n ventories, Dubend o rf. 788 n/a Ongmongkolkul, A., Nielsen, P.H. and Mousa, M.N. (2002) Life cycle assessment of paperboard packaging produce in Thailand. First National Environmental Conference, Environmental Engineering Association of Thailand (EEAT), Chiang Mai, January 2002, 330- 3 3 9 . 750 n/a Ross, S. and Evans, D. (2002) Use of life cycle assessment in environmental management. Environmental Manage- ment, 29(1), 132-142. PET n/a 1890; 1950 Hekkert, M., Joosten, L. , W orrell, E. and Turkenburg, C. (2000) Reduction of CO2 emissions by im proved managemen of material and product use: The case of primar y p a c k a g i n g . Resource, Conservation and Recycling, 29, 33-64. 1447 1072 Franklin Associates (2010) Final report—Life cycle inventory of 100% postconsumer HDPE and PET recycled from postconsumer containers and packaging. Prepared for The Plastics Division of the American Chemistry Council Inc., the Association of Postconsumer Plastic Recyclers (APR), the National Association for PET Container Resources (NAPCOR) and the PET Resin Association (PETRA). 2897 2377 Hischier, R. (2007) Life cycle inventories of packaging and graphical papers. Ecoinvent-Report No. 11, Swiss Centre for Life Cycle I n ventories, Dubend o rf. 2785 2000 Plastics Europe (2011) Eco-profiles and environmental product declarations of the European Plastics Manufacturers. Polyethylene Terephthalate (PET) bottle grade. Plastics Europe, Brussels, Belgium. 2660 Franklin Associates (2011) Cradle to gate life cycle inventory of nine plastics resins and four polyurethane precursors. Prepared for the Plastics Division of the American Chem i st ry Council. PVC 1408 Chen, X., Xi, F., Geng, Y. and Fujita, T. (2011) The potential environmental gains from recycling waste plastics: Simu- lation of transferring recycling and recovery technologies to Shenyang, China. Waste Management, 31, 168-179. 2136 Franklin Associates (2011) Cradle to gate life cycle inventory of nine plastics resins and four polyurethane precursors. Prepared for the Plastics Division of the American Chem i st ry Council. 1800 Ostermayer, A. and Giegriich, J. (2006) Eco-profiles of the European Plastics Industry, Polyvinylchloride (PVC) Sus- pension polymerisation. Prepared for The European Council of Vynil Manufacturers and Plastics Europe. Copyright © 2013 SciRes. LCE 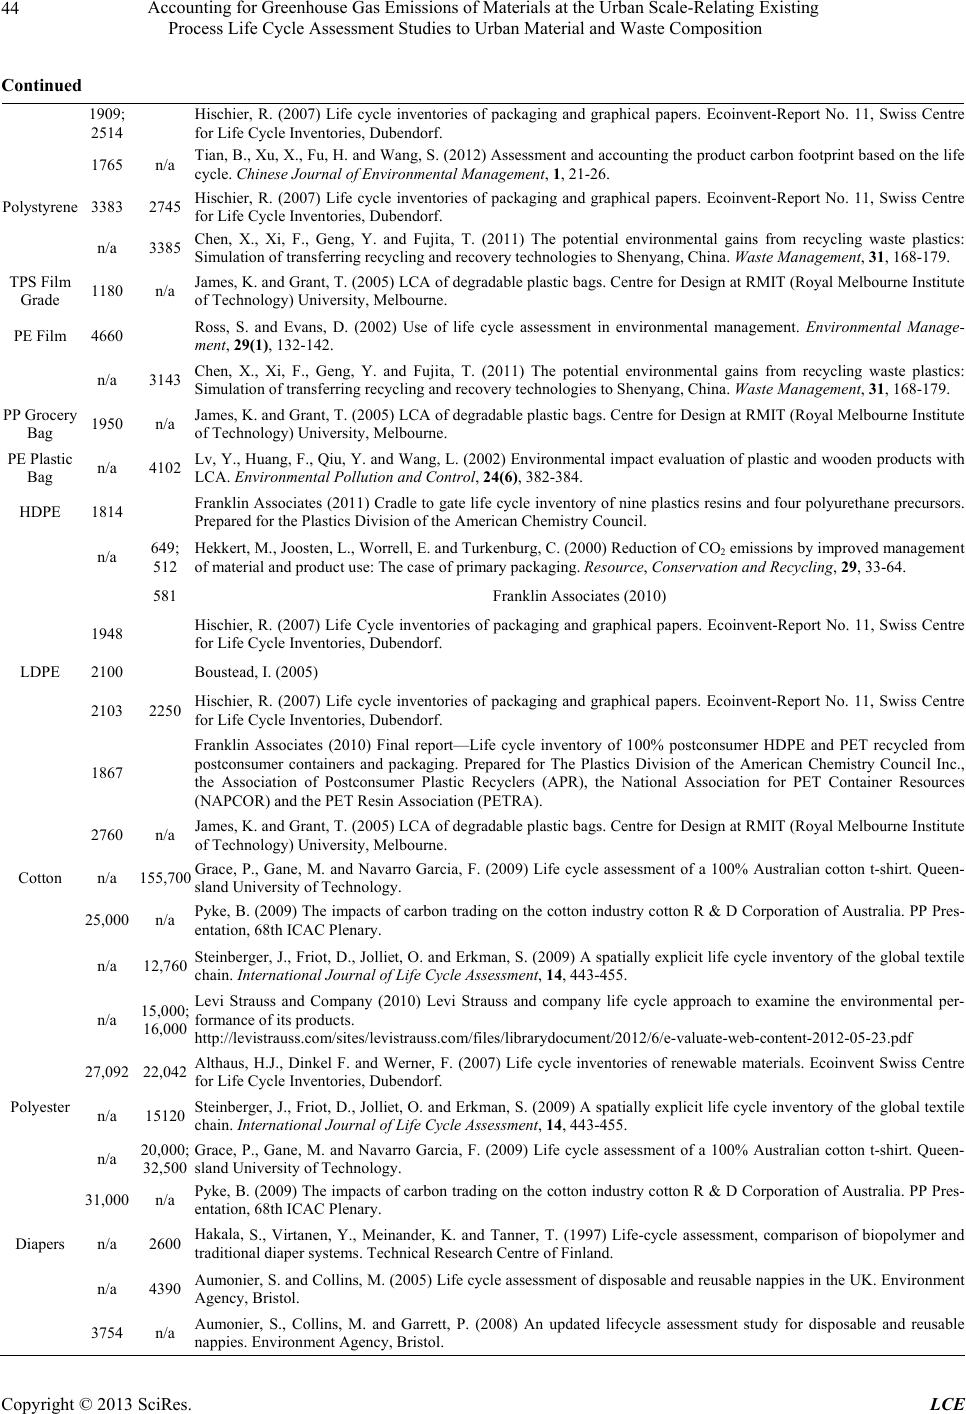 Accounting for Greenhouse Gas Emissions of Materials at the Urban Scale-Relating Existing Process Life Cycle Assessment Studies to Urban Material and Waste Composition Copyright © 2013 SciRes. LCE 44 Continued 1909; 2514 Hischier, R. (2007) Life cycle inventories of packaging and graphical papers. Ecoinvent-Report No. 11, Swiss Centre for Life Cycle I n ventories, Dubend o rf. 1765 n/a Tian, B., Xu, X., Fu, H. and Wang, S. (2012)Assessment and accounting the product carbon footprint based on the life cycle. Chinese Journal of Environmental Management, 1, 21-26. Polystyrene 3383 2745 Hischier, R. (2007) Life cycle inventories of packaging and graphical papers. Ecoinvent-Report No. 11, Swiss Centre for Life Cycle I n ventories, Dubend o rf. n/a 3385 Chen, X., Xi, F., Geng, Y. and Fujita, T. (2011) The potential environmental gains from recycling waste plastics: Simulation of transferring recycling and recovery technologies to Shenyang, China. Waste Management, 31, 168-179. TPS Film Grade 1180 n/a James, K. and Grant, T. (2005) LCA of degradable plastic bags. Centre for Design at RMIT (Royal Melbourne Institute of Technology) University, Melbourne. PE Film 4660 Ross, S. and Evans, D. (2002) Use of life cycle assessment in environmental management. Environmental Manage- ment, 29(1), 132-142. n/a 3143 Chen, X., Xi, F., Geng, Y. and Fujita, T. (2011) The potential environmental gains from recycling waste plastics: Simulation of transferring recycling and recovery technologies to Shenyang, China. Waste Management, 31, 168-179. PP Grocery Bag 1950 n/a James, K. and Grant, T. (2005) LCA of degradable plastic bags. Centre for Design at RMIT (Royal Melbourne Institute of Technology) University, Melbourne. PE Plastic Bag n/a 4102 Lv, Y., Huang, F., Qiu, Y. and Wang, L. (2002) Environmental impact evaluation of plastic and wooden products with LCA. Environmental Pollution and Control, 24(6), 382-384. HDPE 1814 Franklin Associates (2011) Cradle to gate life cycle inventory of nine plastics resins and four polyurethane precursors. Prepared for the Plastics Division of the American Chem i st ry Council. n/a 649; 512 Hekkert, M., Joosten, L., Worrell, E. and Turkenburg, C. (2000) Reduction of CO2 emissions by improved management of material and product use: The case of primar y p a c k a g i n g . Resource, Conservation and Recycling, 29, 33-64. 581 Franklin Associates (2010) 1948 Hischier, R. (2007) Life Cycle inventories of packaging and graphical papers. Ecoinvent-Report No. 11, Swiss Centre for Life Cycle I n ventories, Dubend o rf. LDPE 2100 Boustead, I. (2005) 2103 2250 Hischier, R. (2007) Life cycle inventories of packaging and graphical papers. Ecoinvent-Report No. 11, Swiss Centre for Life Cycle I n ventories, Dubend o rf. 1867 Franklin Associates (2010) Final report—Life cycle inventory of 100% postconsumer HDPE and PET recycled from postconsumer containers and packaging. Prepared for The Plastics Division of the American Chemistry Council Inc., the Association of Postconsumer Plastic Recyclers (APR), the National Association for PET Container Resources (NAPCOR) and the PET Resin Association (PETRA). 2760 n/a James, K. and Grant, T. (2005) LCA of degradable plastic bags. Centre for Design at RMIT (Royal Melbourne Institute of Technology) University, Melbourne. Cotton n/a 155,700 Grace, P., Gane, M. and Navarro Garcia, F. (2009) Life cycle assessment of a 100% Australian cotton t-shirt. Queen- sland University of Technology. 25,000 n/a Pyke, B. (2009) The impacts of carbon trading on the cotton industry cotton R & D Corporation of Australia. PP Pres- entation, 68th ICAC Plenary. n/a 12,760 Steinberger, J., Friot, D., Jolliet, O. and Erkman, S. (2009) A spatially explicit life cycle inventory of the global textile chain. International Journal of Life Cycle Assessment, 14, 443-455. n/a 15,000; 16,000 Levi Strauss and Company (2010) Levi Strauss and company life cycle approach to examine the environmental per- formance of it s p roducts. http://levistrauss.com/sites/levistrauss.com/files/librarydocument/2012/6/e-valuate-web-content-2012-05-23.pdf 27,092 22,042 Althaus, H.J., Dinkel F. and Werner, F. (2007) Life cycle inventories of renewable materials. Ecoinvent Swiss Centre for Life Cycle I n ventories, Dubend o rf. Polyester n/a 15120 Steinberger, J., Friot, D., Jolliet, O. and Erkman, S. (2009) A spatially explicit life cycle inventory of the global textile chain. International Journal of Life Cycle Assessment, 14, 443-455. n/a 20,000; 32,500 Grace, P., Gane, M. and Navarro Garcia, F. (2009) Life cycle assessment of a 100% Australian cotton t-shirt. Queen- sland University of Technology. 31,000 n/a Pyke, B. (2009) The impacts of carbon trading on the cotton industry cotton R & D Corporation of Australia. PP Pres- entation, 68th ICAC Plenary. Diapers n/a 2600 Hakala, S., Virtanen, Y., Meinander, K. and Tanner, T. (1997) Life-cycle assessment, comparison of biopolymer and traditional diaper systems. Technical Research Centre of Finland. n/a 4390 Aumonier, S. and Collins, M. (2005) Life cycle assessment of disposable and reusable nappies in the UK. Environment Agency, Bristol. 3754 n/a Aumonier, S., Collins, M. and Garrett, P. (2008) An updated lifecycle assessment study for disposable and reusable nappies. Environment Agency, Bristol.
|