Paper Menu >>
Journal Menu >>
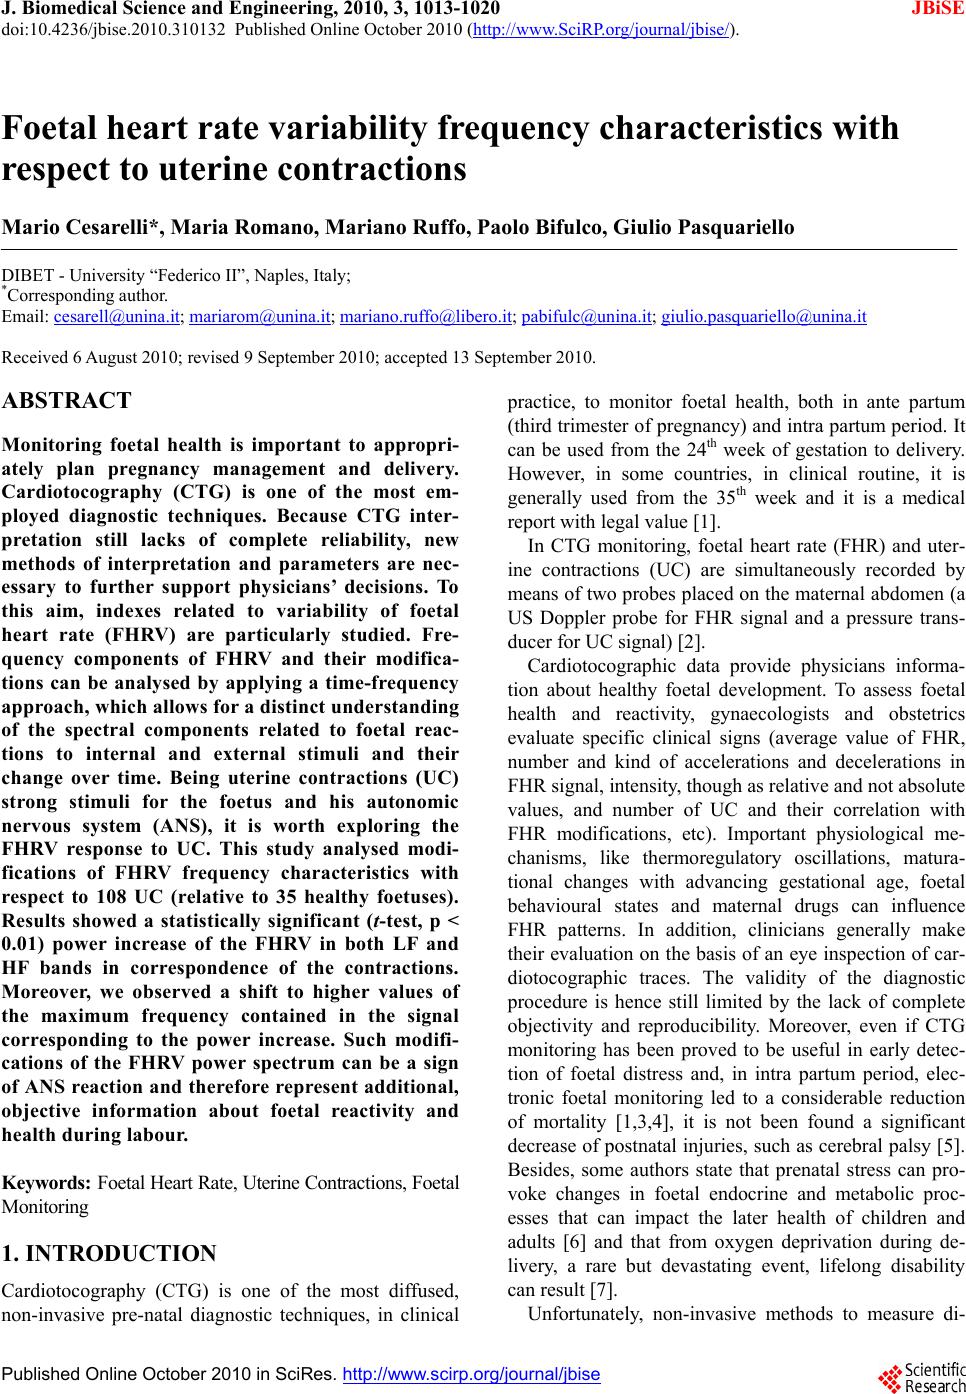 J. Biomedical Science and Engineering, 2010, 3, 1013-1020 JBiSE doi:10.4236/jbise.2010.310132 Published Online October 2010 (http://www.SciRP.org/journal/jbise/). Published Online October 20 10 in SciRes. http://www.scirp.org/journal/jbise Foetal heart rate variability frequency characteristics with respect to uterine contractions Mario Cesarelli*, Maria Romano, Mariano Ruffo, Paolo Bifulco, Giulio Pasquariello DIBET - University “Federico II”, Naples, Italy; *Corresponding author. Email: cesarell@unina.it; mariarom@unina.it; mariano.ruffo@libero.it; pabifulc@unina.it; giulio.pasquariello@unina.it Received 6 August 2010; revised 9 September 2010; accepted 13 September 2010. ABSTRACT Monitoring foetal health is important to appropri- ately plan pregnancy management and delivery. Cardiotocography (CTG) is one of the most em- ployed diagnostic techniques. Because CTG inter- pretation still lacks of complete reliability, new methods of interpretation and parameters are nec- essary to further support physicians’ decisions. To this aim, indexes related to variability of foetal heart rate (FHRV) are particularly studied. Fre- quency components of FHRV and their modifica- tions can be analysed by applying a time-frequency approach, which allows for a distinct understanding of the spectral components related to foetal reac- tions to internal and external stimuli and their change over time. Being uterine contractions (UC) strong stimuli for the foetus and his autonomic nervous system (ANS), it is worth exploring the FHRV response to UC. This study analysed modi- fications of FHRV frequency characteristics with respect to 108 UC (relative to 35 healthy foetuses). Results showed a statistically significant (t-test, p < 0.01) power increase of the FHRV in both LF and HF bands in correspondence of the contractions. Moreover, we observed a shift to higher values of the maximum frequency contained in the signal corresponding to the power increase. Such modifi- cations of the FHRV power spectrum can be a sign of ANS reaction and therefore represent additional, objective information about foetal reactivity and health during labour. Keywords: Foetal Heart Rate, Uterine Contractions, Foetal Monitoring 1. INTRODUCTION Cardiotocography (CTG) is one of the most diffused, non-invasive pre-natal diagnostic techniques, in clinical practice, to monitor foetal health, both in ante partum (third trimester of pregnancy) and intra partum period. It can be used from the 24th week of gestation to delivery. However, in some countries, in clinical routine, it is generally used from the 35th week and it is a medical report with legal value [1]. In CTG monitoring, foetal heart rate (FHR) and uter- ine contractions (UC) are simultaneously recorded by means of two probes placed on the maternal abdomen (a US Doppler probe for FHR signal and a pressure trans- ducer for UC signal) [2]. Cardiotocographic data provide physicians informa- tion about healthy foetal development. To assess foetal health and reactivity, gynaecologists and obstetrics evaluate specific clinical signs (average value of FHR, number and kind of accelerations and decelerations in FHR signal, intensity, though as relative and not absolute values, and number of UC and their correlation with FHR modifications, etc). Important physiological me- chanisms, like thermoregulatory oscillations, matura- tional changes with advancing gestational age, foetal behavioural states and maternal drugs can influence FHR patterns. In addition, clinicians generally make their evaluation on the basis of an eye inspection of car- diotocographic traces. The validity of the diagnostic procedure is hence still limited by the lack of complete objectivity and reproducibility. Moreover, even if CTG monitoring has been proved to be useful in early detec- tion of foetal distress and, in intra partum period, elec- tronic foetal monitoring led to a considerable reduction of mortality [1,3,4], it is not been found a significant decrease of postnatal injuries, such as cerebral palsy [5]. Besides, some authors state that prenatal stress can pro- voke changes in foetal endocrine and metabolic proc- esses that can impact the later health of children and adults [6] and that from oxygen deprivation during de- livery, a rare but devastating event, lifelong disability can result [7]. Unfortunately, non-invasive methods to measure di-  1014 M. Cesarelli et al. / J. Biomedical Science and Engineering 3 (2010) 1013-1020 Copyright © 2010 SciRes. JBiSE rectly the foetal acid-base status and cerebral oxygena- tion do not exist and clinicians have to rely upon indirect measures. Therefore, more detailed information about the foetal status is necessary and can be particularly useful during the last period of gestation and labour. To achieve this aim, several analysis methodologies have been proposed in recent years [3,8-10]. In particu- lar, great interest has been dedicated to the analysis of FHR variability (FHRV), which, like so for adults, could be a base for a more powerful, detailed and objective analysis, both in ante partum and in intra partum period [2,11-14]. The study of autonomic rhythms by FHR re- cordings may provide a sight into the foetal development of autonomic nervous system (ANS) [6]. Changes in FHR control, elicited by the ANS in re- sponse to foetal hypoxia, were reported in literature [3, 15]. A UC is a strong compressive stimulus; it provokes an acute hypoxic stress to the foetus and generally elicits reactions in the FHR. It is well known that FHR decel- erations are often associated with UC and that their characteristics are of great interest for physicians [4]. Moreover, although the FHR is subject to numerous in- fluences, UC is the only input which can be externally monitored [7]. Interest in studying UC reactions is also outlined by recent studies in which UC were elicited by an oxitocin challenge test to explore the consequent blood flow changes [2,16,17]. In conclusion, it is worth investigating FHRV modifications, which reflect reac- tions of foetal ANS to UC, in order to have more com- prehensive information about the insult and the foetal ability to withstand it. This could provide additional and objective information about foetal health and then sup- port clinical diagnosis. Concerning FHRV estimation, even if, as it is known, it can be analysed both in time domain and in frequency domain, the power spectral density (PSD) seems to be the index that best recovers all the information present in the heart rate (HR) series [18]. Spectral analysis pro- vides a tool for quantifying rather small changes in FHRV in response to internal or external stimuli that may remain undetected if only visual interpretation of FHR tracings is used. Among most common methods employed to estimate PSD, parametric and non-pa- rametric, we can mention Short-time Fourier transform (STFT); Auto Regressive methods (AR); Fast Recursive least square algorithms (RLS) [2,12,14,19], wavelet transform [20] and Lomb method [21]. Supported by previous results [1, 22], this study aimed to analyse more in depth spectral modifications in the FHRV signal (by means of STFT) in response to UC for healthy foetuses, which may help in the understanding of specific foetal reactivity, capability and modality of foe- tal compensation to hypoxic stress, by using the natural disturbance caused by UC. In particular, considering physiological cases, we would highlight the specific modification pattern of FHRV power spectrum, here regarded as ANS response. In future works, this pattern could be compared to patterns corresponding to patho- logical conditions in order to define a new classification criterion. 2. METHODS 2.1. Data Collection CTG were recorded during routine foetal monitoring, in an Italian public hospital, from 35 healthy pregnant women (singleton pregnancies), close to delivery (33-42 gestation weeks), who did not take drugs and having no known genetic malformations; subjects laid down in a rest position. In line with clinical practice, CTG signals lasting less than 20 min or excessively noisy signals were excluded from our database (at the moment popu- lated by about 600 CTG). 35 CTG recordings were gathered for this study, 3 intra partum and the others with evident UC. On average, CTG recordings have a duration of about 30 minutes. At birth, Apgar scores, birth weights and other information were collected in order to involve in the analysis only CTG regarding healthy foetuses: in particular, enrolled infants had Ap- gar scores > = 7 at 1st minute and > = 9 at 5th minute, birth weights (ranging from 2.7 to 4.25 Kg) appropriate for the gestational age and no one needed neonatal in- tensive care unit treatment. Cardiotocographic signals were acquired using HP-135x or Sonicaid cardiotocographs, equipped with an ultrasound Doppler probe to detect FHR signals (measured in beats per minute-bpm) and a pressure transducer to record UC signals (measured in mmHg). Both probes were placed upon maternal abdomen. In HP cardiotocographs, FHR and UC signals are in- ternally stored at 4 Hz (corresponding to a sampling in- terval of 250 ms). On the contrary, in Sonicaid cardioto- cograph, FHR and UC signals are unevenly stored. Both devices provide a three-level signal which indicates the ‘quality’ of the received Doppler signal, which can result optimal, acceptable or insufficient (the latter corre- sponding to signal loss). In both cases, recorded data are transferred to the output serial port of the device that was connected to a laptop PC through a serial (RS232) con- nection. 2.2. Signal Selection CTG recordings with evident UC were chosen for the analysis; as done in previous works of the authors [1, 22]. UC were selected respecting specific criteria in order to reduce the physiological variability and to achieve a sort of uniformity for the UC stimuli. In particular, only  M. Cesarelli et al. / J. Biomedical Science and Engineering 3 (2010) 1013-1020 1015 Copyright © 2010 SciRes. JBiSE uterine contractions of pronounced amplitude (at least 40 mmHg with respect to the resting tone), isolated (at least 130 s must elapse between the end and the start of two subsequent contractions), corresponding to good FHR and UC signal quality were considered for the analysis. About 100 UC, compliant with the above-mentioned specifications were enrolled in the analysis. In order to carry out a quantitative comparison be- tween the FHRV power spectrum modifications related to UC with respect to a reference condition, two kinds of time segments of the same length (231 samples, about 57 s) were selected; let us call them: ‘reference-segments’, chosen before the UC onset and ‘UC-segments’, chosen in correspondence of the UC (slightly retarded with re- spect to the UC apex) (please, refer to the previous pub- lication for more detailed information [1]). Figure 1 offers an example of CTG signals and cho- sen segments. 2.3. Pre-Processing Before FHR signal processing, it is worth mentioning that, because CTG is acquired in a clinical setting, it is subject to specific noises; for example, the loss of probe contact can temporarily interrupt the recording. More- over, FHR signals are intrinsically uneven series; each FHR value is computed as inverse of the time between two consecutive R waves, so that FHR values are avail- able only when new heart beats occur. To obtain evenly sampled series, some commercial cardiotocographs (e.g. HP-135x) use a zero-order interpolation, that is each sample is held constant until the next heart beat occurs. This is an efficient solution for FHR time-domain analyses (accelerations and/or decelerations detection, etc) but can introduce alterations in the FHR power spectrum [18,22]. To overcome these limitations, CTG recordings were pre-processed, by means of an algorithm previously developed by the authors, in order to select re- liable FHR segments, to eliminate possible artifacts related to the Doppler technique and, only when necessary, to get rid of the zero-order interpolation [23-25]. 2.4. FHRV Time-Frequency Analysis According to literature and previous works [1,7,22], we considered the FHR power spectrum mainly composed of a DC component (average of the FHR), a very low frequency (VLF) band (0-0.03 Hz) and FHR variability (FHRV) at higher frequencies. Therefore, FHRV signals were obtained evaluating (and then subtracting) components at lower fre- quencies by means of a smoothing cubic spline. After that, because of the non-stationary behaviour of the FHRV signal, a time-varying frequency analysis by means of STFT had been carried out considering sliding Hamming windows of 128 samples (corresponding to 32 s) and using 99% overlap (window length was chosen according to literature [26]). Figure 1. Example of CTG recording (from the top, FHR and UC signals) during labour, subject #12—week 40th. It is possible to recognise three UC, which were selected according to the required criteria. Couples of vertical dashed lines represent start and end of reference segments and vertical solid lines represent start and end of UC segments.  1016 M. Cesarelli et al. / J. Biomedical Science and Engineering 3 (2010) 1013-1020 Copyright © 2010 SciRes. JBiSE Finally, to concisely describe spectral modifications against time, the power associated with LF (0.03-0.2 Hz) and HF (0.2-1 Hz) bands was computed, for each time instant, PLF (t) and PHF(t), as expressed by [1]: 0.2 2 0.03 12 0.2 1 ()( ,) 1 ()( ,) LF HF P tSftdf T P tSftdf T (1) where, S (f, t) represents the time-varying spectral esti- mation of the FHRV signal and T is the time interval considered [1]. In order to highlight a common foetal ANS response to UC in a physiological situation, we also performed an average of LF and HF power signals (computed both for UC and references segments). 2.5. FHRV Frequency Content To further characterise PSD modifications of FHRV sig- nals related to UC, we carried out an analysis to detect, at each time instant, the maximum frequency bin con- tained in the signal’s spectrum. To this aim, we used the “Modified Crossing Threshold Method”, based on D’Alessio’s algorithm [22,27,28]. The method considers that the tail of the spectrum gives information on the level of noise present in the signal, since white noise is equally spread over all frequency. An estimation of the noise made in the tail of the spectrum is then used for setting a threshold. The magnitude of each bin of the spectrum is compared with the threshold and when the magnitudes of two successive bins are higher than the threshold, the first bin is considered as the maximum frequency bin. We evaluated the noise level using the bins from 14 to 32 of a 128 FFT array (corresponding to the frequency range from about 0.4 Hz to 1 Hz). The selected frequency range to evaluate the noise depends on the method used in evaluating the FHR and its spec- trum array [27], which could substantially modify the far tail of the spectrum. The algorithm threshold is com- puted multiplying this estimation of noise for an integer factor; we heuristically chose a value of 5, which means that the probability value for which a sample crosses the threshold is less than 1% in presence of only noise [28]. 2.6. Statistic Analysis A Student’s t-test was employed to check the statistic separation between the analysed FHRV spectral popula- tions (power in the different bands and frequency con- tent of UC-segments and reference-segments; levels of statistical significance were always set at p value < 0.01). For power estimation in HF band, we chose the fixed range 0.2-1 Hz, without considering the computed vari- able maximum frequency bin, in order to take into ac- count noise contribution both for UC and ref segments. 3. RESULTS As an example, Figure 2 reports a spectrogram Figure 2(a) of a FHRV time-frequency distribution, obtained by STFT method, together with the corresponding CTG signal (FHR in Figure 2(c) and UC in Figure 2(b)). As illustrated by Figure 2(a) the FHRV power in- creases in correspondence of UC. It is worth noting that this increase does not corre- spond, in the time domain, to a clear modification of the floating-line (id est, in the FHR signal there are no al- terations, such as accelerations or decelerations, that could justify the power increase). Furthermore, to present concise results, obtained av- erage powers of LF and HF bands of FHRV power spec- trum, estimated both for selected UC segments and ref- erence segments, are reported in Table 1. It is possible to note that average powers correspond- ing to UC-segments are higher than average powers cor- responding to reference-segments. Moreover, UC-seg- ments population resulted significantly different com- pared with reference-segments population for both FH RV power spectrum bands (t-test). Concerning the analysis of FHR frequency content, results obtained by means of Modified Crossing Thresh- old Method highlighted that an enlargement of the band (shift to a higher value of signal maximum frequency bin) corresponds to the power increase of FHRV PSD. The following Figure 3 shows an example of obtained re- sults about the comparison between the power increase and the correspondent shift of signal maximum fre- quency bin. The average behaviour has been studied also in this case and obtained results are reported in Table 2. Our average results highlighted, in correspondence of the UC, a percentage increase of the band, computed as UC seg. value - REF seg. value100 REF seg. value, of about 27%. Also in this case, UC-segments population resulted sig- nificantly different compared with reference-segments population (t-test). 4. DISCUSSIONS Cardiotocography is an established part of daily obstetric practice, to monitor foetal health, mostly in the last weeks of gestation. Clinicians regularly monitor FHR and UC for signs of at-risk (or compromised) foetal con- ditions. During labour, to assess foetal reactivity, atten- tion is focused on FHR alterations (such as decelerations) in correspondence to UC. 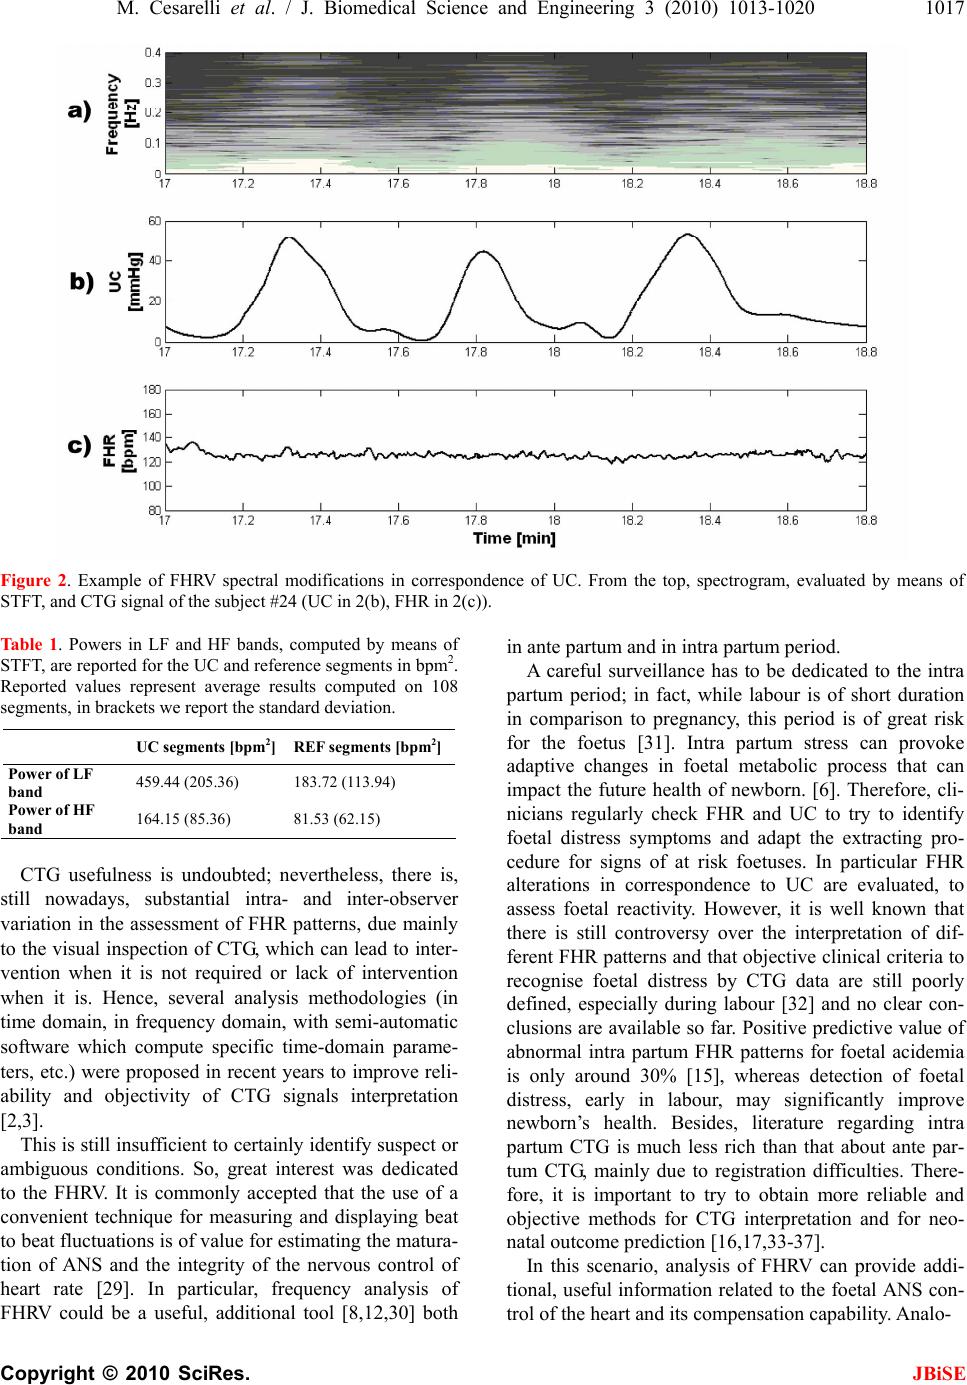 M. Cesarelli et al. / J. Biomedical Science and Engineering 3 (2010) 1013-1020 1017 Copyright © 2010 SciRes. JBiSE Figure 2. Example of FHRV spectral modifications in correspondence of UC. From the top, spectrogram, evaluated by means of STFT, and CTG signal of the subject #24 (UC in 2(b), FHR in 2(c)). Ta b le 1. Powers in LF and HF bands, computed by means of STFT, are reported for the UC and reference segments in bpm2. Reported values represent average results computed on 108 segments, in brackets we report the standard deviation. UC segments [bpm2] REF segments [bpm2] Power of LF band 459.44 (205.36) 183.72 (113.94) Power of HF band 164.15 (85.36) 81.53 (62.15) CTG usefulness is undoubted; nevertheless, there is, still nowadays, substantial intra- and inter-observer variation in the assessment of FHR patterns, due mainly to the visual inspection of CTG, which can lead to inter- vention when it is not required or lack of intervention when it is. Hence, several analysis methodologies (in time domain, in frequency domain, with semi-automatic software which compute specific time-domain parame- ters, etc.) were proposed in recent years to improve reli- ability and objectivity of CTG signals interpretation [2,3]. This is still insufficient to certainly identify suspect or ambiguous conditions. So, great interest was dedicated to the FHRV. It is commonly accepted that the use of a convenient technique for measuring and displaying beat to beat fluctuations is of value for estimating the matura- tion of ANS and the integrity of the nervous control of heart rate [29]. In particular, frequency analysis of FHRV could be a useful, additional tool [8,12,30] both in ante partum and in intra partum period. A careful surveillance has to be dedicated to the intra partum period; in fact, while labour is of short duration in comparison to pregnancy, this period is of great risk for the foetus [31]. Intra partum stress can provoke adaptive changes in foetal metabolic process that can impact the future health of newborn. [6]. Therefore, cli- nicians regularly check FHR and UC to try to identify foetal distress symptoms and adapt the extracting pro- cedure for signs of at risk foetuses. In particular FHR alterations in correspondence to UC are evaluated, to assess foetal reactivity. However, it is well known that there is still controversy over the interpretation of dif- ferent FHR patterns and that objective clinical criteria to recognise foetal distress by CTG data are still poorly defined, especially during labour [32] and no clear con- clusions are available so far. Positive predictive value of abnormal intra partum FHR patterns for foetal acidemia is only around 30% [15], whereas detection of foetal distress, early in labour, may significantly improve newborn’s health. Besides, literature regarding intra partum CTG is much less rich than that about ante par- tum CTG, mainly due to registration difficulties. There- fore, it is important to try to obtain more reliable and objective methods for CTG interpretation and for neo- natal outcome prediction [16,17,33-37]. In this scenario, analysis of FHRV can provide addi- tional, useful information related to the foetal ANS con- trol of the heart and its compensation capability. Analo- 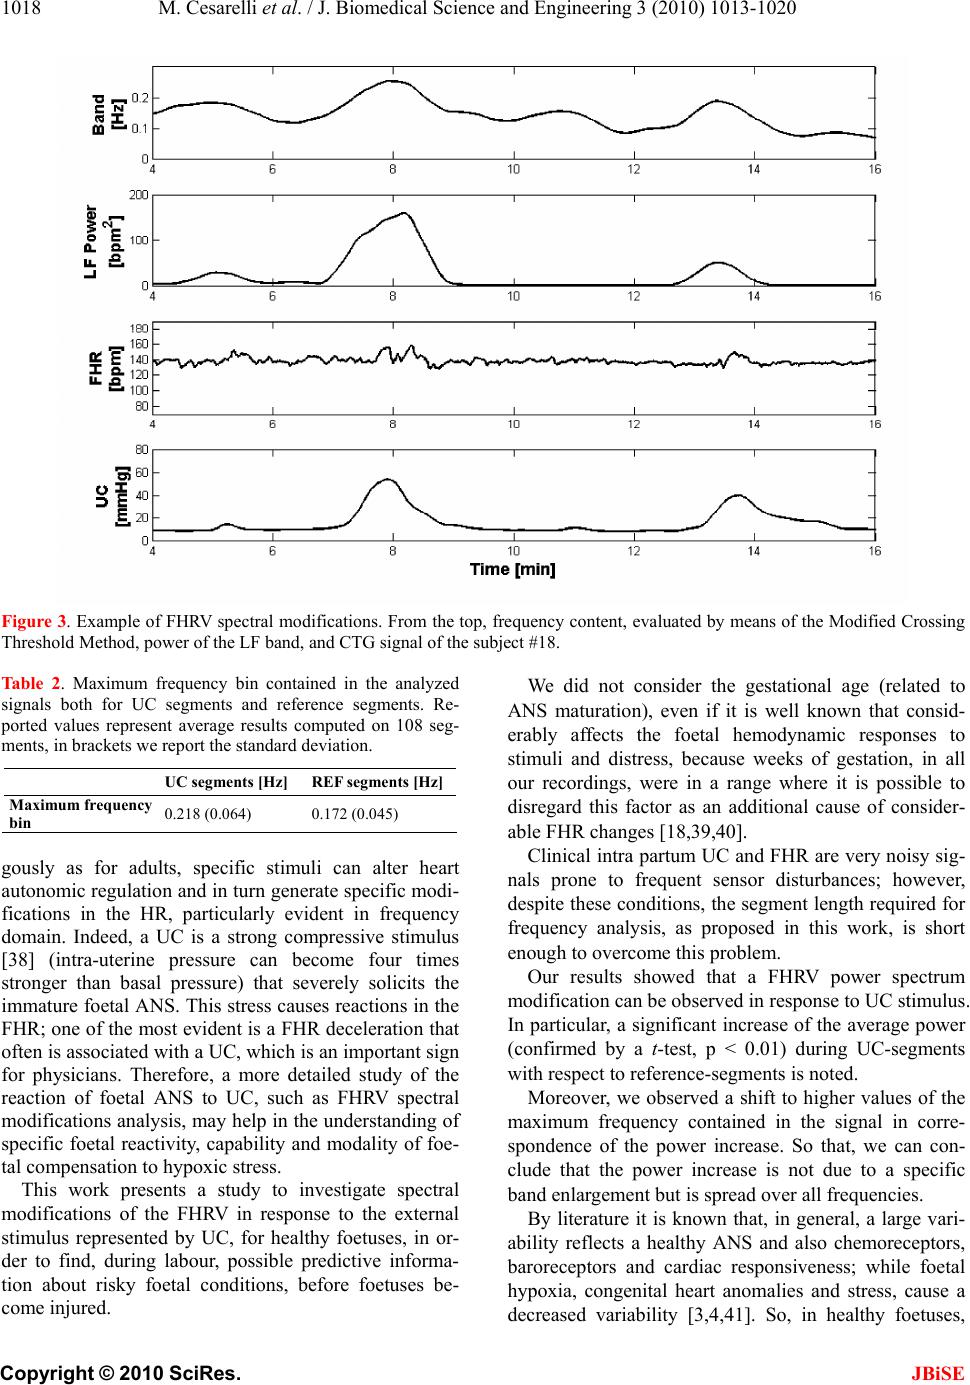 1018 M. Cesarelli et al. / J. Biomedical Science and Engineering 3 (2010) 1013-1020 Copyright © 2010 SciRes. JBiSE Figure 3. Example of FHRV spectral modifications. From the top, frequency content, evaluated by means of the Modified Crossing Threshold Method, power of the LF band, and CTG signal of the subject #18. Table 2. Maximum frequency bin contained in the analyzed signals both for UC segments and reference segments. Re- ported values represent average results computed on 108 seg- ments, in brackets we report the standard deviation. UC segments [Hz] REF segments [Hz] Maximum frequency bin 0.218 (0.064) 0.172 (0.045) gously as for adults, specific stimuli can alter heart autonomic regulation and in turn generate specific modi- fications in the HR, particularly evident in frequency domain. Indeed, a UC is a strong compressive stimulus [38] (intra-uterine pressure can become four times stronger than basal pressure) that severely solicits the immature foetal ANS. This stress causes reactions in the FHR; one of the most evident is a FHR deceleration that often is associated with a UC, which is an important sign for physicians. Therefore, a more detailed study of the reaction of foetal ANS to UC, such as FHRV spectral modifications analysis, may help in the understanding of specific foetal reactivity, capability and modality of foe- tal compensation to hypoxic stress. This work presents a study to investigate spectral modifications of the FHRV in response to the external stimulus represented by UC, for healthy foetuses, in or- der to find, during labour, possible predictive informa- tion about risky foetal conditions, before foetuses be- come injured. We did not consider the gestational age (related to ANS maturation), even if it is well known that consid- erably affects the foetal hemodynamic responses to stimuli and distress, because weeks of gestation, in all our recordings, were in a range where it is possible to disregard this factor as an additional cause of consider- able FHR changes [18,39,40]. Clinical intra partum UC and FHR are very noisy sig- nals prone to frequent sensor disturbances; however, despite these conditions, the segment length required for frequency analysis, as proposed in this work, is short enough to overcome this problem. Our results showed that a FHRV power spectrum modification can be observed in response to UC stimulus. In particular, a significant increase of the average power (confirmed by a t-test, p < 0.01) during UC-segments with respect to reference-segments is noted. Moreover, we observed a shift to higher values of the maximum frequency contained in the signal in corre- spondence of the power increase. So that, we can con- clude that the power increase is not due to a specific band enlargement but is spread over all frequencies. By literature it is known that, in general, a large vari- ability reflects a healthy ANS and also chemoreceptors, baroreceptors and cardiac responsiveness; while foetal hypoxia, congenital heart anomalies and stress, cause a decreased variability [3,4,41]. So, in healthy foetuses,  M. Cesarelli et al. / J. Biomedical Science and Engineering 3 (2010) 1013-1020 1019 Copyright © 2010 SciRes. JBiSE we expected an evident modification in FHRV frequency characteristics corresponding to a good capability of reaction to UC stimulus. Obtained results, according to that finding, should in- dicate a foetal reactivity (in terms of FHRV power spec- trum modifications with respect to the rest condition) to mechanical compressive stimulus represented by UC for healthy foetuses. Therefore, such spectral modifications, being a sign of ANS reaction, could represent additional, objective information about foetal reactivity and in turn about foetal health during labour. In a future perspective, it should be very interesting to analyse not only the average behaviour of FHR spectral modifications but also its trend during labour course in order to evaluate the individual status of a foetus and possibly to set an alarm threshold. Since foetal response is probably due to number and frequency as well as in- tensity of UC, it is important to establish a criterion for an objective and standardised measure of the stimulus intensity. In fact, let us remind that in cardiotocography only a relative measure of UC is known. However, these issues deserve a more detailed and exhaustive analysis, mainly involving problematic preg- nancies and cases of ascertained foetal distress, in order to, considering foetal health situations as point of refer- ence, to recognise specific spectral characteristics to distinguish foetal well-being and foetal distress in order to propose such methodology in daily clinical practice. 5. CONCLUSIONS The Variability of the Foetal Heart Rate around its base- line provides extremely significant information con- cerning the cardiac and ANS activities and their func- tional development during pregnancy up to labour. Our results demonstrated important modifications in the PSD of FHRV signals related to physiological stimulus rep- resented by UC, both as power and frequency content, proving that the FHRV time-frequency analysis could be a very useful tool for a more objective and depth evalua- tion of the foetal health. We would not expect to find such modifications in cases of foetal distress; therefore, if these results will be confirmed by the study of FHRV signals recorded during risky pregnancies, information about the capability of a foetus to react to stress during labour course could be obtained by means of this ap- proach. REFERENCES [1] Romano, M., Bifulco, P., Cesarelli, M., Sansone, M. and Bracale, M. (2006) Fetal heart rate power spectrum re- sponse to uterine contraction. Medical & Biological En- gineerin & Computing, 44(3), 188-201. [2] Cesarelli, M., Romano, M. and Bifulco, P. (2009) Com- parison of short term variability indexes in cardioto- cographic foetal monitoring. Computers in Biology and Medicine, 39(2), 106-118. [3] Signorini, M.G., Magenes, Cerutti, G.S. and Arduini, D. (2003) Linear and nonlinear parameters for the analysis of fetal heart rate signal from cardiotocographic re- cordings. IEEE Transaction on Biomedical Engineering, 50(3), 365-375. [4] Sweha, A. and Hacker, T.W. (1999) Interpretation of the electronic fetal heart rate during labor. American Aca- demy of Family Physician, 59(9), 2487-2500. [5] Rizzo, N., Accorsi, P., Baronciani, D., et al., “La sor- veglianza del benessere fetale in travaglio di parto. Linea guida basata su prove di efficacia Regione Emilia Ro- magna, Progetto n. 3. [6] Hoyer, D., Heinicke, E., Jaekel, S., Tetschke, F., Paolo, D.P., Haueisen, J., Schleußner, E. and Schneider, U. (2009) Indices of fetal development derived from heart rate patterns. Early Human Development, 85, 379-386. [7] Philip, A., Warrick, E.F., Hamilton, D.P. and Robert, E.K. (2009) Identification of the dynamic relationship be- tween intra-partum uterine pressure and fetal heart rate for normal and hypoxic fetuses. IEEE Transactions on Bio-Me- dical Engineering, 56(6), 1587-1597. [8] Martin, C.B. (1982) Physiology and clinical use of fetal heart rate variability. Clinics in Perinatology, 9(2), 339- 352. [9] Dawes, G.S., Meir, Y.J. and Mandruzzato, G.P. (1994) Computerized evaluation of fetal heart-rate patterns. Journal of Perinatal Medicine, 22(6), 491-499. [10] Romano, M., Cesarelli, M., Bifulco, P., Sansone, M. and Bracale, M. (2002) Development of an algorithm for homogeneous FHR signals identification. Proceedings of Embec’02 2nd European Medical and Biological Engi- neering Conference, December 2002, Vienna, Austria; II: 1542. [11] Sibony, O., Fouvillot, J.P., Benaoudia, M., Benhalla, A., Oury, J.F., Sureau, C. and Blot, P. (1994) Quantification of the heart rate variability by spectral analysis of fetal well-being and fetal distress. European Journal of Ob- stetrics & Gynecology and Reproductive Biology, 54(2), 103-108 [12] Cerutti, S., Civardi, S., Bianchi, A., Signorini, M.G., Ferrazzi, E. and Pardi, G. (1989) Spectral analysis of an- tepartum heart rate variability. Clinical Physics and Physiological Measurement, 10(Suppl B), 27-31. [13] Divon, M.Y., Muska, Y., Platt, L.D. and Paldi, E. (1984) Increased beat to beat variability during uterine contrac- tions: A common association in uncomplicated labor. Ame- rican Journal of Obstetrics and Gynecology, 149(8), 893- 896. [14] Romano, M., Bracale, M., Cesarelli, M., Campanile, M., Bifulco, P., Falco, M.D., Sansone, M. and Lieto, A.D. (2005) Antepartum cardiotocography: A study of fetal reactivity in frequency domain. Computers in Biology and Medicine, 36(6), 619-633. [15] Geijn, H.P. (1996) Developments in CTG analysis. Bail- lieres Clin Obstet Gynaecol, 10(2), 185-209. [16] Gudmudsson, S. and Olofsson, P. (2004) Acute changes of cerebral venous blood flow in growth-restricted hu- man fetuses in response to uterine contractions. Ultra-  1020 M. Cesarelli et al. / J. Biomedical Science and Engineering 3 (2010) 1013-1020 Copyright © 2010 SciRes. JBiSE sound Obstet Gynecol, 24(5), 516-521. [17] Li, H., Gudmundsson, S. and Olofsson, P. (2003) Acute increase of umbilical artery vascular flow resistance in compromised fetuses provoked by uterine contractions. Early Human Development, 74(1), 47-56. [18] Laguna, P., Moody, G.B. and Mark, R.G. (1998) Power spectral density of unevenly sampled data by least-square analysis: performance and application to heart rate sig- nals. IEEE Transactions on Biomedical Engineering, 45(6), 698-715. [19] Pola, S., Macerata, A., Emdin, M. and Marchesi, C. (1996) Estimation of the power spectral density in non- stationary cardiovascular time series: Assessing the role of the time-frequency representation (TFR). IEEE Tran- sactions on Biomedical Engineering, 43(1), 46-59. [20] Salamalekis, E., Thomopoulos, P., Giannaris, D., Salloum, I., Vasios, G., Prentza, A. and Koutsouris, D. (2002) Computerised intrapartum diagnosis of fetal hypoxia based on fetal heart rate monitoring and fetal pulse oxi- metry recordings utilising wavelet analysis and neural networks. BJOG: An International Journal of Obstetrics and Gynaecology, 109(10), 1137-1142. [21] Cesarelli, M., Romano, M., Ruffo, M., Bifulco, P., Pasquariello, G. and Fratini, A. (2009) PSD modifications of FHRV due to CTG storage rate. Proceedings of 9th International Conference on Information Technology and Applications in Biomedicine, Larnaca, Cyprus. [22] Romano, M., Cesarelli, M., Bifulco, P., Ruffo, M., Fratini, A. and Pasquariello, G. (2009) Time-frequency analysis of CTG signals. Current Development in Theory and Ap- plications of Wavelets, 3(2), 169-192. [23] Cesarelli, M., Romano, M., Bifulco, P., Fedele, F. and Bracale, M. (2007) An algorithm for the recovery of fetal heart rate series from CTG data. Computers in Biology and Medicine, 37(5), 663-669. [24] Romano, M., Cesarelli, M., Bifulco, P., Sansone, M. and Bracale, M. (2003) Study of fetal autonomous nervous system’s response by means of FHRV frequency analysis. 1st International IEEE EMBS Conference on Neural En- gineering, Capri, Italy, 399-402. [25] Hieftje, G.M., Bistroff, R.I. and Lim, R. (1973) Applica- tion of correlation analysis for signal-to-noise enhance- ment in flame spectrometry. Analytical chemistry, 45(2), 253-258. [26] Karin, J., Hirsch, M., Sagiv, C. and Akeselrod, S. (1992) Fetal autonomic nervous system activity monitoring by spectral analysis of heart rate variations. IEEE Proceed- ings of Confer ence on Computers in Cardiology, 479-482. [27] Moraes, R., Aydin, N. and Evans, D. (1995) The per- formance of three maximum frequency envelope detec- tion algorithms for Doppler signals. Journal of Vascular Investigation, 1(3), 126-134. [28] Alessio, T.D. (1985) Objective algorithm for maximum frequency estimation in Doppler spectral analysers. Medical & Biological Engineering & Computing, 23(1), 63-68. [29] David, M., Hirsch, M. and Akeselrod, S. (2006) Matura- tion of fetal cardiac autonomic control as expressed by fetal heart rate variability. IEEE Proceedings of Confer- ence on Computers in Cardiology, 901-904. [30] Oppenheimer, L.W. and Lewinsky, R.M. (1994) Power spectral analysis of fetal heart rate. Baillère's Clinical Obstetrics and Ginecology, 8(3), 643-661. [31] Logier, R., Jonckheere, J.D., Jeanne, M. and Matis, R. (2008) Fetal distress diagnosis using heart rate variability analysis: design of a high frequency variability index. IEEE Proceedings of 30th Annual International IEEE EMBS Conference Vancouver, British Columbia, 4728- 4731. [32] Cao, H., Lake, D.E., Chisholm, C.A., Ferguson, J.E., Grifin, M.P. and Moorman, J.R. (2003) Toward quantita- tive monitoring of human cardiotocography during labor. Proceedings of the 25th Annual International Conference of the IEEE EMBS, Cancun, Mexico. [33] Salamalekis, E., Vitoratos, N., Loghis, C., Panayoto- poulos, N., Kassanos, D. and Creatsas, G. (1999) Evalua- tion of fetal heart rate patterns during the second stage of labor through fetal oximetry. Gynecologic and Obstetric Investigation, 48, 151-154. [34] Zimmer, E.Z., Paz, Y., Copel, J.A. and Weiner, Z. (1998) The effect of uterine contractions on intrapartum fetal heart rate analyzed by a computerized system. American Journal of Obstetrics and Ginecology, 178(3), 436-440. [35] Jensen, O.H.R. and Narverud, G. (1994) Fetal heart rate decelerations and umbilical cord blood gas values. Euro- pean Journal of Obstetrics & Gynecology and Reproduc- tive Biology, 53(2), 103-106. [36] Padhye, N.S., Duan, Z. and Verklan, M.T. (2004) Re- sponse of fetal heart rate to uterine contractions. Pro- ceedings of the 26th Annual International Conference of the IEEE EMBS, San Francisco, 3953-3955. [37] Kodama, Y., Sameshima, H., Ikeda, T. and Ikenoue, T. (2009) Intrapartum fetal heart rate patterns in infants (≥34 weeks) with poor neurological outcome. Early Hu- man Development, 85(4), 235-238. [38] Goeschen, K. (1998) Cardiotocografia pratica. Roma, V edizione, CIC Edizioni Internazionali, Roma. [39] Rantonen, T., Ekholm, E., Siira, S., Metsala, T., Leino, R., Ekblad, U. And Valimaki, I. (2001) Periodic spectral components of fetal heart rate variability reflect the changes in cord arterial base deficit values: A preliminary report. Early Human Development, 60(3), 233-238. [40] Ohta, T., Okamura, K., Kimura, Y., Suzuki, T., Watanabe, T., Yasui, T., Yaegashi, N. and Yajima, A. (1999) Altera- tion in the low-frequency domain in power spectral analysis of fetal heart beat fluctuations. Fetal Diagnosis and Therapy, 14(2), 92-97. [41] .Geijn, H.P., Jongsma, H.W., Haan, J. and Eskes. T.K. A.B. (1980) Analysis of heart rate and beat-to-beat vari- ability: Interval difference index. American Journal of Obstetrics and Ginecology, 138(3), 246-252. |