Journal of Surface Engineered Materials and Advanced Technology, 2013, 3, 67-74
http://dx.doi.org/10.4236/jsemat.2013.31A010 Published Online February 2013 (http://www.scirp.org/journal/jsemat)
67
Carbonation Resistance and Anticorrosive Properties of
Organic Coatings for Concrete Structures
Theodosia Zafeiropoulou, Eleni Rakanta, George Batis
Department of Materials Science and Engineering, School of Chemical Engineering, National Technical University of Athens, Ath-
ens, Greece.
Email: dia_zaf@mail.ntua.gr, erakanta@central.ntua.gr, gbatis@central.ntua.gr
Received December 2nd, 2012; revised January 3rd, 2013; accepted January 11th, 2013
ABSTRACT
The present study examines the behavior of three major categories of organic coatings which are applied on the surface
of concrete structures and specifically conventional, high performance and nanotechnology paint systems. The com-
parison is achieved in the means of anticorrosion properties under the presence of chloride ions and carbonation resis-
tance. The evaluation methods included electrochemical measurements in order to assess corrosion properties and the
determination of steel’s mass loss after the end of the experimental procedure. Carbonation depth was measured using
phenolphthalein as indicator after accelerated and physical exposure. From the results so far it can be shown nano-
coatings gave promising results regarding induced chloride ion corrosion.
Keywords: Chloride Induced Corrosion; Electrochemical Measurements; Carbonation; Concrete
1. Introduction
Corrosion of steel reinforcement is one of the most sig-
nificant factors in the deterioration of reinforced concrete
structures especially those located near to marine and
industrial areas. Rebars’ corrosion, carbonation of con-
crete and chloride attack affects almost 50% the dura-
bility of concrete structures [1]. Earlier studies indicated
that reinforced concrete structures remain durable for the
whole of their design life, approximately more than 60
years [2-4], even maintenance-free. However, the corro-
sion of rebars affects the life of the concrete and thus has
rapidly become a serious problem throughout the world.
Parking structures, bridges, buildings, and other rein-
forced concrete structures exposed to aggressive envi-
ronments are being severely damaged due to corrosion of
reinforcing steel within periods as short as 10 - 20 years
[5]. The two most common mechanisms of reinforcement
corrosion are: 1) Localized destruction of the passive film
when diffused chloride ions reach the rebars surface
through porous concrete. The steel rebar inside reinforce
concrete structures is susceptible to corrosion when per-
meation of chloride from deicing salts or seawater results
in the chloride content at the surface of the steel exceed-
ing a chloride threshold level which can be defined as the
content of chloride at the steel depth that is necessary to
sustain local passive film breakdown and hence initiate
the corrosion process [6]. 2) Carbonation. Atmospheric
CO2 reacts with Ca(OH)2 under the presence of water
and as a result the alkalinity value of concrete reduces
down to 9. This pH value is leading to a general break-
down in passivity and as a result rebars are starting to
corrode [7]. Organic coatings are widely used in concrete
structures for decorative, as well as protection purposes,
since they consist of a barrier between the porous con-
crete structure and the corrosive environment. Usually,
conventional coatings based on acrylic emulsions are
used for indoor and outdoor applications and exhibit a
satisfying protection level. High-performance anticorro-
sion coatings are applied to concrete structures to provide
protection from corrosive industrial environments. Gen-
erally, they are separated into two major categories: 1)
Protective coatings applied to structures in oil, gas, pet-
rochemical and power generation industries, as well as to
bridges and water and waste treatment plants. 2) Marine
coatings applied to commercial ships, including freight
carriers, tows, cruise ships and others. Nanotechnology
coatings have recently been introduced and have been in
wide use since then due to their significant properties
which include high radiation resistance, antibacterial pro-
perties and high breathability. In order to be considered
as efficient an organic coating is demanded to have nu-
merous of properties, including low penetration values
and high mechanical resistance [8]. From the category of
traditional paints, it has been found that elastomeric
coatings can provide a satisfying protection level against
chloride corrosion and they also exhibit good physico-
chemical properties. Acrylic paints demonstrated promis-
Copyright © 2013 SciRes. JSEMAT
Carbonation Resistance and Anticorrosive Properties of Organic Coatings for Concrete Structures
68
ing results regarding induced corrosion and carbonation
[9]. It has also been reported that polyurethane coatings
are offering high resistance to the corrosion process and
chlorinated rubber coatings demonstrate an increasing
tendency regarding polarization resistance values. Epoxy
coatings are also sufficient in rebar’s protection [10].
Nanotechnology paints appeared more effective com-
pared to traditional coatings for a short period of time
regarding anticorrosive behavior and exhibited improved
physicochemical properties. In the means of adhesion
resistance it can was shown that nano-coatings were
more durable than traditional acrylic and elastomeric
dispersions [11]. However, long term corrosion inspec-
tion has not been investigated for novel coating systems
as well as anticarbonation performance and this consists
of the objective of the present study.
2. Materials
2.1. Cement Mortar Specimens
Reinforced and plain cement mortar specimens were con-
structed in the present study. The test specimens were
prepared with cement, sand and water in ratio 1:3:0.5.
The mean value of the Greek quarry sand diameter was
250 μm < d < 4 mm, the cement type used was Cement II
32.5 N and the water was drinkable from NTUA water
supply, appropriate for preparing specimens according to
ELOT 452 [12]. Cylindrical steel rebars of type B500C
with dimensions of 12 mm in diameter and 10 mm high
were used for the reinforced test specimens. The rebars
meet Greek specifications of Hellenic Organization for
Standardization, ELOT 1421-3 [13]. Fabrication of the
steel for the test specimens simply involved cutting to the
consistent length of 100 mm. The test specimens consi-
dered for the present study were cylindrical 100 mm in
height and 40 mm in diameter. Each contained one steel
rebar in the position shown in Figure 1. The cement
mortar constituents were mixed in a mortar mixer for
approximately 5 minutes, till a uniform consistency was
achieved. The molds (100 mm in height and 40 mm in
diameter) were filled with mortar and vibrated for con-
solidation using a vibrating table. Copper wire cables
were connected to the steel bar for electrochemical mea-
surements. Prior to the preparation, the steel surface was
cleaned according to the ISO/DIS 8407.3 Standard [14].
In particular the surface of the steel bars was washed
with water and then immersed in strong solution of HCl
with organic corrosion inhibitor for 15 min, washed with
water and washed thoroughly with distilled water to eli-
minate traces of the corrosion inhibitor and chloride ions.
Following that, the surface was cleaned with alcohol and
acetone and finally weighed to accuracy of 0.1 mg. There-
after, the bars were placed in cylindrical molds, as shown
in Figure 1.
The mortars were cast and stored at ambient condi-
Figure 1. Schematic representation of reinforced mortar
specimen.
tions in the laboratory for 24 hours. After being de-
molded, the specimens were placed in water in curing
room (RH > 98%, T = 20˚C ± 1.5˚C) for 24 hours and
then kept for an additional 7 days at ambient temperature,
in a laboratory environment to stabilize internal humidity,
followed by insulation with epoxy resin of the region
shown in Figure 1. Finally the specimens were partially
immersed in 3.5% wt NaCl solution, up to 20 mm from
the bottom. The objective of partially immersing the ce-
ment mortar specimens was to provide an increase of re-
quired moisture and oxygen for the initiation and acce-
leration of reinforcement corrosion. The chloride concen-
tration of the exposure solution was selected in order to
stimulate marine environment. The experimental dura-
tion of this study was 15 months.
2.2. Organic Coatings
Organic coatings were applied by brush on the dried sur-
face of the specimens at two layers, the second layer 24h
after the first one. The composition of the coatings used
is given in Table 1. Dry film thickness of all coatings
was measured using ultrasonic thickness gauge meter
according to ASTM D 6132-08 [14] Standard Test Me-
thod [15]. Three different organic coatings were tested
from each major category. For conventional coatings an
acrylic paint, an elastomeric-acrylic resin dispersion and
a silicon-acrylic paint were used. Apart from the resin,
there are differences in other technical characteristics
such as in density or viscosity of every coating. Regard-
ing high performance coatings in the present study an
epoxy, a polyurethane and a chlorinated rubber coating
were evaluated, which exhibit different characteristics
and they are also applied in variant cases. Finally, for
nanotechnology paint systems a siloxane coating, a pure
acrylic paint and an elastomeric-nano acrylic coating
were contrasted with various dilution percentages and
characteristics.
3. Evaluation Methods
After the construction and the application of the coatings,
specimens were exposed to corrosive environments in
Copyright © 2013 SciRes. JSEMAT
Carbonation Resistance and Anticorrosive Properties of Organic Coatings for Concrete Structures 69
Table 1. Chemical composition of organic coatings.
Nomeclature/Thickness
(μm) Description
Ref Specimens without coating application
Conv_1/250
Acrylic paint for exterior use, acrylic resin
dispersion, solids b.w.: 61% ± 2.5%.
Diluted 10% v/v with water. Density:
1.46 ± 0.05 g/ml, viscosity: 107 ± 13 KU,
spreading rate: 9 m2/l
Conv_2/250
Solvent based primer for exterior use (solids
b.w.: 26% ± 2%) dilution 100% white spirit.
Elastomeric, insulating paint for horizontal
surfaces, acrylic resin dispersion, solids b.w.:
62% ± 1%. No dilution.
Density: 1.37 ± 0.05 g/ml, viscosity:
107 ± 13 KU, spreading rate: 1.5 m2/l
Conv_3/250
Silicon acrylic water-repellent paint, for
exterior use, silicon acrylic resins, solids
b.w.: 64% ± 1.5%. Diluted 10% v/v with
water. Density: 1.52 ± 0.04 g/ml, viscosity:
100 ± 6 KU, spreading rate: 8 ± 0.5 m2/l
HP_1/300
Two-component, anticorrosive epoxy primer
(solids 58%). Two component pure epoxy
paint, hardened with amine. Solids b.w.:
95%. Spreading rate: 6m2/kg
HP_2/400
Two-component, anticorrosive epoxy primer
(solids 58%). Two component pure epoxy
paint, hardened with amine. Solids b.w.:
95%. Two-component polyurethane paint
with aliphatic isocyanate. Solids b.v.: 54%.
Spreading rate: 9 - 11 m2/l
HP_3/250
Primer with special resins. Liquid rubber
acrylic based sealant.
Density: 1.37 ± 0.5 g/cm3
Nano_1/200
Water based siloxane self-clean coating,
solids b.v.: 50%. Diluted 10% with water.
Spreading rate: 6 - 8 m2/l
Nano_2/200
Nanotechnology paint system, 100% acrylic
resin, solids b.v.: 64%. Diluted 5% v/v with
water. Spreading rate: 6 - 9 m2/l
Nano_3/200
Primer with siloxanes in organic solvent.
Elastomeric nano-acrylic emulsion, solids
b.v.: 50% ± 3%. No dilution. Viscosity:
125 ± 5 KU, spreading rate: 5 m2/l
order to evaluate their protection level against induced
chloride corrosion and carbonation. Six reinforced speci-
mens from each coating were partially immersed in 3.5
wt% NaCl solution for 15 months and during this period
electrochemical measurements were conducted including
half-cell potential and linear polarization technique. After
the end of the exposure period the mass loss of the em-
bedded rebars was determined. Six plain cement mortar
specimens covered with each coating were exposed to
both physical and high concentration CO2 environment,
in order to determine carbonation depth.
3.1. Corrosion Evaluation
3.1.1. Half-Cell Potential Measurements (HCP)
For a period of 15 months steels’ half-cell potential was
periodically measured versus a SCE, according to ASTM
C876-87 [16]. Half-cell potential measurements of steel
rebars is the most typical procedure to the routine in-
spection of reinforced concrete structures regarding the
corrosion trend of the samples. Potential readings are
highly influenced by the surface treatment of the speci-
mens which causes changes in their resistivity, as long as
the constituents of the cement mortars remain the same
However, they are not sufficient as criterion since they
are affected by number of factors, which include polari-
zation by limited diffusion of oxygen, concrete porosity
and the presence of highly resistive layer [17].
3.1.2. Linear Polarization Technique (LPR)
Tests were conducted using a Potentiostat/Galvanostat
Model 263A from EG&G Princeton Applied Research
and an associated software package to analyze the ob-
tained data. The electrochemical parameter of polariza-
tion resistance (Rp) was defined as described in ASTM
G59-97(2009) [18]. The experimental set up was con-
sisted of three electrodes where steel rebars represented
the working electrode, saturated calomel electrode (SCE)
the reference electrode and a carbon bar served as the
counter electrode. The potential scan range was ± 10 mV
from Open Circuit Potential (OCP) and the scan rate was
0.166 mV/s. Linear Polarization technique is a corrosion
monitoring method that allows corrosion rates to be
measured directly, in real time. The technique is rapid
and non-intrusive, requiring only a connection to the re-
inforcing steel. In LPR measurements the reinforcing
steel is perturbed by a small amount from its equilibrium
potential. This can be accomplished potentiostatically by
changing the potential of the reinforcing steel by a fixed
amount, ΔE, and monitoring the current decay, ΔI, after a
fixed time. The polarization resistance, Rp, of the steel is
then calculated from Equation (1),
p
E
R
I
(1)
From which the corrosion rate, Icorr, can then be calcu-
lated

corr
1
2.303
ac
ac pp
B
IRR




(2)
where βα, βc are the anodic and cathodic Tafel slopes
respectively and Rp is the polarization resistance (Ohm).
For Stern-Geary constant B a value of 26 mV has been
adopted for active corroding steel bars and 52 mV for
passive conditions. In order to determine the corrosion
current density, icorr, the surface area, A, of steel that has
been polarized needs to be accurately known:
Copyright © 2013 SciRes. JSEMAT
Carbonation Resistance and Anticorrosive Properties of Organic Coatings for Concrete Structures
70
corr
corr
I
i
A
(3)
Obtained Rp values are highly correlated with a num-
ber of factors, including surface treatment, corrosive en-
vironment and the materials that were used for the con-
struction of the specimens. In the present study the cor-
rosive environment as well as the materials of the speci-
mens remained stable and consequently all changes to Rp
values are due to differences in the surfaces treatment.
Define abbreviations and acronyms the first time they
are used in the text, even after they have been defined in
the abstract. Abbreviations such as IEEE, SI, MKS, CGS,
sc, dc, and rms do not have to be defined. Do not use
abbreviations in the title or heads unless they are un-
avoidable.
3.2. Mass Loss Determination
To evaluate corrosion from chloride ions 6 mortar speci-
men for every coating were broken open and the final
weight of the steels after de-rusting and cleaning was
obtained. The average mass loss was calculated from the
difference between the initial and the final mass of each
steel bar.
3.3. Carbonation Resistance
Carbonation damage usually occurs when there is little
concrete cover over the reinforcing steel and proceeds
mainly by diffusion. However, it is possible for a con-
crete to carbonate even when the cover depth to the rein-
forcing steel is high and this may be due to a very open
pore structure where pores are well connected together
and allow rapid CO2 ingress. Generally, carbonation
threshold for the initiation of reinforcement corrosion is
when carbonation depth exceeds the concrete or cement
mortar cover [19].
3.3.1. Accelerated Carbonation Chamber
After 3 weeks in an accelerated carbonation chamber in
an environment of 10% v/v CO2, the specimens were
split into two halves and a phenolphthalein indicator (1%
phenolphthalein solution in ethanol) was sprayed onto
their cut surfaces in order to visualize the carbonation
front according to RILEM CPC-18 [20]. Purple colored
areas indicate uncarbonated mortar specimen whereas
carbonated areas remain colorless.
The carbonation depth that was measured after the
exposure of the specimens to an accelerated carbonation
chamber was used to calculate the carbonation coeffi-
cient K according to Equation (4) as follows [21]:
x
Kt (4)
where K is the carbonation constant (cm/s 0.5), x is the
carbonation depth (cm) and t is the time (s).
If uncoated and coated cement mortar surfaces are ex-
posed to CO2 environment for the same period of time,
then:
22
00
222
1112D
tt x xx
d
KKK
  (5)
where t0, t are the periods of time (s) for uncoated and
coated cement mortar specimens, respectively and x0, x
are the carbonation depths (cm) for uncoated and coated
cement mortar specimens, respectively, D is the diffusion
coefficient (m2/s) which in carbonated cement mortars
equals to 2.4 × 10⁸ m2/s [22] and d is the total diffusion
coefficient of the coating (m/s). Equation (5) is leading
to:
22
0
2Dx
d
x
x

(6)
It is usual to compare the resistance of the coating with
the resistance of another layer, composed of an imagi-
nary air layer. The diffusion equivalent air layer thick-
ness Sd (m) can be calculated from:
air
d
D
Sd
(7)
where Dair is the free-air diffusion coefficient which
equals to 153 × 107 m
2/s [21]. Diffusion resistance
number μ (unitless) for each coating can be calculated
from:
d
S
S
(8)
where S is the thickness of the coating (m).
3.3.2. Physical Exposure
Plain cement mortar specimens were exposed to physical
conditions in laboratory environment for a period of 15
months and the carbonation depth was measured follow-
ing the same procedure as before.
4. Results and Discussion
4.1. Corrosion Evaluation
4.1.1. Half-Cell Potential Measurements (HCP)
In Figure 2(a), are presented the corrosion potentials as a
function of exposure time for cement mortars specimens
covered with organic coatings and immersed in 3.5 wt%
NaCl solution for a period of 15 months. The figure de-
picts the best coatings from every category and uncoated
specimens for comparison reasons.
The interpretation of the results is achieved according
to Table 2 [19]. As it is shown at the end of the exposure
period all specimens presented corrosion potential values
that are indicative of severe corrosion and only HP_2
coating attained values that revealed intermediate to high
Copyright © 2013 SciRes. JSEMAT
Carbonation Resistance and Anticorrosive Properties of Organic Coatings for Concrete Structures 71
(a)
(b)
Figure 2. (a) Average half-cell potential values for six speci-
mens as a function of exposure time for reinforced cement
mortars partially immersed in 3.5 wt% NaCl solution; (b)
Comparison between conventional and nanotechnology based
coatings regarding corrosion potential after 15 months of
immersion in 3.5 wt% NaCl solution.
Table 2. Corrosion potential and corrosion condition.
Steel’s corrosion
potential vs SCE (mV) Corrosion condition
>126 Low (10% risk of corrosion)
126 to 276 Intermediate corrosion risk
<276 High (90% risk of corrosion)
<426 Severe corrosion
risk of corrosion. The best nano-coating attained lower
corrosion potentials than the traditional coating with the
best behavior, but as it is shown to Figure 2(b) nano-
coatings presented similar behavior with the other two
conventional paint systems.
For all specimens Ecorr reduction to such electronega-
tive values versus time is due to chloride induced corro-
sion and indicates that all steel rebars are in an active
corrosion state, regardless the applied coating on cement
mortars’ surface. Such electronegative values are not sur-
prising because they are in agreement with what reported
by other authors [23,24]. However, corrosion potential
measurements can be misleading because they measure
the corrosion condition and not the corrosion rate and
consequently they do not provide information regarding
the thermodynamics of the corrosion.
4.1.2. Linear Polarization Technique (LPR)
Linear polarization measurements were periodically per-
formed to six specimens for each coating and polariza-
tion resistance (Rp) values are presented in Table 3. The
given values correspond to the specimens covered with
the coatings that performed best from each category.
According to Table 4 [19], after one year of exposure
to the corrosive environment only specimens covered
with HP_2 coating remain in passive condition. Regard-
ing nano-coatings, it should be noted that Nano_1 dem-
onstrated better behavior compared to all conventional
coatings.
4.2. Mass Loss Results
The results of the weight loss of steel rebars after 15
months of partially immersion in 3.5 wt% NaCl solution
are given in Figure 3. For every coating 6 specimens
were used in order to obtain the following results.
The rebars of the cement mortar specimens that were
covered with high performance coatings indicated the
lowest mass loss values, which is in accordance with the
electrochemical results. Regarding nano-coatings, Nano_1
coating demonstrated improved behavior since it pre-
sented lower values than all conventional coatings.
4.3. Carbonation Resistance Results
4.3.1. Accelerated Carbonation Chamber
Cement mortar specimens were exposed to an acceler-
ated carbonation chamber in an environment of 10% v/v
CO2 for a period of 3 weeks. The estimation of the total
diffusion coefficient d (m/s) of the coating was per-
formed according to the Equation (6). In Table 5 are pre-
sented the results for the specimens after the exposure in
the carbonation chamber.
The coating with the best behavior towards induced
chloride ion corrosion was chosen for accelerated car-
bonation. From the results it can be observed that the
high performance coating presented no carbonation,
whereas both conventional and nano-coatings exhibited
Figure 3. Average values of gravimetric mass loss and stan-
dard deviation after 15 months of immersion in 3.5 wt%
aCl solution. N
Copyright © 2013 SciRes. JSEMAT
Carbonation Resistance and Anticorrosive Properties of Organic Coatings for Concrete Structures
Copyright © 2013 SciRes. JSEMAT
72
Table 3. Average values of polarization resistance Rp and standard deviations.
Rp (·cm2)
Time (days)
Conv_3 HP_2 Nano_1 Reference
0 121,779 ± 294 331,240 ± 512 59,937 ± 114 0
13 - 427,939 ± 709 117,624 ± 122
40 113,512 ± 174 498,795 ± 821 128,213 ± 156 22,509 ± 285
63 - 346,374 ± 483 126,609 ± 224
70 - 267,742 ± 634 103,584 ± 324
82 - 258,270 ± 456 -
94 - 384,124 ± 657 -
101 - 193,780 ± 533 175,651 ± 320 48,003 ± 331
125 148,819 ± 322 227,601 ± 240 - 33,032 ± 129
245 - 425,955 ± 612 177,030 ± 611
269 - 254,592 ± 296 -
455 161,987 ± 246 349,394 ± 509 90,116 ± 544 32,542 ± 312
479 - 454,840 ± 624 -
Table 4. Polarization resistance values and corresponding corrosion rate [19].
Rp (k·cm2) Corrosion rate
>260 Passive condition
52 - 260 Low to moderate corrosion
26 - 52 Moderate to high corrosion
<26 High corrosion rate
Table 5. Calculation of the equivalent air layer thickness, Sd.
Coating x0 (mm) x (mm) d (m/s) D (m2/s) S (μm) μ S
d (m)
Nano_1 8 7.5 4.64 × 10⁵ 2.4 × 10⁸ 200 1646 0.33
HP_2 8 0 - 2.4 × 10⁸ 400 - -
Conv_1 8 4 4 × 10⁶ 2.4 × 10⁸ 250 15,300 3.83
Conv_3 8 7.5 4.65 × 10⁵ 2.4 × 10⁸ 250 1317 0.33
carbonated areas. However, it should be noted that car-
bonation depths varied in conventional systems where
the acrylic-silicon dispersion presented almost double
value than the acrylic coating.
4.3.2. Physical Exposure
After 15 months of physical exposure, cement mortar
specimens were broken open and the carbonation depth
was measure using phenolphthalein indicator. The results
are presented in Table 6.
According to Table 6 high performance coatings did
not carbonate after 15 months of exposure whereas con-
ventional coatings and Nano-coatings were carbonated 1
mm or 2 mm. in Figure 4 are presented the measure-
ments of the carbonation depth using phenolphthalein
indicator which was sprayed in the left side of the mor-
tars. Carbonated areas were revealed after the application
of the indicator in nano and conventional coatings.
5. Conclusions
In the present study nine organic coating systems from
Carbonation Resistance and Anticorrosive Properties of Organic Coatings for Concrete Structures 73
Table 6. Carbonation depth after one year of physical ex-
posure.
Nano HP Conv
1 2 3 1 2 3 1 2 3
Ref
Carbonation
depth (mm) 2 1 1 0 0 0 1 1 23
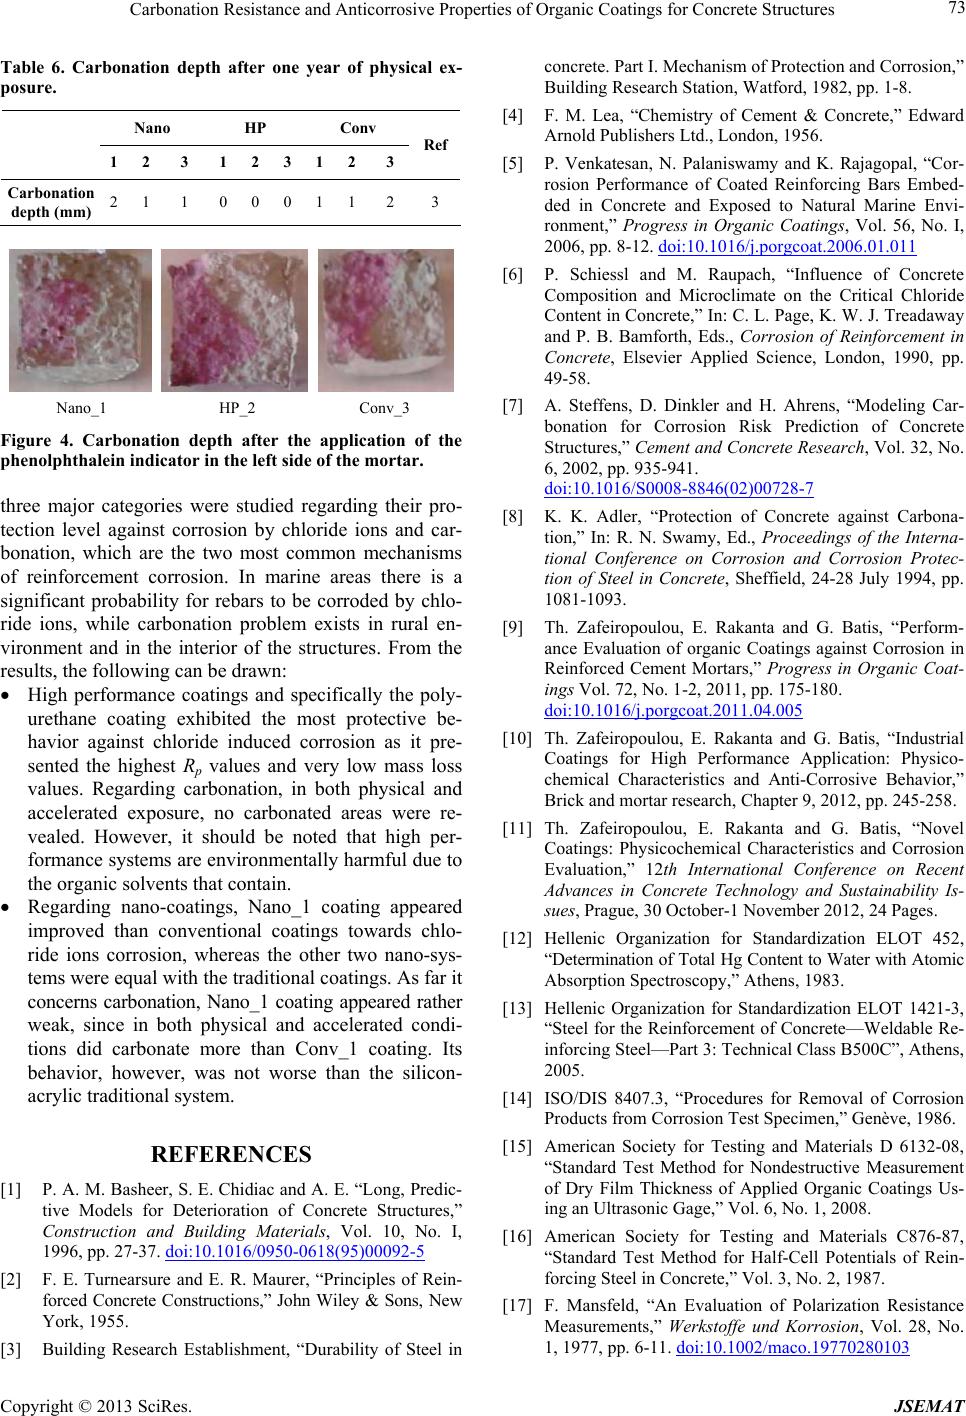
Nano_1 HP_2 Conv_3
Figure 4. Carbonation depth after the application of the
phenolphthalein indicator in the left side of the mortar.
three major categories were studied regarding their pro-
tection level against corrosion by chloride ions and car-
bonation, which are the two most common mechanisms
of reinforcement corrosion. In marine areas there is a
significant probability for rebars to be corroded by chlo-
ride ions, while carbonation problem exists in rural en-
vironment and in the interior of the structures. From the
results, the following can be drawn:
High performance coatings and specifically the poly-
urethane coating exhibited the most protective be-
havior against chloride induced corrosion as it pre-
sented the highest Rp values and very low mass loss
values. Regarding carbonation, in both physical and
accelerated exposure, no carbonated areas were re-
vealed. However, it should be noted that high per-
formance systems are environmentally harmful due to
the organic solvents that contain.
Regarding nano-coatings, Nano_1 coating appeared
improved than conventional coatings towards chlo-
ride ions corrosion, whereas the other two nano-sys-
tems were equal with the traditional coatings. As far it
concerns carbonation, Nano_1 coating appeared rather
weak, since in both physical and accelerated condi-
tions did carbonate more than Conv_1 coating. Its
behavior, however, was not worse than the silicon-
acrylic traditional system.
REFERENCES
[1] P. A. M. Basheer, S. E. Chidiac and A. E. “Long, Predic-
tive Models for Deterioration of Concrete Structures,”
Construction and Building Materials, Vol. 10, No. I,
1996, pp. 27-37. doi:10.1016/0950-0618(95)00092-5
[2] F. E. Turnearsure and E. R. Maurer, “Principles of Rein-
forced Concrete Constructions,” John Wiley & Sons, New
York, 1955.
[3] Building Research Establishment, “Durability of Steel in
concrete. Part I. Mechanism of Protection and Corrosion,”
Building Research Station, Watford, 1982, pp. 1-8.
[4] F. M. Lea, “Chemistry of Cement & Concrete,” Edward
Arnold Publishers Ltd., London, 1956.
[5] P. Venkatesan, N. Palaniswamy and K. Rajagopal, “Cor-
rosion Performance of Coated Reinforcing Bars Embed-
ded in Concrete and Exposed to Natural Marine Envi-
ronment,” Progress in Organic Coatings, Vol. 56, No. I,
2006, pp. 8-12. doi:10.1016/j.porgcoat.2006.01.011
[6] P. Schiessl and M. Raupach, “Influence of Concrete
Composition and Microclimate on the Critical Chloride
Content in Concrete,” In: C. L. Page, K. W. J. Treadaway
and P. B. Bamforth, Eds., Corrosion of Reinforcement in
Concrete, Elsevier Applied Science, London, 1990, pp.
49-58.
[7] A. Steffens, D. Dinkler and H. Ahrens, “Modeling Car-
bonation for Corrosion Risk Prediction of Concrete
Structures,” Cement and Concrete Research, Vol. 32, No.
6, 2002, pp. 935-941.
doi:10.1016/S0008-8846(02)00728-7
[8] K. K. Adler, “Protection of Concrete against Carbona-
tion,” In: R. N. Swamy, Ed., Proceedings of the Interna-
tional Conference on Corrosion and Corrosion Protec-
tion of Steel in Concrete, Sheffield, 24-28 July 1994, pp.
1081-1093.
[9] Th. Zafeiropoulou, E. Rakanta and G. Batis, “Perform-
ance Evaluation of organic Coatings against Corrosion in
Reinforced Cement Mortars,” Progress in Organic Coat-
ings Vol. 72, No. 1-2, 2011, pp. 175-180.
doi:10.1016/j.porgcoat.2011.04.005
[10] Th. Zafeiropoulou, E. Rakanta and G. Batis, “Industrial
Coatings for High Performance Application: Physico-
chemical Characteristics and Anti-Corrosive Behavior,”
Brick and mortar research, Chapter 9, 2012, pp. 245-258.
[11] Th. Zafeiropoulou, E. Rakanta and G. Batis, “Novel
Coatings: Physicochemical Characteristics and Corrosion
Evaluation,” 12th International Conference on Recent
Advances in Concrete Technology and Sustainability Is-
sues, Prague, 30 October-1 November 2012, 24 Pages.
[12] Hellenic Organization for Standardization ELOT 452,
“Determination of Total Hg Content to Water with Atomic
Absorption Spectroscopy,” Athens, 1983.
[13] Hellenic Organization for Standardization ELOT 1421-3,
“Steel for the Reinforcement of Concrete—Weldable Re-
inforcing Steel—Part 3: Technical Class B500C”, Athens,
2005.
[14] ISO/DIS 8407.3, “Procedures for Removal of Corrosion
Products from Corrosion Test Specimen,” Genève, 1986.
[15] American Society for Testing and Materials D 6132-08,
“Standard Test Method for Nondestructive Measurement
of Dry Film Thickness of Applied Organic Coatings Us-
ing an Ultrasonic Gage,” Vol. 6, No. 1, 2008.
[16] American Society for Testing and Materials C876-87,
“Standard Test Method for Half-Cell Potentials of Rein-
forcing Steel in Concrete,” Vol. 3, No. 2, 1987.
[17] F. Mansfeld, “An Evaluation of Polarization Resistance
Measurements,” Werkstoffe und Korrosion, Vol. 28, No.
1, 1977, pp. 6-11. doi:10.1002/maco.19770280103
Copyright © 2013 SciRes. JSEMAT
Carbonation Resistance and Anticorrosive Properties of Organic Coatings for Concrete Structures
Copyright © 2013 SciRes. JSEMAT
74
[18] American Society for Testing and Materials G59-
97(2009), “Standard Test Method for Conducting Poten-
tiodynamic Polarization Resistance Measurements,” Vol.
3, No. 2, 2009.
[19] RILEM CPC-18, “Measurement of Hardened Concrete
Carbonation Depth,” 1988.
[20] J. Crank, “The Mathematics of Diffusion,” Oxford Uni-
versity Press, Oxford, 1975.
[21] M. A. Sanjuαn and C. del Olmo, “Carbonation Resistance
of One Industrial Mortar Used as a Concrete Coating,”
Building and Environment, Vol. 36, No. 8, 2001, pp. 949-
953. doi:10.1016/S0360-1323(00)00045-7
[22] N. Kouloumbi and G. Batis, “The anticorrosive Effect of
Fly Ash, Slag and a Greek Pozzolan in Reinforced Con-
crete,” Cement and Concrete Composites, Vol. 16, No. 4,
1994, pp. 253-260. doi:10.1016/0958-9465(94)90037-X
[23] G. Batis, P. Pantazopoulou and A. Routoulas, “Corrosion
Protection Investigation of Reinforcement by Inorganic
Coating in the Presence of Alkanolamine-Based Inhibi-
tor,” Cement and Concrete Composites, Vol. 25, No. 3,
2003, pp. 371-377. doi:10.1016/S0958-9465(02)00061-6
[24] N. Kouloumbi and G. Batis, “The anticorrosive Effect of
Fly Ash, Slag and a Greek Pozzolan in Reinforced Con-
crete,” Cement and Concrete Composites, Vol. 16, No. 4,
1994, pp. 253-260. doi:10.1016/0958-9465(94)90037-X