 Vol.5, No.2, 285-291 (2013) Health http://dx.doi.org/10.4236/health.2013.52038 The common pentanucleotide polymorphism of the 3’-untranslated region of the leptin receptor gene is associated with obesity in Saudi females* Maha H. Daghestani1,2#, Mazin H. Daghestani3, Pinar T. Ozand4, Ahmed R. Al-Himaidi5, Mamoon H. Daghestani6, Nadia A. Aleisa1, Hana H. Hakami1, Abdelmoneim Eldali7, Ali N. Al-odaib2 1Department of Zoology, Center for Scientific and Medical Female Colleges, King Saud University, Riyadh, KSA; #Corresponding Author: mdaghestani@ksu.edu.sa, naleisa@ksu.edu, hhakami1@ksu.edu.sa 2Department of Genetics, King Faisal Specialist Hospital and Research Center, Riyadh, KSA; odaib@kfshrc.edu.sa 3Department of Obstetrics & Gynecology, Umm-Al-Qura University, Makkah, KSA; mhdaghestani@uqu.edu.sa 4Duzen Laboratories, Istanbul, Turkey; pinar.ozand@gmail.com 5Department of Zoology, Science College, King Saud University, Riyadh, KSA; ahimaidi@ksu.edu.sa 6Department of Surgery, King Abdulaziz Medical City, National Guard Health Affairs, Jeddah, KSA; mdaghist@hotmail.com 7Biostatistics, Epidemiology & Scientific Computing (MBC-03), King Faisal Specialist Hospital and Research Center, Riyadh, KSA; adalee@kfshrc.edu.sa Received 5 November 2012; revised 4 December 2012; accepted 12 December 2012 ABSTRACT Obesity is due to the combined effects of genes, environment, lifestyle, and the interactions of these factors. Leptin receptor (LEPR) gene has been intensively evaluated in the search of variants that could be related to obesity. The results of most of these studies have been con- troversial. We investigated the effects of leptin receptor gene 3’-untranslated region (3’-UTR) polymorphism on phenotype, metabolic para- meters and anthropometric measurements of obese Saudi females. 122 healthy women aged 19 to 36 years. The subjects were divided into 3 groups according to their body mass index BMI; lean (BMI 18 - 24), overweight (BMI 25 - 29) and obese (BMI ≥ 30). There were 13 homozygotes and 34 heterozygotes for the 3’-UTR insertion allele amongst all 122 women. The results of this study show that the allele frequency of the in- sertion allele (I) of 3’UTR was significantly higher in overweight (35.3) and obese females (32.2) compared to the frequency in lean females (15.6). The insertion allele was associated with increased BMI in obese groups. The results ob- tained from this study indicated that in the obese subjects most variable values increased in I/I homozygote but the significant high value recorded among BMI (40.9 ± 7.11 kg/m2, P = 0.042). Our findings indicated that, the obesity in Saudi females is influenced by alteration in the leptin receptor gene 3’-UTR polymorphism. Keywords: Pentanucleotide; Polymorphi sm; Leptin; Obesity; Saudi Females 1. INTRODUCTION Leptin, a peptide hormone encoded by the obesity gene [1], is produced by adipocytes to regulate body weight and energy balance [2,3]. In the fed state, circu- lating leptin concentrations reflect the magnitude of fat stores [4,5], and leptin levels are elevated in many mo- dels of animal obesity and in obese humans, correlating strongly with the degree of obesity [4-6]. Leptin acts through the leptin receptor (OB-R) [7] that is expressed in the nervous system and peripheral tissues such as adi- pose tissue, skeletal muscles, pancreatic β-cells, and liver. A single transcription unit of leptin receptor may serve to generate more than one protein. For instance, several isoforms can be derived from a single gene locus by al- ternative hnRNA splicing, including a long isoform ex- pressed primarily in the hypothalamus and several shor- tisoforms with a much wider tissue distribution [7]. Al- though the frequency of such mutations is very low, common polymorphisms of the leptin and OB-R may well contribute to a common form of obesity and, as a consequence, obesity-related diseases [8,9]. Mutations in the genes encoding leptin (ob) and its re- ceptor (db) have been found to cause early onset morbid obesity, with related phenotypes such as type 2 diabetes *The authors declare no conflict of interest. Copyright © 2013 SciRes. OPEN ACCESS  M. H. Daghestani et al. / Health 5 (2013) 285-291 286 in animals [10] and humans [11,12]. The OB-R gene is a polymorphic gene. Q223R (rs59347832), K109R (rs59932898), and K656N (rs8179183) are among the principal polymorphisms of this gene and are localized in the extracellular region of the receptor in exons 6, 4, and 14, respectively. The trans-membrane region of the re- ceptor is encoded by exon 18. A large number of studies have been able to associate some of these polymer- phisms with body weight gain [13], metabolic carbohy- drate reduction [14], lower body weight, body mass in- dex (BMI), body fat, and smaller waist circumference [15]. Low body fat levels and elevated high-density cho- lesterol [16]. The Q223R polymorphism appears to con- tribute to a common form of obesity. In contrast, the K109R and K656N polymorphisms have been observed to be involved in the response to glucose and insulin [17]. Studies in obese subjects have reported that heterozy- gous carriers of a pentanucleotide insertion in the 3’- UTR of the leptin receptor gene had lower serum insulin concentrations than the homozygous carriers of the more common deletion allele [18,19]. Obese humans are characterized by increased circu- lating leptin levels [5,6], suggesting that human obesity is associated with an insensitivity to endogenous leptin. Since a defect in the leptin-mediated signaling pathway, including the leptin receptor, could be the cause of leptin resistance, the leptin receptor gene has been a plausible candidate gene for obesity [6-20]. Therefore, we investi- gated the effects of leptin receptor gene 3’-UTR poly- morphism on phenotype, metabolic parameters and an- thropometric measurements of obese Saudi females. 2. METHODS 2.1. Subjects Inclusion Criteria: Saudis, age above 18 years, gave consent to participate in the study, with no known illness. Exclusion criteria: non-Saudis, children, suffering from endocrine or genetic causes of obesity. One hundred and twenty two Saudi females’ volunteers were participated in this study. After being informed of the purpose and procedures of the study, all subjects signed a consent form. The study protocol was approved by the KFSH & RC Research Ethical committees. The subjects were di- vided into 3 groups according to their body mass index BMI; lean (n = 60, BMI 18.5 - 24 kg/m2), overweight (n = 17, BMI 25 - 29 kg/m2) and obese (n = 45, BMI ≥ 30 kg/m2). The general characteristics of the subjects are summarized in Table 1. All subjects were healthy, free of any medication with regular menstrual cycle, and no history of gastrointestinal or endocrine disorders. After an overnight fast (12 hrs) a venous blood sample was obtained from all subjects in the morning between 08.00 h and 09.00 h for the determination of fasting serum leptin, insulin and glucose. Serum was aliquoted, and stored at −80˚C until required for assay. 2.2. Anthropometry and Body Composition Measurement For all subjects, weight and height were measured to the nearest 0.5 kg and 0.5 cm, respectively. Body mass index (BMI) was calculated as weight (kilograms)/height (meters)2. Waist and hip circumferences were measured to a precision of 0.1 cm, and the waist to hip ratio was calculated [20]. 2.3. Analytical Method Plasma glucose was measured by a glucose oxidase method using the Roche Glucose HK liquid assay on Roche/Hitachi 917 automatic analyzer. Serum insulin was measured with electrochemiluminescence immuno- assay “ECLIA” technique, using Elecsys insulin kit on E 170 immunoassay analyzer (Roche). Serum leptin was measured in duplicate using human leptin ELISA kit from Linco Research, Inc. (St. Charles, MO), with a lower limit of detection of 0.5 ng/mL. Table 1. Mean comparisons of clinical and endocrine-metabolic characteristics between lean, overweight and obese groups. Va ri a bl e Control lean (n = 60) mean ± SE Overweight (n = 17) mean ± SEp value Obese (n = 45) mean ± SE p value Age (yr.) 23.95 ± 0.60 21.59 ± 0.94 0.06 26.49 ± 0.96 0.028 BMI (kg/m2) 20.85 ± 0.25 27.38 ± 0.37 <0.0001 35.90 ± 0.92 <0.0001 Waist (cm) 66.85 ± 0.70 81.59 ± 1.82 <0.0001 100.29 ± 2.14 <0.0001 Hip (cm) 94.59 ± 0.91 105.29 ± 1.78 <0.0001 121.96 ± 2.14 <0.0001 WH ratio 0.71 ± 0.01 0.78 ± 0.01 <0.0001 0.82 ± 0.01 <0.0001 Leptin (ng/ml) 11.70 ± 0.46 23.79 ± 1.55 <0.0001 46.04 ± 3.07 <0.0001 Fasting insulin (pmol/L) 52.57 ± 2.29 63.93 ± 9.95 0.09 104.69 ± 5.58 <0.0001 Fasting glucose (mmol/L) 4.54 ± 0.05 4.66 ± 0.15 0.32 4.99 ± 0.07 <0.0001 Copyright © 2013 SciRes. OPEN ACCESS 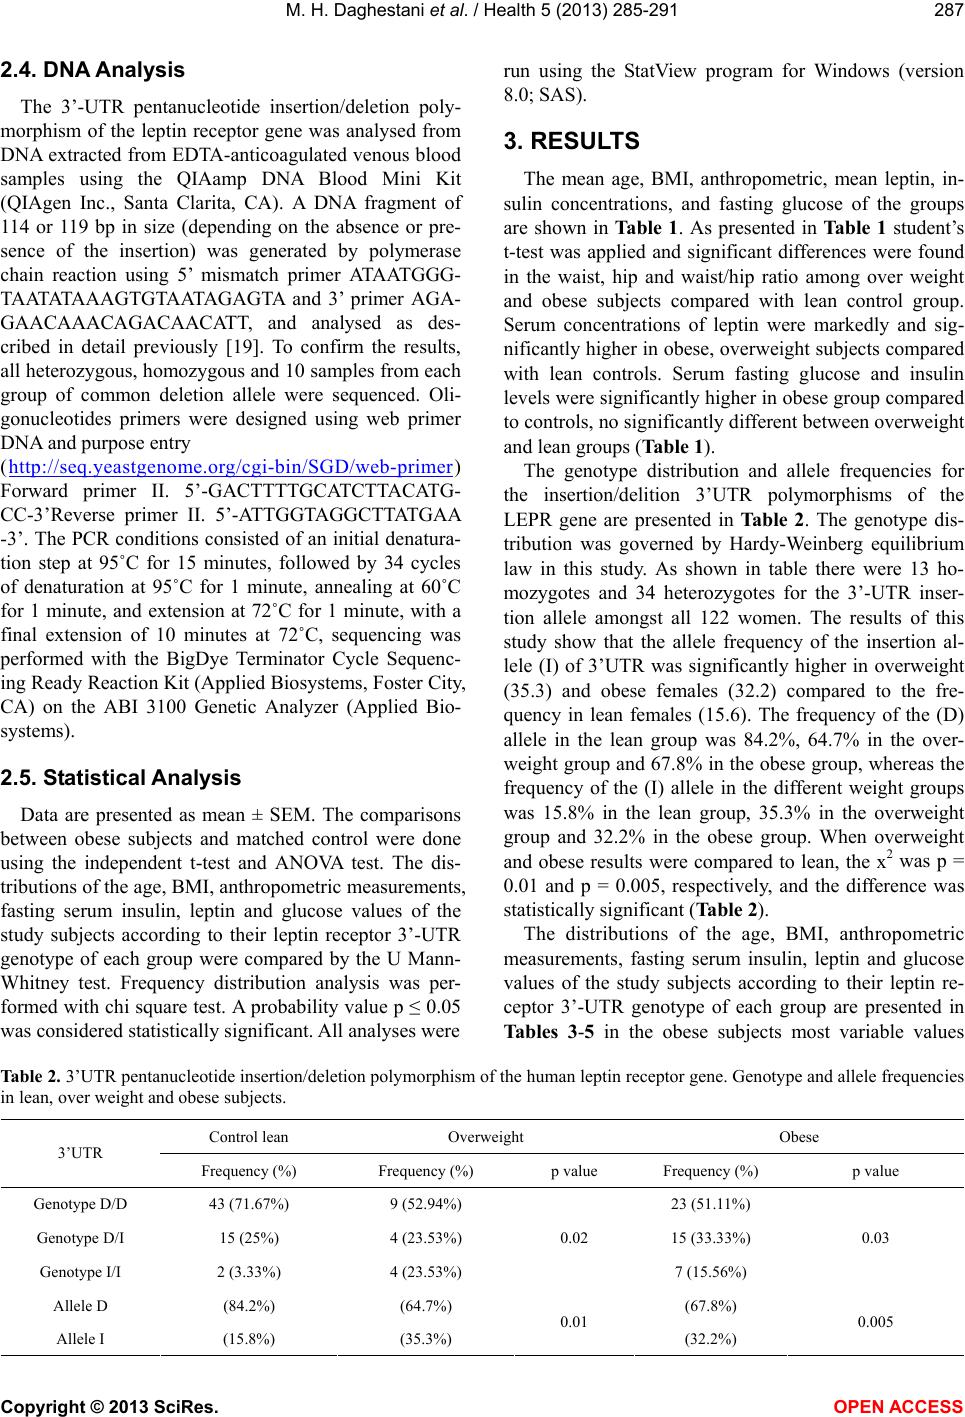 M. H. Daghestani et al. / Health 5 (2013) 285-291 287 2.4. DNA Analysis The 3’-UTR pentanucleotide insertion/deletion poly- morphism of the leptin receptor gene was analysed from DNA extracted from EDTA-anticoagulated venous blood samples using the QIAamp DNA Blood Mini Kit (QIAgen Inc., Santa Clarita, CA). A DNA fragment of 114 or 119 bp in size (depending on the absence or pre- sence of the insertion) was generated by polymerase chain reaction using 5’ mismatch primer ATAATGGG- TAATATAAAGTGTAATAGAGTA and 3’ primer AGA- GAACAAACAGACAACATT, and analysed as des- cribed in detail previously [19]. To confirm the results, all heterozygous, homozygous and 10 samples from each group of common deletion allele were sequenced. Oli- gonucleotides primers were designed using web primer DNA and purpose entry (http://seq.yeastgenome.org/cgi-bin/SGD/web-primer) Forward primer II. 5’-GACTTTTGCATCTTACATG- CC-3’Reverse primer II. 5’-ATTGGTAGGCTTATGAA -3’. The PCR conditions consisted of an initial denatura- tion step at 95˚C for 15 minutes, followed by 34 cycles of denaturation at 95˚C for 1 minute, annealing at 60˚C for 1 minute, and extension at 72˚C for 1 minute, with a final extension of 10 minutes at 72˚C, sequencing was performed with the BigDye Terminator Cycle Sequenc- ing Ready Reaction Kit (Applied Biosystems, Foster City, CA) on the ABI 3100 Genetic Analyzer (Applied Bio- systems). 2.5. Statistical Analysis Data are presented as mean ± SEM. The comparisons between obese subjects and matched control were done using the independent t-test and ANOVA test. The dis- tributions of the age, BMI, anthropometric measurements, fasting serum insulin, leptin and glucose values of the study subjects according to their leptin receptor 3’-UTR genotype of each group were compared by the U Mann- Whitney test. Frequency distribution analysis was per- formed with chi square test. A probability value p ≤ 0.05 was considered statistically significant. All analyses were run using the StatView program for Windows (version 8.0; SAS). 3. RESULTS The mean age, BMI, anthropometric, mean leptin, in- sulin concentrations, and fasting glucose of the groups are shown in Ta ble 1. As presented in Table 1 student’s t-test was applied and significant differences were found in the waist, hip and waist/hip ratio among over weight and obese subjects compared with lean control group. Serum concentrations of leptin were markedly and sig- nificantly higher in obese, overweight subjects compared with lean controls. Serum fasting glucose and insulin levels were significantly higher in obese group compared to controls, no significantly different between overweight and lean groups (Table 1). The genotype distribution and allele frequencies for the insertion/delition 3’UTR polymorphisms of the LEPR gene are presented in Ta ble 2 . The genotype dis- tribution was governed by Hardy-Weinberg equilibrium law in this study. As shown in table there were 13 ho- mozygotes and 34 heterozygotes for the 3’-UTR inser- tion allele amongst all 122 women. The results of this study show that the allele frequency of the insertion al- lele (I) of 3’UTR was significantly higher in overweight (35.3) and obese females (32.2) compared to the fre- quency in lean females (15.6). The frequency of the (D) allele in the lean group was 84.2%, 64.7% in the over- weight group and 67.8% in the obese group, whereas the frequency of the (I) allele in the different weight groups was 15.8% in the lean group, 35.3% in the overweight group and 32.2% in the obese group. When overweight and obese results were compared to lean, the x2 was p = 0.01 and p = 0.005, respectively, and the difference was statistically significant (Table 2). The distributions of the age, BMI, anthropometric measurements, fasting serum insulin, leptin and glucose values of the study subjects according to their leptin re- ceptor 3’-UTR genotype of each group are presented in Tables 3-5 in the obese subjects most variable values Table 2. 3’UTR pentanucleotide insertion/deletion polymorphism of the human leptin receptor gene. Genotype and allele frequencies in lean, over weight and obese subjects. Control lean Overweight Obese 3’UTR Frequency (%) Frequency (%) p value Frequency (%) p value Genotype D/D 43 (71.67%) 9 (52.94%) 23 (51.11%) Genotype D/I 15 (25%) 4 (23.53%) 15 (33.33%) Genotype I/I 2 (3.33%) 4 (23.53%) 0.02 7 (15.56%) 0.03 Allele D (84.2%) (64.7%) (67.8%) Allele I (15.8%) (35.3%) 0.01 (32.2%) 0.005 Copyright © 2013 SciRes. OPEN ACCESS  M. H. Daghestani et al. / Health 5 (2013) 285-291 288 Table 3. Leptin receptor gene 3’UTR deletion/insertion polymorphism in relation to anthropometry, hormone and metabolic variables in control lean group. Variables D/D (n = 43) D/I (n = 15) I/I (n = 2) p-value Age (years) 23.0 ± 4.35 26.0 ± 4.50 27.0 ± 9.90 0.064 BMI (kg/m2) 20.7 ± 1.95 21.1 ± 1.95 21.0 ± 1.41 0.768 Waist (cm) 67.2 ± 5.39 65.7 ± 5.65 66.0 ± 5.66 0.627 Hip (cm) 94.5 ± 7.12 95.1 ± 6.94 92.5 ± 10.6 0.877 W/H ratio 0.71 ± 0.042 0.69 ± 0.049 0.71 ± 0.014 0.302 Leptin (ng/ml) 11.7 ± 3.86 11.4 ± 3.13 11.7 ± 0.35 0.948 Fasting insulin (pmol/L) 53.1 ± 18.9 50.0 ± 15.0 59.2 ± 7.42 0.736 Fasting glucose (mmol/L) 4.56 ± 0.39 4.50 ± 0.40 4.35 ± 0.21 0.700 Table 4. Leptin receptor gene 3’UTR deletion/insertion polymorphism in relation to anthropometry, hormone and metabolic variables in overweight group. Variables D/D (n = 9) D/I (n = 4) I/I (n = 4) p-value Age (years) 22.4 ± 5.13 20.75 ± 1.26 20.50 ± 1.73 0.640 BMI (kg/m2) 27.1 ± 1.63 27.90 ± 1.33 27.48 ± 1.60 0.471 Waist (cm) 80.8 ± 7.52 85.50 ± 7.14 79.25 ± 8.22 0.380 Hip (cm) 103.5 ± 8.68 107.75 ± 3.77 106.75 ± 7.32 0.576 W/H ratio 0.78 ± 0.047 0.80 ± 0.055 0.74 ± 0.075 0.341 Leptin (ng/ml) 22.7 ± 6.28 24.2 ± 7.09 26.3 ± 7.37 0.716 Fasting insulin (pmol/L) 66.7 ± 45.7 69.5 ± 45.7 46.0 ± 17.7 0.729 Fasting glucose (mmol/L) 4.55 ± 0.65 4.78 ± 0.50 4.80 ± 0.75 0.755 Table 5. Leptin receptor gene 3’UTR deletion/insertion polymorphism in relation to anthropometry, hormone and metabolic variables in obese group. Variables D/D (n = 23) D/I (n = 15) I/I (n = 7) p-value Age (years) 26.9 ± 6.77 25.6 ± 6.23 26.8 ± 6.67 0.815 BMI (kg/m2) 35.6 ± 6.33 33.9 ± 4.17 40.9 ± 7.11 0.042 Waist (cm) 101.0 ± 16.0 94.7 ± 6.47 109.7 ± 16.7 0.066 Hip (cm) 121.1 ± 16.1 118.7 ± 10.5 131.5 ± 12.6 0.137 W/H ratio 0.83 ± 0.044 0.80 ± 0.045 0.83 ± 0.068 0.163 Leptin (ng/ml) 44.1 ± 19.7 40.5 ± 12.7 64.1 ± 28.7 0.31 Fasting insulin (pmol/L) 111.0 ± 34.1 90.8 ± 37.2 113.4 ± 45.1 0.214 Fasting glucose(mmol/L) 5.03 ± 0.45 4.96 ± 0.40 4.88 ± 0.54 0.723 increased in I/I homozygote but the significant high value recorded among BMI (40.9 ± 7.11 kg/m2, p = 0.042). 4. DISCUSSION Since 1997, several single nucleotide polymorphisms (SNPs) in coding region and a pentanucleotide (CTTTA) insertion/deletion polymorphism in the 3’-untranslated region of the human OB-R gene have been reported in different ethnic groups [21-25]. Two studies confirmed the existence of the CTTTA pentanucleotide I/D poly- morphism at the 3’UTR of the OB-R gene [18,19]. Leptin gene and leptin receptorgene products, respec- tively, have defined a new biological pathway for the regulation of food intake and energy expenditure. Leptin acts at distinct sites and through different mechanisms within the central nervous system (CNS) to mediate en- ergy homeostasis and feeding behavior [26,27]. It ap- pears that leptin controls feeding not just by providing physiological satiety signal, but also by mediating “syn- aptic plasticity” as well as modulating the perception of reward associated with feeding [26-28]. This is the first study to suggest an association be- tween a polymorphism of the leptin receptor gene and Copyright © 2013 SciRes. OPEN ACCESS  M. H. Daghestani et al. / Health 5 (2013) 285-291 289 obesity. The present study revealed significant differ- ences in allele and genotype frequencies between the normal group on one hand and overweight and obese groups on the other hand (p < 0.05). The allele frequency of the insertion allele was higher in overweight (0.35) and obese females (32.2) when compared to the fre- quency in lean females (15.6). In contrast to our findings a previous study performed on Finnish individuals showed that there was no significant difference in the frequency of the insertion allele (I) between obese (0.124) and normal weight subjects (0.120) [29]. In the Finnish study, four obese, but none of the normal weight subjects were homozygous for the insertion allele [29]. In our study, 5 of the overweight and 9 obese individuals were homo- zygous for the insertion allele and 3 of the normal weight individuals were also homozygous. Our results show significant differences in the genotype and allele fre- quency of leptin receptor gene pentanucleotide poly- morphism in Saudi females compared to the Finnish population. This pointed to genetic variations in the leptin receptor gene polymorphism between populations. The results of this study show that the insertion allele could be considered as a marker for obesity in Saudi fe- males. Even though, the insertion allele also occurs at a fairly high frequency in non-obese Saudis, these results indicate that it can be used as a significant marker of obesity in Saudis, due to the fact that, it may be possible that these normal weight individuals have a higher sensi- tivity to develop obesity, but since they are avoiding the precipitating environmental factors, they are not obese. In addition, they may develop obesity more easily in older age if the predisposing factors are present. This confirmation requires a long-term investigation and fol- low-up studies on individuals with different alleles of the leptin receptor gene, which is a major problem with a study of genetic markers for non-communicable diseases. A person with a particular genotype may not have the disease at present, but may be susceptible to it or may develop it later. The association of pentanucleotide insertion/deletion polymorphism with metabolic parameters and anthro- pometric measurements was earlier studied by many re- searchers, [29] reported better insulin sensitivity in obese subjects carrying the I allele because they had lower in- sulin and insulin-to-glucose ratio levels. [25] concluded that obese heterozygous women had lower insulin values at 30 minutes in the oral glucose tolerance test (OGTT). [29] found that healthy men carrying the I allele had a 79% reduced risk of type 2 diabetes. A Finnish study had shown that the carriers of the insertion allele had a 79% reduced risk of diabetes when compared to non-carriers; this is due to the lesser extent of leptin’s action on the pancreatic ß-cells to inhibit insulin secretion. The study revealed that this 3’-UTR insertion was common in the healthy population since the carrier frequency was a high as 23.5% amongst the controls [29]. In contrast to previous reports [20] did not find a rela- tionship between the I/D LEPR polymorphism and the con- version to type 2 diabetes. However, they found that the I allele was associated with greater reduction in weight, BMI, and waist circumference during the 3-year follow-up. Similarly, [31] reported that the association between I/D-LEPR and prevalent impaired glucose tol- erance or type 2 diabetes did not reach statistical signifi- cance, and they did not find significant associations with other features of the metabolic syndrome. Interestingly, the results of this study demonstrate that there was no association of serum leptin, glucose or insu- lin levels with the pentanucleotide genotype in the obese individuals. However, most variable values increased in I/I homozygote but the significant high value recorded among BMI (40.9 ± 7.11 kg/m2, P = 0.042). It is unfor- tunate that there have been no functional studies on the effects of this 3’-UTR polymorphism. Although stem- loop sequences usually de-stabilize mRNA [30-32], it is unclear whether those in 3’-UTR of the leptin receptor gene, which would be formed by the pentanucleotide insertion allele, might stabilize or de-stabilize the mRNA. [19] hypothesized that this polymorphism might stabilize the mRNA level of the leptin receptor. 5. CONCLUSION The results obtained from this study indicated that in the obese subjects most variable values increased in I/I homozygote but the significant high value recorded among BMI (40.9 ± 7.11 kg/m2, p = 0.042). Our findings support the hypothesis that alterations in the leptin sig- naling system could contribute to the obesity in Saudi Females. 6. ACKNOWLEDGEMENTS This research project was supported by a grant from the “Research Center of the Center for Female Scientific and Medical Colleges”, Deanship of Scientific Research, King Saud University. REFERENCES [1] Zhang, Y., Proenca, R., Maffei, M., Barone, M., Leopold, L. and Friedman, J.M. (1994) Positional cloning of the mouse obese gene and its human homologue. Nature, 372, 425-432. doi:10.1038/372425a0 [2] Campfield, L.A., Smith, F.J., Guisez, Y., Devos, R. and Burn, P. (1995) Recombinant mouse OB protein: Evi- dence for a peripheral signal linking adiposity and central neutral networks. Science, 269, 546-549. doi:10.1126/science.7624778 [3] Pelleymounter, M.A., Cullen, M.J., Baker, M.B., Hecht, R., Winters, D., Boone, T. and Collins, F. (1995) Effects Copyright © 2013 SciRes. OPEN ACCESS  M. H. Daghestani et al. / Health 5 (2013) 285-291 290 of the obese gene product on body weight regulation in ob/ob mice. Science, 269, 540-543. doi:10.1126/science.7624776 [4] Frederich, R.C., Lollmann, B., Hamann, A., Napolitano- Rosen, A., Kahn, B.B., Lowell, B.B. and Flie, J.S. (1995) Expression of ob mRNA and its encoded protein in ro- dents. Journal of Clinical Investigation, 96, 1658-1663. doi:10.1172/JCI118206 [5] Maffei, M., Halaas, J., Ravussin, E., Pratley, R.E., Lee, G.H., Zhang, Y., Fei, H., Kim, S., Lallone, R., Rangana- than, S., Kern, P.A. and Friedman, J.M. (1995) Leptin levels in human and rodent: Measurement of plasma lep- tin and ob RNA in obese and weight-reduced subjects. Nature Medicine, 1, 1155-1161. doi:10.1038/nm1195-1155 [6] Considine, R.V., Sinha, M.K., Heiman, M.L., Kriauciunas, A., Stephens, T.W., Nyce, M.R., Ohannesian, J.P., Marco, C.C., McKee, L.J., Bauer, T.L. and Caro, J.F. (1996) Se- rum immunoreactive-leptin concentrations in normal- weight and obese humans. New England Journal of Me- dicine, 334, 292-295. doi:10.1056/NEJM199602013340503 [7] Chung, W.K., Power-Kehoe, L., Chua, M., Chu, F., Aronne, L., Huma, Z., Sothern, M., Udall, J.N., Kahle, B. and Leibel, R.L. (1997) Exonic and intronic sequence varia- tion in the human leptin receptor gene (LEPR). Diabetes, 46, 1509-1511. [8] Guízar-Mendoza, J.M., Amador-Licona, N., Flores-Mar- tínez, S.E., López-Cardona, M.G., Ahuatzin-Trémary, R. and Sánchez-Corona, J. (2005) Association analysis of the Gln223Arg polymorphism in the human leptin recap- tor gene, and traits related to obesity in Mexican adoles- cents. Journal of Human Hypertension, 19, 341-346. doi:10.1038/sj.jhh.1001824 [9] van der Vleuten, G.M., Kluijtmans, L.A., Hijmans, A., Blom, H.J., Stalenhoef, A.F. and de Graaf, J. (2006) The Gln223Arg polymorphism in the leptin receptor is asso- ciated with familial combined hyperlipidemia. Interna- tional Journal of Obesity (Lond), 30, 892-898. [10] Friedman, J.M. and Halaas, J.L. (1998) Leptin and the re- gulation of body weight in mammals. Nature, 395, 763- 770. doi:10.1038/27376 [11] Montague, C.T., Farooqi, I.S., Whitehead, J.P., Soos, M.A., Rau, H., Wreham, N.J., Sewter, C.P., Digby, J.E., Mo- hammed, S.N., Hurst, J.A., Cheetham, C.H., Early, A.R., Barnett, A.H., Prins, J.B. and O’Rahilly, S. (1997) Con- genital leptin deficiency is associated with severe early- onset obesity in humans. Nature, 387, 903-908. doi:10.1038/43185 [12] Wauters, M., Mertens, I., Chagnon, M., Rankinen, T., Considine, R.V., Chagnon, Y.C., Van Gaal, L.F. and Bou- chard, C. (2001) Polymorphisms in the leptin receptor gene, body composition and fat distribution in overweight and obese women. International Journal of Obesity and Related Metabolic and Disorders, 25, 714-720. doi:10.1038/sj.ijo.0801609 [13] van Rossum, C.T., Hoebee, B., van Baak, M.A., Mars, M., Saris, W.H. and Seidell, J.C. (2003) Genetic variation in the leptin receptor gene, leptin, and weight gain in young Dutch adults. Obesity and Research, 11, 377-386. doi:10.1038/oby.2003.51 [14] Wauters, M., Considine, R.V., Chagnon, M., et al. (2002) Leptin levels, leptin receptor gene polymorphisms, and energy metabolism in women. Obesity and Research, 10, 394-400. doi:10.1038/oby.2002.54 [15] de Luis Roman, D., de la Fuente, R.A., Sagrado, M.G., Izaola, O. and Vicente, R.C. (2006) Leptin receptor Lys656Asn polymorphism is associated with decreased leptin response and weight loss secondary to a lifestyle modification in obese patients. Archives of Medical Re- search, 37, 854-859. doi:10.1016/j.arcmed.2006.03.009 [16] Angel-Chávez, L.I., Tene-Pérez, C.E. and Castro, E. (2012) Leptin receptor gene K656N polymorphism is associated with low body fat levels and elevated high-density cho- lesterol levels in Mexican children and adolescents. En- docrine Research, 37, 124-134. [17] Wauters, M., Mertens, I., Rankinen, T., Chagnon, M., Bouchard, C. and VanGaal, L. (2001) Leptin receptor gene polymorphisms are associated with insulin in obese women with impaired glucose tolerance. Journal of Clini- cal Endocrinology & Metabolism, 86, 3227-3232. doi:10.1210/jc.86.7.3227 [18] Francke, S., Clement, K., Dina, C., Inoue, H., Behn, P., Vatin, V., Basdevant, A., Guy-Grand, B., Permutt, M.A., Froguel, P. and Hager, J. (1997) Genetic studies of the leptin receptor gene in morbidly obese French Caucasian families. Human Genetics, 100, 491-496. doi:10.1007/s004390050540 [19] Oksanen, L., Kaprio, J., Mustajoki, P. and Kontula, K.A. (1998) common pentanucleotide polymorphism of the 3’- untranslated part of the leptin receptor gene generates a putative stem-loop motif in the mRNA and is associated with serun insulin levels in obese individuals. Interna- tional Journal of Obesity, 22, 634-640. doi:10.1038/sj.ijo.0800639 [20] WHO (1988) Measuring obesity: Classification and de- scription of anthropometric data. Copehhagen, WHO, EUR/ ICP/NUT 125. [21] Matsuoka, N., Ogawa, Y., Hosada, K., Matsuda, J., Ma- suzaki, H., Miyawaki, T., Azuma, N.N., Natsui, K., Ni- shimura, H., Yoshimasa, Y., Nishi, N., Thompson, D.B. and Nakao, K. (1997) Human leptin receptor gene in obese Japanese subjects: Evidence against either obe- sity-causing mutations or association of sequence variants with obesity. Diabetologia, 40, 1204-1210. doi:10.1007/s001250050808 [22] Thompson, D.B., Ravussin, E., Bennett, P.H. and Bogar- dus, C. (1997) Structure and sequence variation at the human leptin receptor gene in lean and obese Pima Indi- ans. Human Molecular Genetics, 6, 675-679. doi:10.1093/hmg/6.5.675 [23] Quinton, N.D., Lee, A.J., Ross, R.J.M., Eastell, R. and Blakemore, A.I.F. (2001) A single nucleotide polymer- phism (SNP) in the leptin receptor is associated with BMI, fat mass and leptin levels in postmenopausal Caucasian women. Human Genetics, 108, 233-236. doi:10.1007/s004390100468 [24] Heo, M., Leibel, R.L., Fontaine, K.R., Boyer, B.B., Chung, Copyright © 2013 SciRes. OPEN ACCESS  M. H. Daghestani et al. / Health 5 (2013) 285-291 Copyright © 2013 SciRes. OPEN ACCESS 291 W.K., Koulu, M., Karvonen, M.K., Pesonen, U., Rissanen, A., Laakso, M., Uusitupa, M.I., Chagnon, Y., Bouchard, C., Donohoue, P.A., Burns, T.L., Shuldiner, A.R., Silver, K., Andersen, R.E.R.E., Pedersen, O., Echwald, S., So- rensen, T.L., Behn, P., Permutt, M.A., Jacobs, K.B., Elston, R.C., Hoffman, D.J., Gropp, E. and Allison, D.B. (2002) A meta-analytic investigation of linkage and association of common leptin receptor (LEPR) polymorphisms with body mass index and waist circumference. International Journal of Obesity and Related Metabolic Disorders, 26, 640-646. doi:10.1038/sj.ijo.0801990 [25] Lakka, H.M., Oksanen, L., Tuomainen, T.P., Kontula, K. and Salonen, J.T. (2000) The common pentanucleotide polymorphism of the 3-untranslated region of the leptin receptor gene is associated with serum insulin level and the risk of type 2 diabetes in non-diabetic men, a pro- spective case-control study. Journal of Internal Medicine, 248, 77-83. doi:10.1046/j.1365-2796.2000.00696.x [26] Oswal, A. and Yeo, G. (2010) Leptin and the control of body weight: A review of its diverse central targets, sig- naling mechanisms, and role in the pathogenesis of obesity. Obesity (Silver Spring), 18, 221-229. doi:10.1038/oby.2009.228 [27] Huang, H., Kong, D., Byun, K.H., Ye, C., Koda, S., Lee, D.H., Oh, B.C., Lee, S.W., Lee, B., Zabolotny, J.M., Kim, M.S., Bjørbæk, C., Lowell, B.B. and Kim, Y.B. (2012) Rho-kinase regulates energy balance by targeting hypo- thalamic leptin receptor signaling. Nature Neuroscience, 15, 1391-1398. doi:10.1038/nn.3207 [28] Velloso, L.A. and Schwartz, M.W. (2011) Altered hypo- thalamic function in diet-induced obesity. International Journal of Obesity (Lond), 35, 1455-1465. doi:10.1038/ijo.2011.56 [29] Zacharova, J., Todorova, B.R., Chiasson, J.L. and Laakso, M. (2005) The G-250A substitution in the promoter region of the hepatic lipase gene is associated with the con- version from impaired glucose tolerance to type 2 dia- betes: The STOP-NIDDM trial. Journal of Internal Me- dicine, 257, 185-193. doi:10.1111/j.1365-2796.2004.01435.x [30] Nannipieri, M., Posadas, R., Williams, K., Politi, E., Gonzales-Villalpando, C., Stern, M.P. and Ferrannini, E. (2003) Association between polymorphisms of the atrial natriuretic peptide gene and proteinuria: A population- based study. Diabetologia, 46, 429-432. [31] Ross, J. (1995) mRNA stability in mammalian cells. Mi- crobiological Review, 59, 423-450. [32] Brown, C.Y., Lagnado, C.A. and Goodall, G.J. (1996) A cytokine mRNA-destabilizing element that is structurally and functionally distinct from A + U-rich elements. Pro- ceedings of the National Academy Sciences USA, 93, 13721- 13725.
|