 Vol.5, No.2, 212-221 (2013) Health http://dx.doi.org/10.4236/health.2013.52029 Quality of life of elderly nursing home residents and its correlates in Kayseri. A descriptive-analytical design: A cross-sectional study* Vesile Şenol1#, Ferhan Soyuer1, Mahmut Argün2 1H.B. Vocational School of Health, Erciyes University, Kayseri, Turkey; #Corresponding Author: vsenol@erciyes.edu.tr 2Department of Orthopedy and Traumatology, School of Medicine, Erciyes University, Kayseri, Turkey Received 14 December 2012; revised 15 January 2013; accepted 22 January 2013 ABSTRACT Purpose: To define the level of quality of life in an elderly population and to investigate the ef- fects of selected variables, such as anemia, fa- tigue, depression and sleep disorders, on the quality of life. Design and Methods: The study was conducted in Gazioğlu Nursing Home, lo- cated in the city center of Kayseri, on 136 sub- jects ≥65 in the year 2008-2009. Data were col- lected using the Geriatric Depression Scale (GDS), Fatigue Severity Scale (FSS), Pittsburgh Sleep Quality Index (PSQI) and the World Health Organization Quality of Life-OLD (WHOQOL- OLD) Module. In the statistical analysis mean ± standard deviation, student’s t-test, ANOVA and Spearman correlation analysis were used. Re- sults: The mean total score of quality of life was 43.45 ± 10.30. Of the residents 47.0% had a poor quality of life. Autonomy had the lowest (35.70 ± 19.96) and intimacy had the highest (48.75 ± 17.96) subdomain scores. Fatigue significantly decreased the total and autonomy, social par- ticipation and death and dying subdomain scores. Anemia had a significant adverse effect on in- timacy, depression on autonomy and intimacy and sleep disorder on death and dying. There were negative correlations between fatigue with past-present-future activities and social partici- pation, depression with social participation, in- timacy, death and dying and glucose levels with social participation and intimacy. Implications: About half of the subjects had a poor quality of life. Fatigue was the sole factor to negatively affect the total score in WHOQOL-OLD. Depres- sion, anemia and sleep disorder adversely af- fected the autonomy, social participation, inti- macy, death and dying subdomain scores but not in all. Keywords: Aged; Anemia; Fatigue; Depression; Sleep Disorder; Quality of Life 1. INTRODUCTION In recent years the average life expectancy has mark- edly increased. It rose by 20 years between 1950 and 2000 to 66 years, and is expected to rise by another 10 years by the year 2050. Therefore, by the end of 20th century, life expectancy had increased in the elderly population and birth rates had decreased worldwide. This strongly increased the percentage of people aged 65 years and over in the overall population [1,2]. In our country, in parallel with global demographic transforma- tion, the fertility rate decreased, mean life expectancy has increased, and, as a result, the percentage of elderly people in the overall population has rapidly increases. In the elderly population, with prolonged life expec- tancy, active aging, independence and the quality of life experienced has become more important [1], because, due to increased loss of function observed with senility, a person becomes care-dependent and his need for care increases. This need is generally met by familial mem- bers and, especially, by the person’s children. However, nowadays, the reduction in the family size/increase of the immediate family in society, weakened familial bonds and the increasing number of the women in the work- force has reduced the number of the people who can as- sume the care of the patients and elderly people. This has given rise to the need for social assistance for increasing numbers of elderly people and, therefore, the need for institutionalization to meet the housing and care needs of these people has become more important. In our country, the provision of care for the elderly, which is lower compared to that in developed western countries, due to *We have no conflict interests. Copyright © 2013 SciRes. OPEN ACCESS  V. Şenol et al. / Health 5 (2013) 212-221 213 cultural differences, is met by central government through nursing homes. However, the qualitative and quantitative standards of these institutions are controversial. Likewise, in 2000, the number of patients per bed in a nursing home was 16 in USA vs. 214 in our country [3]. Due to decreased social assistance, elderly nursing home resi- dents have a high risk of developing some psychological disorders, such as isolation, self-depreciation and loneli- ness, among which depression is the most commonly seen problem. Therefore, nursing homes, which provide institutional care for the elderly organized in such a way as to take these problems into account. In this regard, satisfaction surveys are strongly war- ranted to reveal the quality of the services provided by existing institutions. A quality of life evaluation of nurs- ing home residents may be one of the best solutions to this issue. To improve quality of life, an analysis of the essential factors affecting life satisfaction is necessary. Determination of individual, political, social and eco- nomic factors, which may affect quality of life, will pin- point high-risk elderly individuals and provide them with more help and support. It has been that quality of life was tends to be impaired, with advanced age [4]. Based on the results obtained from studies conducted to examine the quality of life in the elderly population, which comprises an important and problematic social group within the overall popula- tion, life comfort is generally influenced by individual sub-factors, such as physical health, functional status, psychosocial and cognitive status and social communica- tion, which are impaired with advanced age, as well as by political, social and economic factors [5]. In these studies, the main factors found to affect quality of life included care dependency for daily life activities, dis- ability, poor health status, advanced age, male gender, life environment, functional limitations, marital status, fatigue, sleep disorders, depression and the presence of concomitant diseases [5,6]. According to the study conducted by Browne et al. [7] while the most important quality of life determinants in elderly people were “social activities, spare time activi- ties and health”, the most important quality of life was depressive mood based on the data of WHOQOL-OLD obtained in Czech Republic [8]. In addition, the study conducted by Low et al. [9] defined the determinants of advanced-age quality of life as “health, financial status and the meaning of life”. The main reasons for the dif- ferences observed between age-related quality of life scores were determined as “personal relations, health and sexuality” [10]. In the light of the information also mentioned in this study, we aimed to determine individual, environmental, social and economic factors that may affect the quality of life in elderly residents in a nursing home and to examine the correlation between different variables, including, in particular, anemia, fatigue, depressive symptoms and sleep disorder, and the quality of life. 2. MATERIALS AND METHODS This cross-sectional study was conducted in Gazioğlu Nursing Home, located in the city center of Kayseri, be- tween October 2008 and October 2009. The study en- rolled a total of 136 nursing home residents aged 65 years and over, who had normal cognitive functions and no psychiatric problems, severe visual disturbances (blindness) or hearing impairment (deafness). The sub- jects had been residents in the nursing home for at least six months or one year. The study was approved by the Ethics Committee of Erciyes University. Institutional approval was given by the Provincial Directorate of Na- tional Education. Written informed consent was obtained from participants in the study. 2.1. Measurements 2.1.1. WHOQOL-OLD This Module is consists of 24 Likert-type questions and 6 subdomains. These domains are classified under the topics “sensorial functions, autonomy, past-present- future activities, social participation, death and dying, intimacy”. The “Sensorial functions” domain examines the effect of changes experienced in sight, hearing, touch, smell and taste on quality of life; the “autonomy” domain questions independence, respect, general control of life, independent decision-making, and the effect of these factors on quality of life; and the “past-present-future activities” domain relates to the success obtained by subjects in their lifetime and the satisfaction felt as a result of this success, talking about the past and their feelings and thoughts about the future. The “social par- ticipation” domain examines their views about the use of time and participation in important activities; the “inti- macy” domain examines their relations with other people and social assistance; and the “death and dying” domain examines their thoughts about the acceptance and the inevitability of death and the meaning of death. For each question, the lowest possible score is 1.0 and the highest possible score is 5.0. The validity and safety of the WHOQOL-OLD form, which was developed by Bullin- ger et al. [1]. In this study WHOQOL-OLD Cronbachs’s α coefficient was 0.76. 2.1.2. GDS For the depressive symptoms level, GDS was used. This scale consists of 30 closed-ended questions and the responders are asked to give “yes” or “no” answer. The total score ranges between 0 and 30. The cut-off score is 13/14. When the score increases above the cut-off score, Copyright © 2013 SciRes. OPEN ACCESS  V. Şenol et al. / Health 5 (2013) 212-221 214 depressive mood is increased. In this study “yes” an- swers were scored by “0” and “no” answers were scored by “1” for questions 1, 5, 7, 9, 15, 19, 21, 28, 29 and 30; and for the remaining questions, “yes” answers “were scored by “1” and “no” answers of were scored by “0”. This scale was developed by Yesavage et al. [11]. 2.1.3. FSS Level of fatigue was measured using FSS. FSS evalu- ates the severity of fatigue based on 9 questions. Each question is scored between 1 (completely disagree) and 7 (completely agree). The FSS total score is the mean of 9 scores and varies between 0 and 7. The cut-off value is 4 points. Scores between 0 and 4 are considered as “with- out fatigue” and scores between 4.1 and 7.0 are consid- ered as “with fatigue”. Higher scores indicate increased fatigue severity. The scale questions the effect of the fa- tigue on the motivation, daily life activities and respon- sibilities of the individual. FSS was developed by Krupp et al. [12]. 2.1.4. PSQI Sleep quality was evaluated by the Pittsburgh Sleep Quality Index (PSQI), which has consisted of 24 questions and seven components: 1) subjective quality of sleep, 2) sleep onset latency, 3) sleep duration, 4) sleep efficiency, 5) presence of sleep disturbances, 6) use of hypnotic sedative medication, and 7) presence of day- time disturbances, as an indication of daytime alertness. Each component is scored from 0 to 3, yielding a total PSQI score between 0 and 21. Individuals with a total PSQI > 5 were considered to be poor sleepers. PSQI was developed by Buysse et al. (1989) [13] and validation of PSQI in the Turkish population was done by Agargun et al. (1996) [14]. Anemia was evaluated using the World Health Orga- nization’s criteria, according to which anemia is defined as Hb < 13 g/dl and Htc < 39% in men and Hb < 12 g/dl and Hct < 36% in women [15]. To obtain for post-prandial blood glucose, the limit values of the reference laboratory were taken as a basis, according to which the following values were accepted: >70 mg/dL, low; 70 - 110 mg/dL, normal; and >110 mg/dL, high. 2.2. Statistical Analysis Study data were evaluated using SPSS 18.0 software. For the data, mean, standard deviation and percentages were calculated. Independent groups were compared using Student’s t-test, One-Way ANOVA, WHOQOL- OLD total and subdomain scores, the power and direc- tion of the correlation between anemia, fatigue, depres- sion and sleep index scores were determined using Spearman correlation analysis. p values < 0.05 were con- sidered as statistically significant. 3. RESULTS AND DISCUSSION The distribution of study group by socio-demographic characteristics is given in Table 1. Ta b l e 2 shows the mean scores for the quality of life domains. Table 3 shows the distribution of prevalence and the mean scores for independent variables that may affect the quality of life, including anemia, fatigue, depression, sleep disorder and daytime sleepiness, by gender. Ta bl e 4 shows the correlation between the independ- ent variables and subdomains of the WHOQOL-OLD Module. Table 5 shows the correlation analysis between WHOQOL-OLD domain scores and FSS, GDS, PSQI, ESS, hemoglobin and glucose levels. In this study, 78.7% of the subjects had a chronic dis- ease. These people had lower subdomain scores of social participation, death and dying and intimacy than healthy peers, but the difference was not statistically significant (p > 0.05). 4. DISCUSSION It is known that aging leads to a potential marked de- crease in quality of life. Therefore, aging is an important determinant of life satisfaction. The aging-related de- crease observed in physiologic reserves reduces toler- ance for potential factors which may affect quality of life, and thereby, the elderly person who is taken out of his/ her accustomed environment, may experience a deeper effect from these factors. Housing environments, like nursing homes, have a similar potential effect [4]. In this study, we investigated the relations between quality of life and variables such as anemia, fatigue, de- pressive symptoms and sleep disorder in people aged 65 years and over, residing in a nursing home. This is the first study to examine the correlation between quality of life and anemia. 4.1. Quality of Life and Its Affecting Factors In our study, the WHOQOL-OLD mean score was 43.45 ± 10.30, which is lower than that found (56.02 ± 11.86) in the study performed by Eser et al. [16]. As seen in the validity study, the intimacy domain score, which is one of the subdomains of quality of life, showed the highest score; this was followed by sensorial functions and past-present-future activities. The autonomy domain score, which was the second highest score in the validity study, was found to be the lowest domain score in our study (Table 2). In our study, when determining quality of life, the mean total score was considered as the cut-off point and, Copyright © 2013 SciRes. OPEN ACCESS  V. Şenol et al. / Health 5 (2013) 212-221 Copyright © 2013 SciRes. OPEN ACCESS 215 Table 1. Distribution of socio-demographic characteristics (n: 136). Socio-demographic characteristics Number % Female 55 40.4 Gender Male 81 59.6 65 - 69 27 19.9 70 - 74 38 27.9 75 - 79 33 24.3 Age groups 80+ 38 27.9 Illiterate 88 64.7 Primary school 40 29.4 Level of education Secondary and high school 8 5.9 Married 21 15.4 Widowed/divorced 113 83.1 Marital status Single 2 1.5 Low (50 - 450 TL) 87 64.0 Monthly income Middle (451 - 900 TL) 49 36.0 Yes 128 94.1 Have a child No 8 5.9 Mean number of children: 3.3 ± 2.2 (min: 1, max: 10); Mean duration residence in nursing home: 3.1 ± 2.6 yr (min: 1, max: 18); Mean number of chronic dis- eases: 4.4 ± 2.9. Table 2. Distribution scores of WHOQOL-OLD (n: 136). WHOQOL-OLD subdomains M ± SD* Cronbach’s α Sensorial functions 45.49 ± 16.41 Autonomy 35.70 ± 19.96 Past-present-future activities 44.16 ± 16.31 Social participation 43.52 ± 17.10 Death and dying 43.10 ± 16.21 Intimacy 48.75 ± 17.96 Total score 43.45 ± 10.30 0.76 *M ± SD: Mean ± Standard Deviation. accordingly, it was observed that approximately half of the residents had a poor quality of life, with a score be- low the mean score. Anemia, fatigue, depressive symp- toms and sleep disorder had a significant adverse effect on the autonomy, social participation, intimacy, death and dying subdomain scores of the quality of life scale. Fatigue and glucose level were variables which had a significant effect on the total score of the quality of life scale. 4.2. Fatigue and Its Effects on Quality of Life In our study, the overall prevalence of fatigue was 41.2%, and frequency and grade of fatigue was signifi- cantly (p < 0.001) higher in women compared to men (Table 3). This percentage was slightly higher compared to the prevalence of fatigue found in advanced age groups included in previously conducted community- based studies [17]. In our study, for subjects with fatigue, the total quality of life score, and the autonomy, social participation, and death and dying subdomain scores were significantly (p = 0.01) lower than those observed in subjects without fatigue (Tab le 4). Fatigue decreased autonomy, the abi- lity to live alone and participation in daily social activi- ties, increased concerns, anxiety and fears about death and dying, and thereby, significantly (p < 0.001). 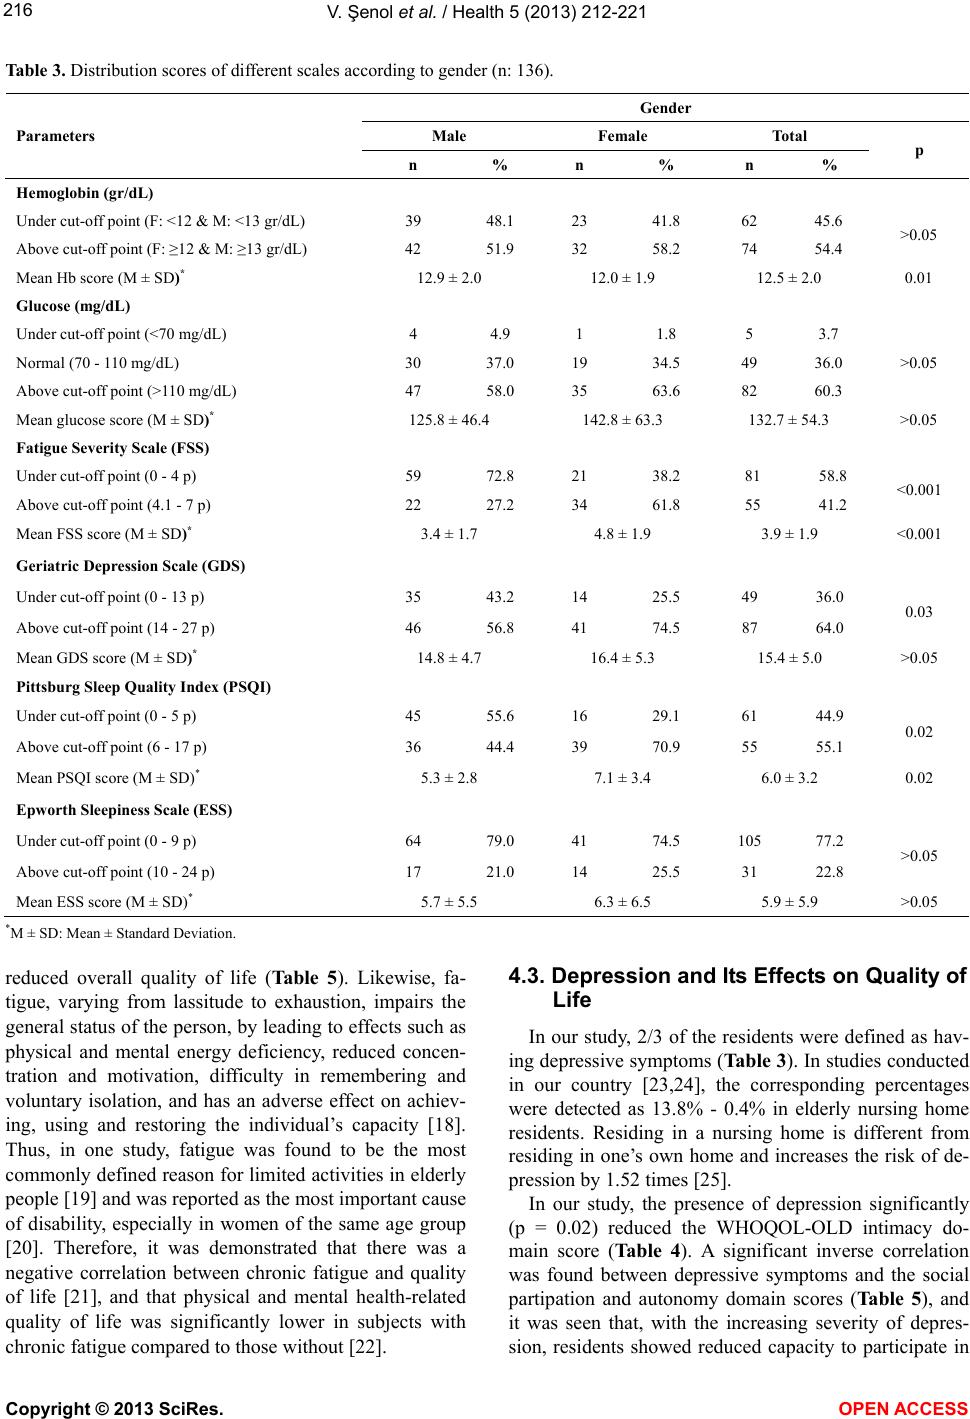 V. Şenol et al. / Health 5 (2013) 212-221 216 Table 3. Distribution scores of different scales according to gender (n: 136). Gender Male Female Total Parameters n % n % n % p Hemoglobin (gr/dL) Under cut-off point (F: <12 & M: <13 gr/dL) 39 48.1 23 41.8 62 45.6 Above cut-off point (F: ≥12 & M: ≥13 gr/dL) 42 51.9 32 58.2 74 54.4 >0.05 Mean Hb score (M ± SD)* 12.9 ± 2.0 12.0 ± 1.9 12.5 ± 2.0 0.01 Glucose (mg/dL) Under cut-off point (<70 mg/dL) 4 4.9 1 1.8 5 3.7 Normal (70 - 110 mg/dL) 30 37.0 19 34.5 49 36.0 Above cut-off point (>110 mg/dL) 47 58.0 35 63.6 82 60.3 >0.05 Mean glucose score (M ± SD)* 125.8 ± 46.4 142.8 ± 63.3 132.7 ± 54.3 >0.05 Fatigue Severity Scale (FSS) Under cut-off point (0 - 4 p) 59 72.8 21 38.2 81 58.8 Above cut-off point (4.1 - 7 p) 22 27.2 34 61.8 55 41.2 <0.001 Mean FSS score (M ± SD)* 3.4 ± 1.7 4.8 ± 1.9 3.9 ± 1.9 <0.001 Geriatric Depression Scale (GDS) Under cut-off point (0 - 13 p) 35 43.2 14 25.5 49 36.0 Above cut-off point (14 - 27 p) 46 56.8 41 74.5 87 64.0 0.03 Mean GDS score (M ± SD)* 14.8 ± 4.7 16.4 ± 5.3 15.4 ± 5.0 >0.05 Pittsburg Sleep Quality Index (PSQI) Under cut-off point (0 - 5 p) 45 55.6 16 29.1 61 44.9 Above cut-off point (6 - 17 p) 36 44.4 39 70.9 55 55.1 0.02 Mean PSQI score (M ± SD)* 5.3 ± 2.8 7.1 ± 3.4 6.0 ± 3.2 0.02 Epworth Sleepiness Scale (ESS) Under cut-off point (0 - 9 p) 64 79.0 41 74.5 105 77.2 Above cut-off point (10 - 24 p) 17 21.0 14 25.5 31 22.8 >0.05 Mean ESS score (M ± SD)* 5.7 ± 5.5 6.3 ± 6.5 5.9 ± 5.9 >0.05 *M ± SD: Mean ± Standard Deviation. reduced overall quality of life (Table 5). Likewise, fa- tigue, varying from lassitude to exhaustion, impairs the general status of the person, by leading to effects such as physical and mental energy deficiency, reduced concen- tration and motivation, difficulty in remembering and voluntary isolation, and has an adverse effect on achiev- ing, using and restoring the individual’s capacity [18]. Thus, in one study, fatigue was found to be the most commonly defined reason for limited activities in elderly people [19] and was reported as the most important cause of disability, especially in women of the same age group [20]. Therefore, it was demonstrated that there was a negative correlation between chronic fatigue and quality of life [21], and that physical and mental health-related quality of life was significantly lower in subjects with chronic fatigue compared to those without [22]. 4.3. Depression and Its Effects on Quality of Life In our study, 2/3 of the residents were defined as hav- ing depressive symptoms (Table 3). In studies conducted in our country [23,24], the corresponding percentages were detected as 13.8% - 0.4% in elderly nursing home residents. Residing in a nursing home is different from residing in one’s own home and increases the risk of de- pression by 1.52 times [25]. In our study, the presence of depression significantly (p = 0.02) reduced the WHOQOL-OLD intimacy do- main score (Table 4). A significant inverse correlation was found between depressive symptoms and the social partipation and autonomy domain scores (Ta bl e 5), and it was seen that, with the increasing severity of depres- sion, residents showed reduced capacity to participate in Copyright © 2013 SciRes. OPEN ACCESS 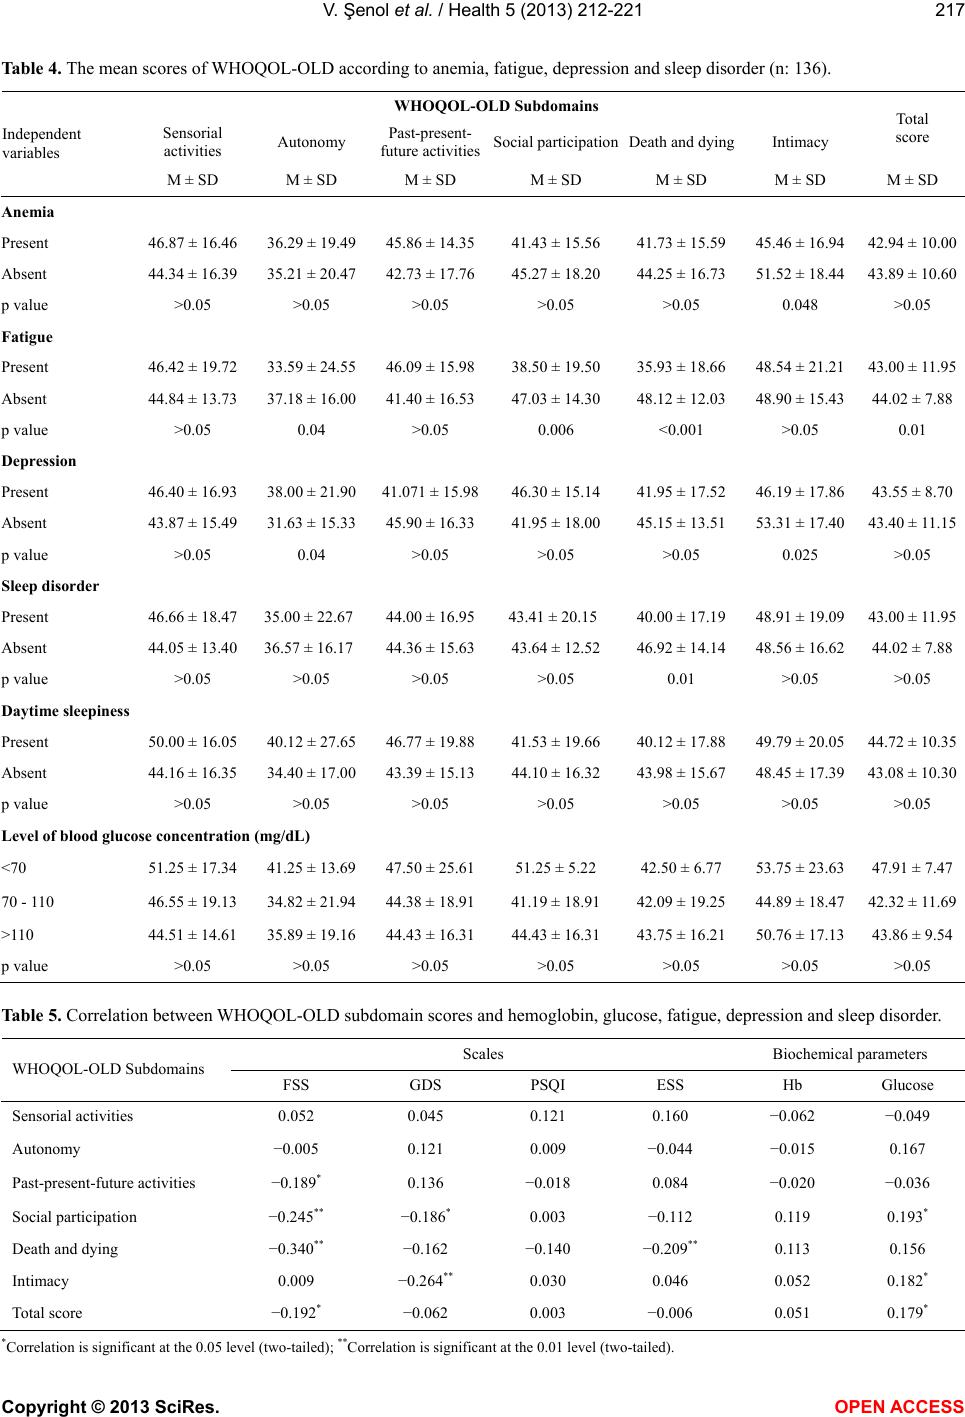 V. Şenol et al. / Health 5 (2013) 212-221 217 Table 4. The mean scores of WHOQOL-OLD according to anemia, fatigue, depression and sleep disorder (n: 136). WHOQOL-OLD Subdomains Sensorial activities Autonomy Past-present- future activitiesSocial participationDeath and dying Intimacy Total score Independent variables M ± SD M ± SD M ± SD M ± SD M ± SD M ± SD M ± SD Anemia Present 46.87 ± 16.46 36.29 ± 19.49 45.86 ± 14.3541.43 ± 15.56 41.73 ± 15.5945.46 ± 16.94 42.94 ± 10.00 Absent 44.34 ± 16.39 35.21 ± 20.47 42.73 ± 17.7645.27 ± 18.20 44.25 ± 16.7351.52 ± 18.44 43.89 ± 10.60 p value >0.05 >0.05 >0.05 >0.05 >0.05 0.048 >0.05 Fatigue Present 46.42 ± 19.72 33.59 ± 24.55 46.09 ± 15.9838.50 ± 19.50 35.93 ± 18.6648.54 ± 21.21 43.00 ± 11.95 Absent 44.84 ± 13.73 37.18 ± 16.00 41.40 ± 16.5347.03 ± 14.30 48.12 ± 12.0348.90 ± 15.43 44.02 ± 7.88 p value >0.05 0.04 >0.05 0.006 <0.001 >0.05 0.01 Depression Present 46.40 ± 16.93 38.00 ± 21.90 41.071 ± 15.9846.30 ± 15.14 41.95 ± 17.5246.19 ± 17.86 43.55 ± 8.70 Absent 43.87 ± 15.49 31.63 ± 15.33 45.90 ± 16.3341.95 ± 18.00 45.15 ± 13.5153.31 ± 17.40 43.40 ± 11.15 p value >0.05 0.04 >0.05 >0.05 >0.05 0.025 >0.05 Sleep disorder Present 46.66 ± 18.47 35.00 ± 22.67 44.00 ± 16.9543.41 ± 20.15 40.00 ± 17.1948.91 ± 19.09 43.00 ± 11.95 Absent 44.05 ± 13.40 36.57 ± 16.17 44.36 ± 15.6343.64 ± 12.52 46.92 ± 14.1448.56 ± 16.62 44.02 ± 7.88 p value >0.05 >0.05 >0.05 >0.05 0.01 >0.05 >0.05 Daytime sleepiness Present 50.00 ± 16.05 40.12 ± 27.65 46.77 ± 19.8841.53 ± 19.66 40.12 ± 17.8849.79 ± 20.05 44.72 ± 10.35 Absent 44.16 ± 16.35 34.40 ± 17.00 43.39 ± 15.1344.10 ± 16.32 43.98 ± 15.6748.45 ± 17.39 43.08 ± 10.30 p value >0.05 >0.05 >0.05 >0.05 >0.05 >0.05 >0.05 Level of blood glucose concentr a tion (mg/dL) <70 51.25 ± 17.34 41.25 ± 13.69 47.50 ± 25.6151.25 ± 5.22 42.50 ± 6.77 53.75 ± 23.63 47.91 ± 7.47 70 - 110 46.55 ± 19.13 34.82 ± 21.94 44.38 ± 18.9141.19 ± 18.91 42.09 ± 19.2544.89 ± 18.47 42.32 ± 11.69 >110 44.51 ± 14.61 35.89 ± 19.16 44.43 ± 16.3144.43 ± 16.31 43.75 ± 16.2150.76 ± 17.13 43.86 ± 9.54 p value >0.05 >0.05 >0.05 >0.05 >0.05 >0.05 >0.05 Table 5. Correlation between WHOQOL-OLD subdomain scores and hemoglobin, glucose, fatigue, depression and sleep disorder. Scales Biochemical parameters WHOQOL-OLD Subdomains FSS GDS PSQI ESS Hb Glucose Sensorial activities 0.052 0.045 0.121 0.160 −0.062 −0.049 Autonomy −0.005 0.121 0.009 −0.044 −0.015 0.167 Past-present-future activities −0.189* 0.136 −0.018 0.084 −0.020 −0.036 Social participation −0.245** −0.186* 0.003 −0.112 0.119 0.193* Death and dying −0.340** −0.162 −0.140 −0.209** 0.113 0.156 Intimacy 0.009 −0.264** 0.030 0.046 0.052 0.182* Total score −0.192* −0.062 0.003 −0.006 0.051 0.179* *Correlation is significant at the 0.05 level (two-tailed); **Correlation is significant at the 0.01 level (two-tailed). Copyright © 2013 SciRes. OPEN ACCESS  V. Şenol et al. / Health 5 (2013) 212-221 218 societal activities and to build personal and private rela- tions. Depression hinders the social relations and the capa- city to build intimacy, by leading to a loss of physical and cognitive ability, and affects quality of life, by caus- ing social isolation and by impairing care to physical and mental health [1,26]. Similar to our results, in studies conducted in our country [27] and in other countries [28] using different scales to evaluate the quality of life, de- pressive symptoms adversely affected the quality of life of elderly people, especially in the physical, psychologi- cal, social relations and environmental domains. Being active and participating is good for elderly people. A wide social network, including relations with family, relatives and neighbors, is important for them. Social relations increase health perception and the level of a person’s well-being. In various studies perform [24,29], it was seen that depression was significantly resolved in elderly people who had a visitor and/or went home for the weekend and in those who built good relations with family members and other people living in the nursing home; it was found that frequent visits to those in nurs- ing homes had a positive effect on their quality of life, more specifically in the physical and psychological do- mains and in the domain of social relations [27,30], and that good relations with family members improved qua- lity of life [31]. This was caused by the fact that partici- pation in social networks makes life easier, provides a balance against the adverse aspects of aging and com- pensates for the loss of important social roles. Therefore, it contributes to a feeling of security, perception of per- sonal worthiness and social adequacy in elderly people. As a consequence, providing individual and social support to allow elderly people who live in society and in the nursing homes to build good relations with other re- sidents, increasing the frequency of relatives/friends. The institution management encouraging the friends and fa- mily of residents to visit training, and motivating the elderly person to continue his/her social activities and hobbies all improve quality of life, by decreasing the in- cidence of depressive symptoms. 4.4. Sleep Disorder and Its Effects on Quality of Life Sleep, which constitutes an important domain in health-related quality of life, is a major human need that takes up approximately one third of the human’s life, and is an important indicator in physical and mental health impairments [32]. Meeting the need for sleep and good sleep quality are important in elderly people to maintain and protect memory, cognitive functions, concentration, affection, and motor functions as well as a good neuronal and endocrine system status, and thereby, a good state of health, and quality of life [33]. In our study, more than half of the residents had mode- rate sleep disorder. The Prevalence of sleep disorder and the mean PSQI score were significantly (p = 0.02) higher in women compared to men (Tab le 3). Based on the re- sults obtained from other studies conducted in our coun- try, which supported our findings, it was reported that between 61% - 77% of nursing home residents [34]. In epidemiologic studies performed in other countries, it was confirmed that, with an aging population, the inci- dence of poor sleep quality, as well as specific medical and psychological problems, was increased in elderly people [35]. It was reported that for people aged 65 years and over, approximately half of those who live in their own homes, and approximately two thirds of those who reside in long-term nursing homes had sleep disorders [36]. In our study, poor sleep quality significantly (p = 0.01) reduced the WHOQOL-OLD death and dying domain score (Table 4). Therefore, residents with sleep disorders experienced concerns, anxiety and fears about death and dying more often. On the other hand, an indirect correla- tion was found between the total score and death and dying domain score in experienced the Epworth sleepi- ness scale, and, therefore, it was noted that the more day- time somnolence was, the more concerns, anxiety and fears about death and dying individuals felt (Table 5). In healthy people, chronic sleep disorders decrease quality of life and increase mortality, by leading to fa- tigue, depression and decreased mental functions. Eld- erly people need good sleep quality to maintain optimum quality of life and to protect their physical and mental functions [37]. 4.5. Anemia and Its Effects on Quality of Life Anemia is a commonly encountered problem in popu- lations aged 65 years and over and its incidence increases with advanced age. In our study, nearly half of the residents were anemic according to WHO criteria for anemia, and the frequency of the condition was significantly higher in men (Table 3). Approximately 1/3 in the residents of nursing homes was reported to be anemic in studies performed in our country [38]. Studies conducted in other countries re- vealed a value of >50% [39]. Similar to our findings, it was reported that the prevalence of anemia was higher in men compared to women. While the prevalence of ane- mia determined in this study was higher than that ob- tained in other studies conducted in our country, it was lower than the prevalence values found in studies per- formed in other countries. Anemia, which is considered as a factor that paves the way to ill health, is currently considered as a risk factor Copyright © 2013 SciRes. OPEN ACCESS  V. Şenol et al. / Health 5 (2013) 212-221 219 for death, which causes serious impairment of quality of life, morbidity and decreased physical functions. In our study, the WHOQOL-OLD intimacy subdomain score was significantly lower for anemic elderly people compared to those who were not (p = 0.04) (Table 4). In the study performed by Lucca et al. [40] a close relation was found between moderate anemia and health-related quality of life in the elderly population. The most important factors to affect quality of life in- clude temporary adverse effects on cognitive functions related to inadequate oxygenation of the brain, due to anemia, asthenia, headache, negative health perception, mood disorders, and physical limitation (agility) and immobility due to falls [41]. Similarly, in our study, the ability of residents to build private and individual rela- tions might be adversely affected due to similar influ- ences. 4.6. Glucose Levels and Their Effects on Quality of Life While the comparison of subdomain scores of glucose levels and quality of life did not show a significant cor- relation, correlation analysis revealed a positive correla- tion between glucose levels and the intimacy domain score (Table 5). It was observed that residents with a glucose level above the normal limit (>110 mg/dL) were better at building private and personal relations. On the other hand, although only depressive symp- toms were significant in anemic elderly people (p = 0.04), fatigue, sleep disorder and daytime sleepiness were higher. Therefore, anemia had a negative effect on qual- ity of life, by adversely affecting other quality of life predictors, via direct or indirect action. 5. CONCLUSION Consequently, the mean quality of life score obtained for nursing home residents aged 65 years and over was 43.4 ± 10.3, which is a low value. Intimacy was the sub- domain with the highest mean score, and autonomy had the lowest mean score. Fatigue, depression, sleep disor- der and anemia were the main determinants to affect quality of life. The most commonly affected domains included autonomy, social participation, death and dying and intimacy. Therefore, marked improvements could be obtained in quality of life and potential life expectancy, by striving to eradicate the depressive symptoms that affect quality of life, accepting anemia and fatigue as a normal physiologic response to aging, performing com- prehensive etiological examinations in anemic elderly people, offering elderly people the opportunity to parti- cipate in social activities, to exercise, and to continue their hobbies, and by providing adequate and efficient health care. 6. ACKNOWLEDGEMENTS We thank Proofreading Office who provided a native speaker on be- half of Presidency of Erciyes University. REFERENCES [1] Bullinger, M., Power, MJ., Aaronson, N.K., Cella, D.F. and Anderson R.T. (1996) Creating and evaluating cross- cultural instruments, In: Spilker, B., Ed., Quality of Life and Pharmaco Economics in Clinical Trials, Lippin- cott-Raven, Hagerstown [2] Barker, W.H. (1998) Prevention of disability in older persons. In: Wallace, R.B., Ed., Maxcy-Rosenau-Last Pub- lic Health & Preventive Medicine, 14th Edition, Appleton & Lange, Norwalk. [3] Lu, H. and Hu, M. (2002) Complementation on Shanghai health care for the elderly in the 21st century. Hong Kong Geriatrics Society, 11, 18-50. [4] Telatar, T.G. and Özcebe, H. (2004) Increasing quality of life of elderly. Turkish Journal of Geriatrics, 7, 162-165. [5] Takahashi, R. and Okugawa, S. (1991) Correlation of health status, disability and hospital life and satisfaction with quality of life in elderly in-patients. Nippon Ronen Igakkai Zasshi, 28, 515-519. doi:10.3143/geriatrics.28.515 [6] Groessl, E.J, Kaplan, R.M. Rejeski, W.J., Katula, J.A., King, A.C., Frierson, G. and Glynn N. (2007) Health-re- lated quality of life in older adults at risk for disability. American Journal of Preventive Medicine, 33, 214-218. doi:10.1016/j.amepre.2007.04.031 [7] Browne, J.P., O’Boyle, C.A., McGee, H.M., Joyce, C.R.B., Mcdonald, N.J. and Malley, K.O. (1994) Individual qual- ity of life in the healthy elderly. Quality of Life Research, 3, 235-244. doi:10.1007/BF00434897 [8] Dragomirecka, E., Bartonova, J., Eisemann, M., Kalfos, M. and Kilian, R. (2008) Demographic and psychosocial correlates of quality of life in the elderly from a cross- cultural perspective. Clinical Psychology & Psychother- apy, 15, 193-204. doi:10.1002/cpp.571 [9] Low, G. and Molzahn, A.E. (2007) Predictors of quality of life in old age: Across validation study. Research in Nursing Health, 30, 141-50. doi:10.1002/nur.20178 [10] Robinson, J.G. and Molzahn, A.E. (2007) Sexuality and quality of life. Journal of Gerontological Nursing, 33, 19-27. [11] Yesavage, J.A., Brink, T.L., Rose, T.L., Lum, O., Huang, V., Adey, M. and Leirer, V.O. (1983) Development and validation of geriatric depression screening scale: A pre- liminary report. Journal of Psychiatric Research, 17, 37- 49. doi:10.1016/0022-3956(82)90033-4 [12] Krupp, L.B., Alvarez, L.A., Larocca, N.G. and Scheinberg L.C. (1998) Fatigue in multiple sclerosis. Archives of Neu- rology, 45, 435-437. doi:10.1001/archneur.1988.00520280085020 [13] Buysse, D.J., Reynolds, C.F., Monk, T.H., Berman, S.R. and Kupfer, D.J. (1989) The Pittsburgh sleep quality in- dex: A new instrument for psychiatric and research. Psy- Copyright © 2013 SciRes. OPEN ACCESS  V. Şenol et al. / Health 5 (2013) 212-221 220 chiatry Research, 28, 193-213. doi:10.1016/0165-1781(89)90047-4 [14] Agargun, Y.M., Kara, H. and Anlar, Ö. (1996) The reli- ability and validity the Pittsburgh sleep quality index. Turkish Journal of Psychiatry, 7, 107-111. [15] World Health Organization (1968) Nutritional anemias: Report of a WHO scientific group. WHO technical re- ports series 405. WHO, Geneva. [16] Eser, S., Saatli, G., Eser, E., Baydur, H. and Fidaner, C. (2010) The reliability and validity of the Turkish version of the World Health Organization quality of life instru- ment-older adults module (WHOQOL-Old). Turkish Jour- nal of Psychiatry, 21, 37-48. [17] Cella, D., Lai, J.S., Chang, C.H., Peterman, A. and Slavin, M. (2002) Fatigue in cancer patients compared with fa- tigue in the general United States population. Cancer, 94, 528-538. doi:10.1002/cncr.10245 [18] Aaronson, L.S., Teel, C.S., Cassmeyer, V., Neuberger, G.B., Pallikkathayil, L., Pierce, J., Press, A.N., Williams, P.D. and Wingate, A. (1999) Defining and measuring fa- tigue. Image Journal of Nursing Scholarship, 31, 45-50. doi:10.1111/j.1547-5069.1999.tb00420.x [19] Gill, T.M., Desai, M.M., Gahbauer, E.A., Holford, T.R. and Williams, C.S. (2001) Restricted activity among com- munity-living older persons: Incidence, precipitants and health care utilization. Annals of Internal Medicine, 135, 313-321. [20] Leveille, S.G., Fried, L.P. and Guralnik, J.M. (2002) Dis- abling symptoms: What do older women report? Journal of General Internal Medicine, 17, 766-773. doi:10.1046/j.1525-1497.2002.20229.x [21] Martin, A., Chalder, T., Rief, W. and Braehler, E. (2007) The relationship between chronic fatigue and somatiza- tion syndrome: A general population survey. Journal of Psychosomatic Research, 63, 147-156. doi:10.1016/j.jpsychores.2007.05.007 [22] Wong, W.S. and Fielding, R. (2010) Prevalence of chronic fatigue among Chinese adults in Hong Kong: A popula- tion-based study. Journal of Affective Disorders, 127, 248- 256. doi:10.1016/j.jad.2010.04.029 [23] Şahin, E.M. and Yalçın, M.Y. (2003) Comparing the in- cidences of depression at the elderly living in nursing home or at their own homes. Turkish Journal of Geriat- rics, 6, 10-13. [24] Topbaş, M., Yaris, F., Can, G., Kapuca, M. and Sayar, K. (2004) The effect of socio-demographic factors and me- dical status on depressive symptoms of the inhabitants of nursing home and community-dwelling elders in Trab- zon-Turkey. Clinical Psychopharmacology Bulletin, 14, 57-60. [25] Osborn, D.P., Fletcher, A.E., Smeeth, L., Stirling, S., Bul- pitt, C.J., Breeze, E., et al. (2003) Factors associated with depression in a representative sample of 14,217 people aged 75 and over in the United Kingdom: Results from the MRC trial of assessment and management of older people in the community. International Journal of Geri- atric Psychiatry, 18, 623-630. doi:10.1002/gps.896 [26] Doraiswam, P.M., Khan, Z.M., Donahue, R.M., et al. (2002) The spectrum of quality-of-life impairments in recurrent geriatric depression. Journal of Gerontology, 57, 134- 138. doi:10.1093/gerona/57.2.M134 [27] Yazgan, Ç., Kora, K., Topcuoğlu, V. and Kuşçu, K. (2006) Factors influencing quality of life nondemented elderly nursing homes residents. Turkish Journal of Geriatrics, 9, 122-125. [28] Chan, S., Jia, S., Chiu, H., Chien, W.T., Thompson, D.R., Hu, Y., et al. (2009) Subjective health-related quality of life of Chinese older person with depression in Shanghai and Hong-Kong: Relationship to clinical factors, level of functioning and social support. International Journal of Geriatric Psychiatry, 24, 355-362. doi:10.1002/gps.2129 [29] Sütoluk, Z., Demirhindi, H., Savaş, N. and Akbaba, M. (2004) Prevalence and causes of depression among elders who live in residental homes in Adana. Turkish Journal of Geriatrics, 7, 148-151. [30] Tseng, S.Z., Wang, R.H. and Bistodeau, J.A. (2001) Qual- ity of life and related factors among elderly nursing home residents in southern Taiwan. Public Health Nursing, 18, 304-311. doi:10.1046/j.1525-1446.2001.00304.x [31] Oleson, M., Heading, C., Shadick, K.M., et al. (1994) Quality of life in long stay institutions in England: Nurse and resident perceptions. Journal of Advanced Nursing, 20, 23-32. doi:10.1046/j.1365-2648.1994.20010023.x [32] Stanley, N. (2005) The physiology of sleep and impact of ageing. European Urology Supplements, 3, 17-23. doi:10.1016/S1569-9056(05)80003-X [33] Yazgan, P. (2009) Sleep problem in the elderly. Turkish Journal of Physicalmedicine and Rehabilitation, 55, 67- 68. [34] Eser, I., Khorshid, L. and Çinar, S. (2007) Sleep quality of older adults in nursing homes in Turkey: Enhancing the quality of sleep improves quality of life. Journal of Gerontological Nursing, 33, 42-49. [35] Martin, J., Shochat, T. and AncoliaIsrael, S. (2000) As- sessment and treatment of sleep disturbances in older adults. Clinical Psychology Review, 20, 783-805. doi:10.1016/S0272-7358(99)00063-X [36] Fetveit, A. and Bjorvatn. B. (2002) Sleep disturbances among nursing home residents. International Journal of Geriatric Psychiatry, 17, 604-609. doi:10.1002/gps.639 [37] Topham, D.L. (2004) Sleep and rest. In: Daniels, R., Ed., Nursing Fundamentals Caring & Caring Decision Mak- ing. Delmar Thomson Learning, Winter KA. & Kuiper, Ashland, 1306-1319. [38] Önem, Y., Terekeci, H., Küçükardali, Y., Şahan, B. and Solmazgül, E. (2010) Albumin, hemoglobin, body mass index, cognitive and functional performance in elderly persons living in nursing homes. Archives of Gerontology and Geriatrics, 50, 56-59. doi:10.1016/j.archger.2009.01.010 [39] Robinson, B., Artz, A.S., Culleton, B., Critchlow, C., Sciarra, A. and Audhya, P. (2007) Prevalence of anemia in the nursing home: Contribution of chronic kidney dis- ease. Journal of the American Geriatrics Society, 55, 1566- 1570. doi:10.1111/j.1532-5415.2007.01389.x [40] Lucca, U., Tettamanti, M., Mosconi, P., Apolone, G., Copyright © 2013 SciRes. OPEN ACCESS  V. Şenol et al. / Health 5 (2013) 212-221 Copyright © 2013 SciRes. OPEN ACCESS 221 Gandini, F., Nobili, A., et al. (2008) Association of mild anemia with cognitive, functional mood and quality of life outcomes in the elderly: The “Health and Anemia” Study. PLoS One, 3, 1-8. doi:10.1371/journal.pone.0001920 [41] Gabrilove, J. (2005) Anemia and the elderly. Clinical con- siderations. Best Practice & Research Clinical Haema- tology, 18, 417-422. doi:10.1016/j.beha.2005.02.004
|