Journal of Software Engineering and Applications, 2013, 6, 74-83
http://dx.doi.org/10.4236/jsea.2013.62012 Published Online February 2013 (http://www.scirp.org/journal/jsea)
Performance Evaluation Approach for Multi-Tier Cloud
Applications
Arshdeep Bahga, Vijay K. Madisetti
Electrical and Computer Engineering, Georgia Institute of Technology, Atlanta, USA.
Email: arshdeep@gatech.edu, vkm@gatech.edu
Received January 11th, 2013; revised February 9th, 2013; accepted February 17th, 2013
ABSTRACT
Complex multi-tier applications deployed in cloud computing environments can experience rapid changes in their
workloads. To ensure market readiness of such applications, adequate resources need to be provisioned so that the ap-
plications can meet the demands of specified workload levels and at the same time ensure that service level agreements
are met. Multi-tier cloud applications can have complex deployment configurations with load balancers, web servers,
application servers and database servers. Complex dependencies may exist between servers in various tiers. To support
provisioning and capacity planning decisions, performance testing approaches with synthetic workloads are used. Ac-
curacy of a performance testing approach is determined by how closely the generated synthetic workloads mimic the
realistic workloads. Since multi-tier applications can have varied deployment configurations and characteristic work-
loads, there is a need for a generic performance testing methodology that allows accurately modeling the performance
of applications. We propose a methodology for performance testing of complex multi-tier applications. The workloads
of multi-tier cloud applications are captured in two different models-benchmark application and workload models. An
architecture model captures the deployment configurations of multi-tier applications. We propose a rapid deployment
prototyping methodology that can help in choosing the best and most cost effective deployments for multi-tier applica-
tions that meet the specified performance requirements. We also describe a system bottleneck detection approach based
on experimental evaluation of multi-tier applications.
Keywords: Performance Modeling; Synthetic Workload; Benchmarking; Multi-Tier Applications; Cloud Computing
1. Introduction
Provisioning and capacity planning is a challenging task
for complex multi-tier application s such as e-Commerce,
Business-to-Business, Banking and Financial, Retail and
Social Networking applications deployed in cloud com-
puting environments. Each class of applications has dif-
ferent deployment configurations with web servers, ap-
plication servers and database servers.
Over-provisioning in advance for such systems is not
economically feasible. Cloud computing provides a pro-
mising approach of dynamically scaling up or scaling
down the capacity based on the application workload.
For resource management and capacity planning deci-
sions, it is important to understand the workload charac-
teristics of such systems, measure the sensitivity of the
application performance to the workload attributes and
detect bottlenecks in the systems. Performance testing of
clouds applications can reveal bottlenecks in the system
and support provisioning and capacity planning decisions.
With performance testing it is possible to predict applica-
tion performance under heavy workloads and identify
bottlenecks in the system so that failures can be pre-
vented. Bottlenecks, once detected, can be resolved by
provisioning additional computing resources, by either
scaling up systems (instances with more computing ca-
pacity) or scaling out systems (more instances of same
kind).
In our previous work [1] we proposed the Georgia
Tech Cloud Workload specification language (GT-CWSL)
that provides a standard way for defining application
workloads in a form that can be used by synthetic work-
load generation techniques, and a synthetic workload
generator that accepted GT-CWSL workload specifica-
tions. In [1], we also described benchmark and workload
models for describing different benchmarks in the form
of building blocks.
In this paper we propose, 1) automated performance
evaluation methodology for multi-tier cloud applications,
2) a rapid deployment prototyping methodology that can
help in choosing the best and most cost effective de-
ployments for multi-tier applications, 3) an architecture
model that captures deployment configurations of multi-
tier applications, 4) system bottleneck detection approach
Copyright © 2013 SciRes. JSEA
Performance Evaluation Approach for Multi-Tier Cloud Applications 75
based on experimental evaluation of multi-tier applica-
tions. We have implemented the proposed approaches for
performance evaluation, deployment prototyping and
bottleneck detectio n in a set of tools that we named as the
Geor gia Tech Cloud Ap plicati on Tester (GT-CAT).
In Section 2 we discuss related work. In Section 3, we
describe the proposed methodology for performance
evaluation of multi-tier cloud applications. In Section 4
we describe the experiment setup used demonstrate the
proposed approaches for performance evaluation, de-
ployment prototyping and bottleneck detection. In Sec-
tion 5, we provide an experimental evaluation study of a
multi-tier e-Commerce benchmark application on differ-
ent deployment architectures.
2. Related Work
There are several workload generation tools developed to
study web applications such as SPECweb99 [2], SURGE
[3], SWAT [4] and HP LoadRunner [5]. Such workload
generation tools repeatedly send requests from machines
configured as clients to the intended systems under test.
Ta bl e 1 provides a comparison of few workload genera-
tion tools. Several other tools generate synthetic work-
loads through transformation (e.g. permutation) of em-
pirical workload traces [6-8]. Several studies on analysis
and modeling of web workloads have been done [9-11].
Since obtaining real traces from complex multi-tier sys-
tems is difficult, a number of benchmarks have been de-
veloped to model the real systems [12-14].
Figure 1 shows a workflow used by traditional per-
formance evaluation approaches, which require a real
user to interact with the application to record scripts that
are used by load generators. Tools such as HP LoadRun-
ner [5] are based on the workflow shown in Figure 1.
Figure 2 shows the proposed workflow for performance
evaluation of multi-tier cloud applications. The proposed
workflow is described in detail in Section 3.
We now describe the key differences between the tra-
ditional and proposed approaches.
2.1. Capturing Workload Characteristics
In traditional approach, such as in HP LoadRunner, to
capture workload characteristics, a real user’s interac-
tions with a cloud application are first recorded as virtual
user scripts. The recorded virtual user scripts then are
parameterized to account for randomness in application
and workload parameters. There is no underlying statis-
tical model involved in such approaches as recorded
scripts are used to drive the load generators. In the pro-
posed approach, real traces of a multi-tier application
which are logged on web servers, application serv ers and
database servers are analyzed to generate benchmark and
workload models that capture the cloud application and
Figure 1. Traditional performance evaluation workflow
based on a semi-automated approach.
Figure 2. Proposed performance evaluation workflow based
on a fully automated approach.
Copyright © 2013 SciRes. JSEA
Performance Evaluation Approach for Multi-Tier Cloud Applications
Copyright © 2013 SciRes. JSEA
76
Table 1. Comparison of related work.
Reference Approach Application Input/Output Models used
SURGE
[3]
Uses an offline trace generation engine
to create traces of requests. Web
characteristics such as file sizes,
request sizes, popularity, temporal
locality, etc are statistically modeled.
Request generation for
testing network and
server performance
Input—Pre-computed
data-sets consisting of the
sequence of requests to be
made, the number of
embedded files in each web
object to be requested, and the
sequences of Active and
Inactive OFF times to be
inserted between request.
Output—Synthetic workload
that agrees with six
distributional models.
Six distributional models
make up the SURGE
model (file sizes, request
sizes, popularity,
embedded references,
temporal locality, and OFF
times).
SWAT
[4]
Uses a trace generation engine that
takes sessionlets (a sequence of
request types from a real system user)
as input and produces an output trace
of sessions for stress test. SWAT uses
httperf for request gener ation.
Stress testing
session-based
web applications
Input—Trace of sessionlets
obtained from access logs of a
live system under test,
specifications of think time,
session length, session
inter-arrival time, etc.
Output—Trace of sessions for
stress test.
Workload model used that
consists of attributes such
as session inter-arrival
time, session length, think
time, request inter-arrival
time and workload mix.
HP Load
Runner
[5]
Based on empirical modeling
approach. A browser based Virtual
User Generator is used for interactive
recording and scripting. Scri p ts are
generated by recording activities of a
real user interaction with the
application.
Performance testing of
web applications.
Input—Load generators take
the virtual user scripts as
input. Output—Synthetic
workloads.
Empirical modeling
approach used. Recorded
scripts are parameterized
to account for randomness
in application and
workload parameters.
GT-CAT
Based on analytical modeling
approach. Benchmark and workload
models are generated by analysis o f
real traces of the application. Synthetic
workload generator generates
workloads based on the specifications
captured in models.
Performance testing of
multi-tier cloud
applications.
Input-Logged traces of real
application. Output-Synthetic
workload that has the same
workload characteristics as
real workloads.
Benchmark, Workload &
Architecture models used.
workload characteristics. A statistical analysis of the user
requests in the real traces is performed to identify the
right distributions th at can be used to model the wo rkload
model attributes. In Section 3, we describe the bench-
mark and workload models in detail.
2.2. Automated Performance Evaluation
In traditional approach, multiple scripts have to be re-
corded to create different workload scenarios. This ap-
proach involves a lot of manual effort. In order to add
new specifications for workload mix and new requests,
new scripts need to be recorded and parameterized.
Writing additional scripts for new requests may be
complex and time consuming as inter-request dependen
cies need to be take care of. In the proposed approach,
real traces are analyzed to generate benchmark and work-
load models. Various workload scenarios can be created
by changing the specifications of the workload model.
New specifications for workload mix and new requests
can be specified by making changes in the benchmark
model. This approach is faster as compared to tradition al
approach in which multiple virtual u ser scripts have to be
recorded and parameterized to generate various workload
scenarios. The benchmark and workload models drive the
synthetic workload generator. The proposed performance
evaluation methodology automates the entire perfor-
mance evaluation workflow right from capturing user
behavior into workload and benchmark models to gen-
erating synthetic workloads which have the same char-
acteristics as real workloads.
2.3. Realistic Workloads
Traditional approaches which are based on manually
generating virtual user scripts by interacting with a cloud
application, are not able to generate synthetic workloads
which have the same characteristics as real workloads.
Although the traditional approaches allow creation of
various workload scenarios using multiple recorded vir-
tual user scripts, however, these workload scenarios are
generally over simplifications of real-world scenarios in
which a very large number of users may be simultane-
ously interacting with a cloud application. In the pro-
posed approach, since real traces from a cloud applica-
tion are used to capture workload and application char-
acteristics into workload and benchmark models, the gen-
erated synthetic workloads have the same characteristics
Performance Evaluation Approach for Multi-Tier Cloud Applications 77
as real workloads. By statistical analysis of the user re-
quests in the real traces, the proposed approach is able to
identify the right distributions that can be used to model
the workload model attributes such as think time, in-
ter-session interval and session length.
2.4. Rapid Deployment Prototyping
Traditional approaches do now allow rapidly comparing
various deployment architectures. Based on the perfor-
mance evaluation results, the deployments have to be
refined manually and additional virtual user scripts have
to be generated with new deployments. In the proposed
approach, an architecture model captures the deployment
configurations of multi-tier applications. In Section 3.6,
we describe a rapid deployment prototyping methodol-
ogy that helps in choosing the best and most cost effect-
tive deployments for multi-tier ap plications that meet the
specified performance requirements. With the proposed
methodology, complex deployments can be created rap-
idly, and a comparative performance analysis on various
deployment configurations can be accomplished.
3. Proposed Methodology
Figure 2 shows the proposed workflow for performance
evaluation of multi-tier cloud applications. We now de-
scribe the steps in the performance evaluation workflow.
3.1. Trace Analysis
Figure 3 shows the benchmark and workload models
generation process by analysis of logged traces of a cloud
application. Real traces of a multi-tier application which
are logged on web servers, application servers and data-
base servers, have information regarding the user, the
requests submitted by the user and the time-stamps of the
requests. Each entry in the trace has a time-stamp, re-
quest type, request parameters and user’s IP address. The
trace generated from a benchmark has all the requests
from all users merged into a single file. The trace ana-
lyzer identifies unique users/sessions based on the IP
address or thread-ID from which the request came. The
terms user and session cannot be always used inter-
changeably because a single user can create multiple
sessions. Therefore, we use a time-threshold to identify a
session. All requests that come from a single user within
that threshold are considered as a single session.
3.2. Benchmark Model
The benchmark model includes attributes such as opera-
tions, workload mix, inter-request dependencies and data
dependencies. The benchmark model captures the differ-
ent requests types/operations allowed in the benchmark
application, proportions of different request types and the
Figure 3. Benchmark and workload models generation by
analysis of logged traces of cloud application.
dependencies between the requests. The benchmark mod-
el describes the semantic behavior of the requests. The
semantic behavior determines the requests types of the
application and the data associated with the requests. In
our previous work [1] we described in detail the me-
thodology used to in characterization of benchmark-
model attributes which involves identification of differ-
ent operations/request types in a benchmark application,
proportions of different request types, i.e. the workload
mix, the inter-request and data dependencies.
3.3. Workload Model
The workload model includes attributes of the workload
such as inter-session interval, think time and session
length. The workload model describes the time behavior
of the user requests. The time behavior determines how
many simultaneous requests are accepted by an applica-
tion. When multiple users submit requests to an applica-
tion simultaneously the workload model attributes such
as inter-session interval, think time and session leng th are
important to study the performance of the application.
Think time and session length capture the client-side
behavior in interacting with the application. Whereas the
inter-session interval is a server-side aggregate, that cap-
tures the behavior of a group of users interacting with the
application. For characterizing the workload model at-
tributes, it is necessary to identify independent users/ses-
sions in the trace. The trace analyzer identifies unique
users and sessions from the trace of a benchmark appli-
cation. A statistical analysis of the user requests is then
performed to identify the right distributions that can be
used to model the workload model attributes such as in-
ter-session interval, think time and session length. The
methodology adopted in characterizing workload model
Copyright © 2013 SciRes. JSEA
Performance Evaluation Approach for Multi-Tier Cloud Applications
78
attributes is described in detail in our previous work [1].
3.4. Architectur e M odel
Figure 4 shows a multi-tier deployment generation proc-
ess using cloud instance templates and architecture mod-
el specifications. Architecture model includes specifica-
tions for all the tiers in the deployment. To provide a
modular approach for creating complex multi-tier de-
ployments, we created cloud instance templates for load
balancer, web server, application server and database
server. Cloud instance templates include a base Linux
image (CentOS or Ubuntu) and a set of startup scripts
that install and configure the software (such as HAProxy
load balancer, Apache web server, PHP application server,
MySQL database server, etc.). Additional startup scripts
are used for deploying an application on the deployment
specified in the architecture model. The instance size for
each tier (computing capacity) is specified in the archi-
tecture model. Complex deployments can have can have
multiple instances of the same type in each tier. For sim-
plicity in describin g multi-tier deployment co nfiguration s
we use the naming convention—(#L (size)/#A (size)/#D
(size)), where #L is the number of instances running load
balanc ers and web serv ers, #A is the number of instances
running application servers, #D is the number of in-
stances running database servers and (size) is the size of
an instance. Specifications for the number of instances
for each tier are included in the architecture model. The
advantage of using a separate architecture model is that
the performance evaluations become independent of ap-
plication under study. With architecture model and cloud
instance templates, complex deployments can be created
rapidly, which allows evaluating the performance of an
application on various deployment architectures. De-
ployments can be rapidly scaled up (vertical scaling) or
scaled out (horizontal scaling) by making changes in the
architecture model.
3.5. Synthetic Workload Generation
Figure 5 shows the synthetic workload generation proc-
ess based on benchmark and workload model specifica-
tions. The synthetic work load generator is built using the
Faban run execution and management infrastructure [15],
which is an open source facility for deploying and run-
ning benchmarks. We have extended the Faban Harness
to accept GT-CWSL specifications that are generated by
the GT-CWSL code generator using the benchmark and
workload models. This synthetic workload generator
allows generating workloads for multi-tier cloud app lica-
tions that are deployed across several nodes in a cloud.
The Master agent contains a web-server that runs the
GT-CAT web interface which is used to launch and queue
performance test runs and visualize the results. Run
Figure 4. Multi-tier deployment generation using cloud in-
stance templates and architecture model specifications.
Figure 5. Synthetic workload generation based on bench-
mark and workload model specifications.
Queue manages the performance test runs which are run
in a first in first out (FIFO) manner. Log Server collects
pseudo real time logs from the systems under test. Agents
are deployed on both the driver systems and the systems
under test. These agents control the performance runs
and collect the system statistics and metrics which are
used for performance evaluation. Multiple agent threads
are created by an agent, where each thread simulates a
single user. Registry registers all the agents with the
Master so that the master can submit the load driving
tasks to the agents. The logic for workload generation,
workload characteristics, application operations and the
logic for generating requests and the associated data for
each of the operations are specified in the Driver. Run
configuration provides the input parameters that control
the pe rfo rmance test run on a multi-tier cloud applic atio n.
Copyright © 2013 SciRes. JSEA
Performance Evaluation Approach for Multi-Tier Cloud Applications 79
Run configuration contains specifications of the ramp up,
steady state and ramp down times, the number of users,
output directory, etc. The performance policies include a
series of service level objectives (SLO’s) that define the
performance metrics such as the response time specifica-
tion for each request in the application.
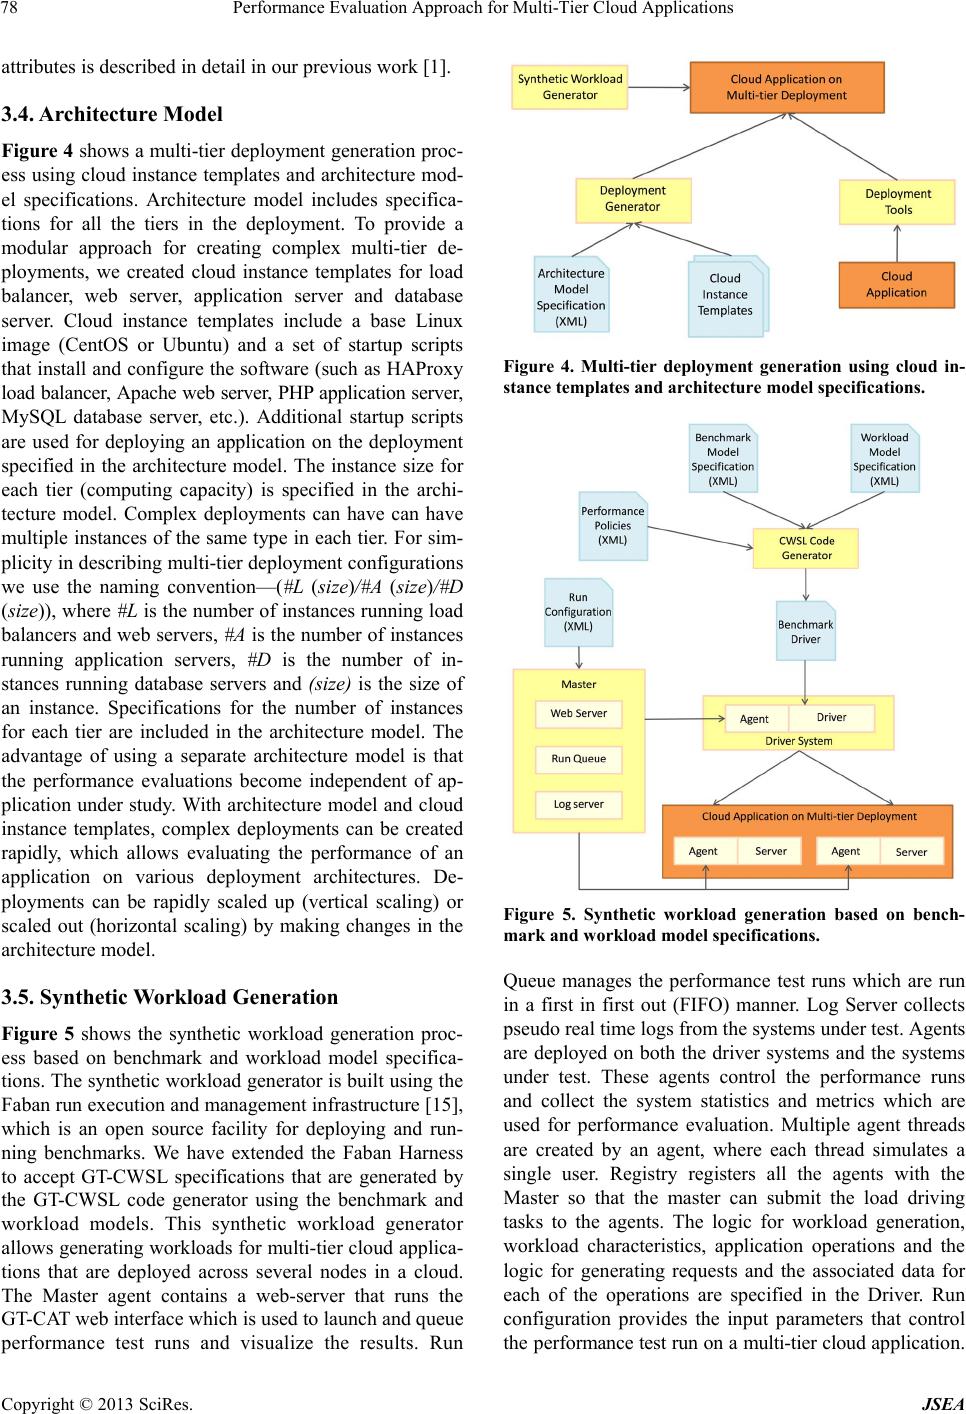
3.6. Deployment Prototyping
Though from the standpoint of a user, the cloud comput-
ing resources should look limit-less, however due to
complex dependencies that exist between servers in va-
rious tiers, applications can experience performance bot-
tlenecks. Deployment prototyping can help in making de-
ployment architecture design choices. By comparing per-
formance of alternative deployment architectures, de-
ployment prototyping can help in choosing the best and
most cost effective deployment architecture that can meet
the application performance requirements.
Given the performance requirements for an application,
the deployment design is an iterative process that in-
volves the following steps:
1) Deployment Design: Create the deployment with
various tiers as specified in the deployment configuration
and deploy the application.
2) Performance Evaluation: Verify whether the appli-
cation meets the performance requirements with the de-
ployment.
3) Deployment Refinement: Deployments are refined
based on the performance evaluations. Various alterna-
tives can exist in this step such as vertical scaling, hori-
zontal scaling, etc.
3.7. Bottleneck Detection
Traditional approaches for bottleneck detection in multi-
tier systems have used average resou rce utilization values
for bottleneck analysis. However, complex-multi-tier
cloud applications can experience non-stationary work-
loads. Average values fail to capture stochastic non-sta-
tionary seasonality in workloads. Therefore, we use ker-
nel density estimates for bottleneck detection. A proba-
bility density esti mate of the data is compu ted based on a
normal kernel function using a window parameter that is
a function of the number of data points. Kernel density
estimates indicate the percentage of time a resource spent
at a particular utilization level. In Section 3.7, we demon-
strate the bottleneck detection approach with three set of
experiments with different deployment architectures.
4. Experiment Setup
To demonstrate the proposed approaches for performance
evaluation, deployment prototyping and bottleneck de-
tection, we used the Rice University Bidding System [13]
benchmark. RUBiS is an auction site prototype which
has been modeled after the internet auction website eBay.
We used a PHP implementation of RUBiS for the ex-
periments. For measuring system statistics, we used sys-
tat and collectd utilities. To study the effect of different
deployment configurations of the application perform-
ance we performed a series of experiments by varying
the architecture model and the application deployment
configurations. The experiments were carried out using
the Amazon Elastic Compute Cloud (Amazon EC2) in-
stances. For the experiments we used small (1 EC2 com-
pute unit), large (4 EC2 compute units) and extralarge (8
EC2 compute unit) instances, where each EC2 compute
unit provides an equivalent CPU capacity of 1.0 - 1.2
GHz 2007 Opteron processor or 2007 Xeon processor.
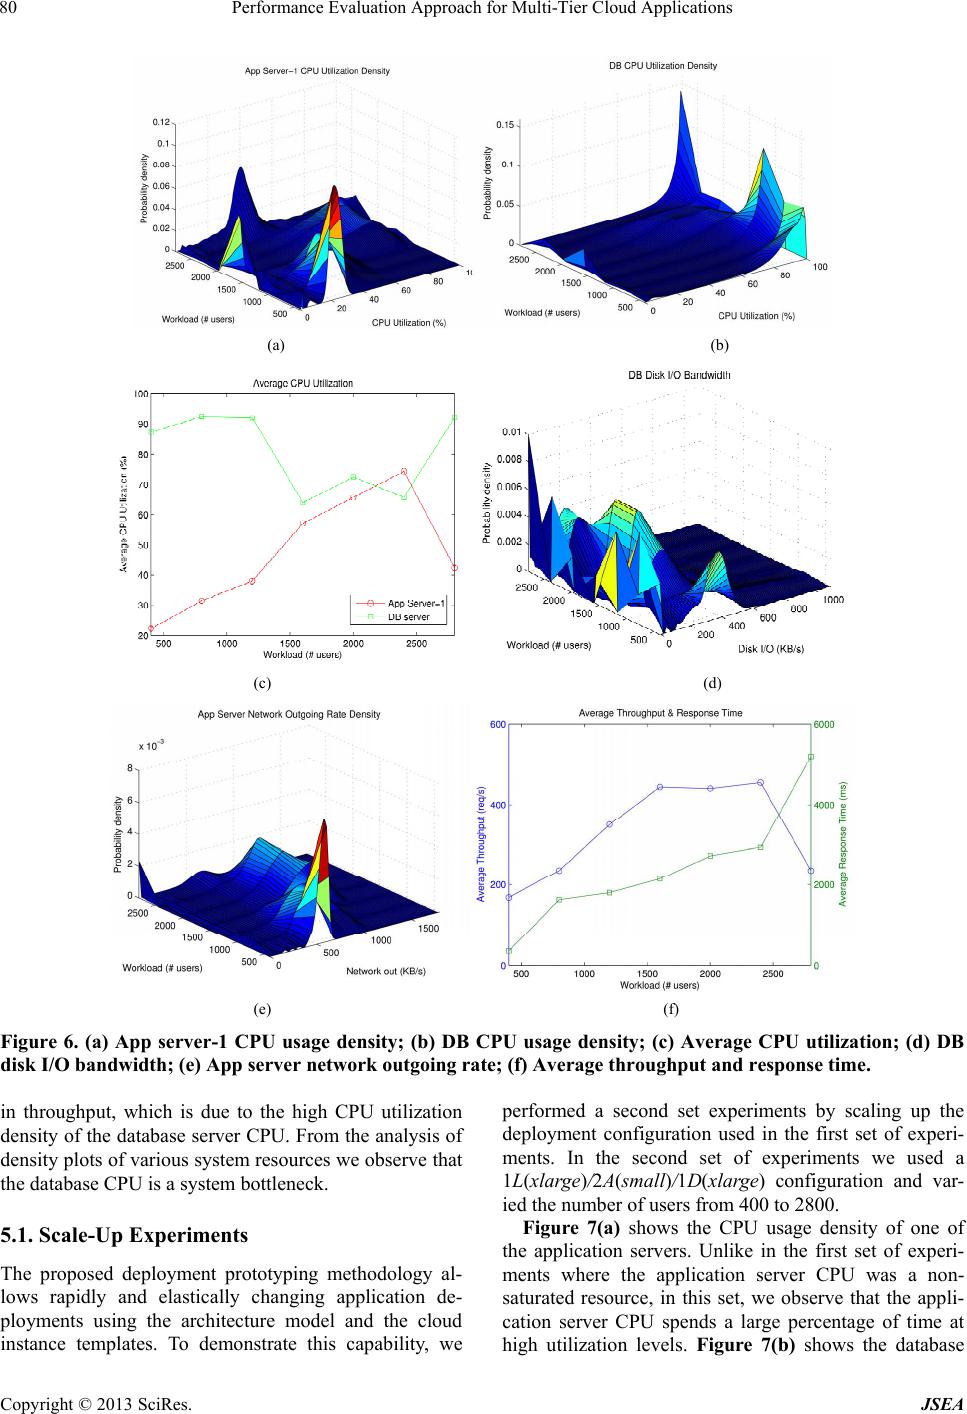
5. Results
We instrumented the PHP implementation of the RUBiS
benchmark application and obtained the traces of the user
requests. From the analysis of the logged traces the
benchmark and workload models were generated. In the
first set of experiments we used a 1L(large)/2A(small)
/1D(small) configuration and varied the number of users
from 400 to 2800. For these experiments we used ramp
up and ramp down times of 1 minute and steady state
time of 10 minutes.
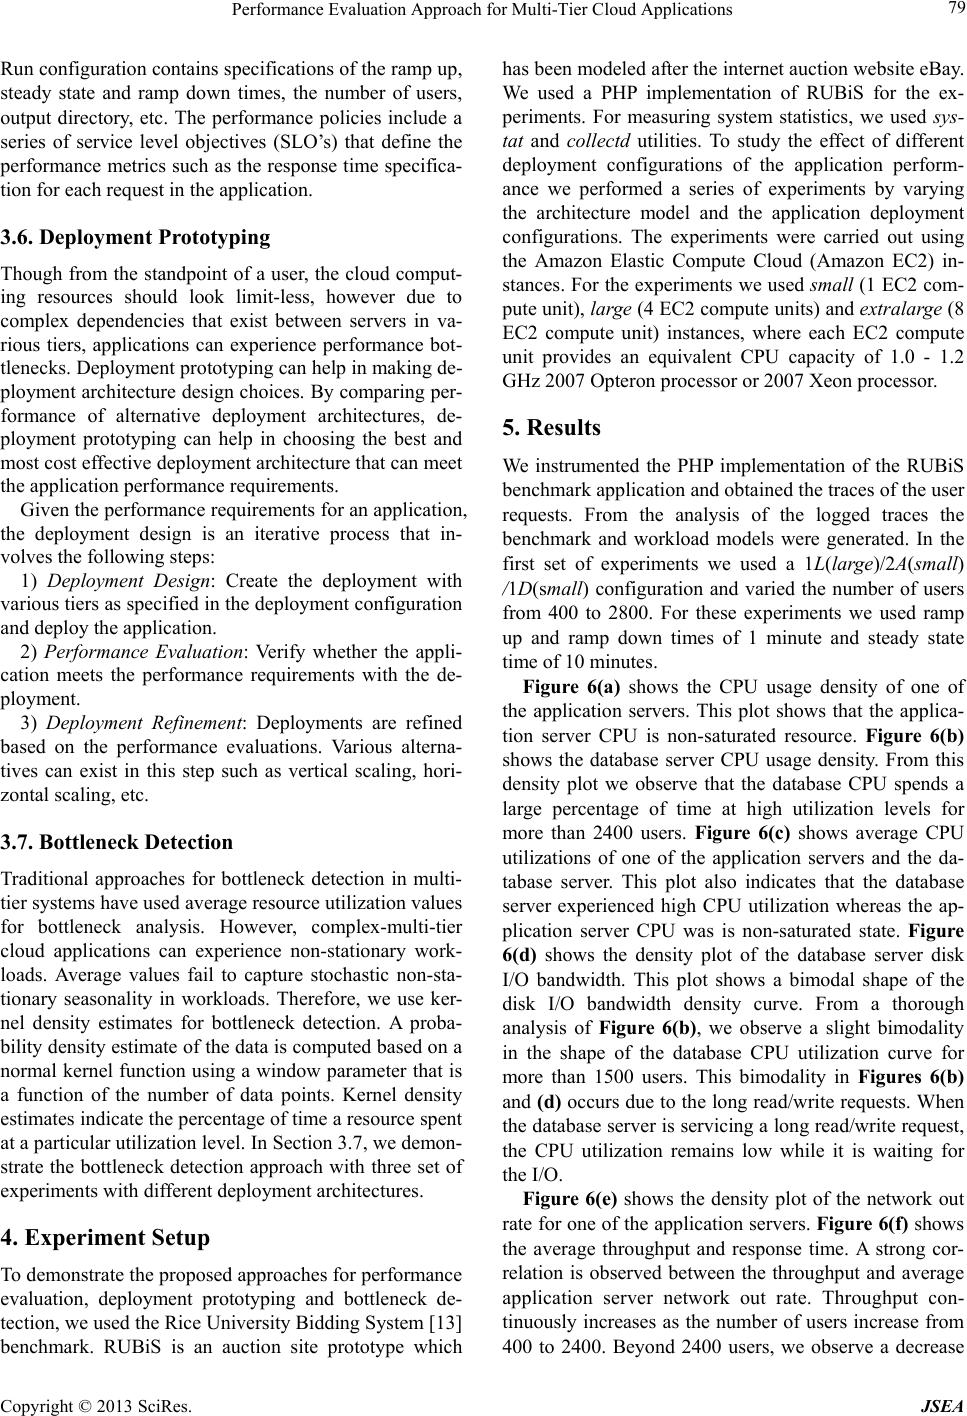
Figure 6(a) shows the CPU usage density of one of
the application servers. This plot shows that the applica-
tion server CPU is non-saturated resource. Figure 6(b)
shows the database server CPU usage density. From this
density plot we observe that the database CPU spends a
large percentage of time at high utilization levels for
more than 2400 users. Figure 6(c) shows average CPU
utilizations of one of the application servers and the da-
tabase server. This plot also indicates that the database
server experienced high CPU utilization whereas the ap-
plication server CPU was is non-saturated state. Figure
6(d) shows the density plot of the database server disk
I/O bandwidth. This plot shows a bimodal shape of the
disk I/O bandwidth density curve. From a thorough
analysis of Figure 6(b), we observe a slight bimodality
in the shape of the database CPU utilization curve for
more than 1500 users. This bimodality in Figures 6(b)
and (d) occurs due to the long read/write requests. When
the database server is servicing a long read/write request,
the CPU utilization remains low while it is waiting for
the I/O.
Figure 6(e) shows the density plot of the network out
rate for one of the app lication servers. Figure 6(f) shows
the average throughput and response time. A strong cor-
relation is observed between the throughput and average
application server network out rate. Throughput con-
tinuously increases as the number of users increase from
400 to 2400. Beyond 2400 users, we observe a decrease
Copyright © 2013 SciRes. JSEA
Performance Evaluation Approach for Multi-Tier Cloud Applications
Copyright © 2013 SciRes. JSEA
80
(a) (b)
(c) (d)
(e) (f)
Figure 6. (a) App server-1 CPU usage density; (b) DB CPU usage density; (c) Average CPU utilization; (d) DB
disk I/O bandwidth; (e) App server network outgoing rate; (f) Average throughput and response time.
in throughput, which is due to the high CPU utilization
density of the database server CPU. From the analysis of
density plots of various system resources we observe that
the database CPU is a system bottleneck.
5.1. Scale-Up Experiments
The proposed deployment prototyping methodology al-
lows rapidly and elastically changing application de-
ployments using the architecture model and the cloud
instance templates. To demonstrate this capability, we
performed a second set experiments by scaling up the
deployment configuration used in the first set of experi-
ments. In the second set of experiments we used a
1L(xlarge)/2A(small)/1D(xlarge) configuration and var-
ied the number of users from 400 to 2800.
Figure 7(a) shows the CPU usage density of one of
the application servers. Unlike in the first set of experi-
ments where the application server CPU was a non-
saturated resource, in this set, we observe that the appli-
cation server CPU spends a large percentage of time at
high utilization levels. Figure 7(b) shows the database
Performance Evaluation Approach for Multi-Tier Cloud Applications 81
server CPU usage density. From this plot we observe that
the database server CPU is a non-saturated resource.
Figure 7(c) shows average CPU utilization s of one of the
application servers and the database server. This plot also
indicates that the application server experienced high
CPU utilization whereas the datab ase server CPU was in
a non-saturated state.
Figure 7(d) shows the average throughput and re-
sponse time. Comparing throughput and response time-
plots of the first and second set of experiments we ob-
serve that the maximum throughputs in both set of ex-
periments are very similar. However, the response times
in the second set of experiments are lower than those in
the first set, which is due to the higher compute capaci-
ties of the load balancer, web server and database server
in the second set as compared to the first set.
Comparing results of first and second set of experi-
ments, we observe that system bottleneck shifts from
database CPU in first set to application server CPU in the
second set. Scaling-up the deployment configuration
from 1L(large)/2A(small)/1D(small ) to 1L(xlarge)/2A
(small)/1D(xlarge), does not result in increase in
throughput, however lower response times are observed
with the scaled-up deployment.
5.2. Scale-Out Experiments
We performed a third set experiments by scaling out the
deployment configuration used in the first set of experi-
ments. In the third set of experiments we used a
1L(xlarge)/3A(small)/1D(xlarge) configuration and var-
ied the number of users from 400 to 2800.
Figure 8(a) shows the CPU usage density of one of
the application servers. We observe that the application
server CPU spends a large percentage of time at high
utilization levels for more than 2000 users. Figure 8(b)
shows the database server CPU usage density. From this
plot we observe that the database server CPU is a
non-saturated resource. Figure 8(c) shows average CPU
utilizations of one of the application servers and the da-
tabase server. This plot also indicates that the application
server experienced high CPU utilization whereas the da-
tabase server CPU was in a non-saturated state. Figure
8(d) shows the average throughput and response time.
Comparing throughput and response time plots of the
eond and third set of experiments we observe that the s c
(a) (b)
(c) (d)
Figure 7. Scale-up experime nt: (a) App se rver-1 CPU usage dens ity; (b) DB CPU usage density; (c) Average CPU
utilization; (d) Average thro ughput and response time.
Copyright © 2013 SciRes. JSEA
Performance Evaluation Approach for Multi-Tier Cloud Applications
82
(a) (b)
(c) (d)
Figure 8. Scale-out experiment: (a) App server-1 CPU usage density; (b) DB CPU usage density; (c) Average
CPU utilization; (d) Average throughput and response time.
maximum throughput in the third set is more than the
second set. Moreover, slightly lower response times are
observed in the third set as compared to the second set.
Comparing results of second and third set of experi-
ments, we observe that scaling-out the deployment con-
figuration from 1L(xlarge)/2A(small)/1D(xlarge) to 1L
(xlarge)/3A(small)/1D(xlarge), results in an increase in
throughput and decrease in re sponse times.
6. Results Interpretation
In this section we provide a general interpretation of the
results shown in Section 5 and also provide design guide-
lines for multi-tier deployments architectures. There are
several factors that should be considered before design-
ing multi-tier deployments architectures:
1) Performance requirements: Performance require-
ments are typically specified in the service level agree-
ments (SLA) which provide response time or throughput
requirements for each request type (or web page) in the
application. Before designing a multi-tier deployment, a
careful understanding of the performance requirements is
required. The proposed deplo yment prototypin g approach
can help in making the right choices for deployment ar-
chitectures. From results in Section 5 we observe that
throughput increases as the number of users submitting
requests to an application increase and eventually be-
comes relatively constant and may even drop due to sys-
tem bottlenecks. The maximum throughput is limited by
system bottlenecks such as high CPU utilizations of
servers in various tiers, database disk I/O bandwidth, etc.
2) Workload Characteristics: Performance of multi-
tier cloud applications can be highly sensitive to th e cha-
racteristics of workloads. Insights into characteristics of
application workloads can help in making the right de-
sign choices for deployment architectures. For example,
an application that has database read intensive workloads,
can benefit from a database cluster that services the read
requests [16]. For read intensive workload, distributed
memory object caching systems such as Memcached
servers can also speed up the application performance
[17]. Applications with database read/write intensive
workloads, can benefit from high memory and high CPU
capacity cloud instances. Characterization of workload
Copyright © 2013 SciRes. JSEA
Performance Evaluation Approach for Multi-Tier Cloud Applications 83
attributes such as session length, inter-session interval,
think-time, workload mix, etc. by analysis of logged
traces of applications, can help in getting insights into the
workload characteristics.
3) Cost: From the results in Section 5, we observed
that both horizontal and vertical scaling can help in im-
proving application performance. Both types of scaling
options involve additional costs either for launching ad-
ditional servers or provisioning servers with higher mem-
ory and compute capacities. The proposed deployment
prototyping approach can help in rapidly comparing de-
ployments with both types of scaling options. Thus, with
deployment prototyping the most cost-effective deploy-
ment architecture can be chosen.
4) Complexity: A simplified deployment architecture
can be more easier to design and manage. Therefore,
depending on application performance and cost require-
ments, it may be more beneficial to scale vertically in-
stead of horizontally. For example, if equivalent amount
of performance can be obtained at a more cost-effective
rate, then deployment architectures can be simplified
using small number of large server instances (vertical
scaling) rather than using a large number of small server
instances (horizontal scaling).
7. Conclusion
In this paper, we describe a generic performance evalua-
tion methodology for complex multi-tier applications de-
ployed in cloud computing environments. The proposed
methodology captures multi-tier application workloads
and deployment architectures in three separate mod-
els-benchmark model, workload model and architecture.
The advantage of using three separate models to capture
workload characteristics and deployment architectures is
that the performance evaluation process becomes inde-
pendent of application under study. Results show that
with the proposed deployment prototyping and bottle-
neck detection approaches it is possible to rapidly com-
pare different deployment architectures and detect system
bottlenecks, so th at the right design choices can be made
for deployment architectures .
REFERENCES
[1] A. Bahga and V. K. Madisetti, “Synt hetic Workload Gen-
eration for Cloud Computing Applications,” Journal of
Software Engineering and Applications, Vol. 4, No. 7,
2011, pp. 396-410. doi:10.4236/jsea.2011.47046
[2] SPECweb99, 2012.
http://www.spec.org/osg/web99
[3] P. Barford and M. E. Crovella, “Generating Representa-
tive Web Workloads for Network and Server Perform-
ance Evaluation,” SIGMETRICS, Vol. 98, 1998, pp. 151-
160.
[4] D. Krishnamurthy, J. A. Rolia and S. Majumdar, “SWAT:
A Tool for Stress Testing Session-Based Web Applica-
tions,” Proceedings of International CMG Conference,
Dallas, 7-12 December 2003, pp. 639-649.
[5] H. P. LoadRunner, 2012.
http://www8.hp.com/us/en/software/software-product.htm
l?compURI=tcm:245-935779
[6] A. Mahanti, C. Williamson and D. Eager, “Traffic Analy-
sis of a Web Proxy Caching Hierarchy,” IEEE Network,
Vol. 14, No. 3, 2000, pp. 16-23.
doi:10.1109/65.844496
[7] S. Manley, M. Seltzer and M. Courage, “A Self-Scaling
and Self-Configuring Benchmark for Web Servers,” Pro-
ceedings of the ACM SIGMETRICS Conference, Madison,
22-26 June 1998.
[8] Webjamma, 2012.
http://www.cs.vt.edu/ chitra/webjamma.html,
[9] G. Abdulla, “Analysis and Modeling of World Wide Web
Traffic,” Ph.D. Thesis, Chair-Edward A. Fox, 1998.
[10] M. Crovella and A. Bestavros, “Self-Similarity in World
Wide Web Traffic: Evidence and Possible Causes, IEEE/
ACM Trans,” Networking, Vol. 5, No. 6, 1997, pp. 835-
846. doi:10.1109/90.650143
[11] D. Mosberger and T. Jin, “httperf: A Tool for Measuring
Web Server Performance,” ACM Performance Evaluation
Review, Vol. 26, No. 3, 1998, pp. 31-37.
doi:10.1145/306225.306235
[12] D. Garcia and J. Garcia, “TPC-W E-Commerce Bench-
mark Eval uation,” IEEE Computer, 2003.
[13] RUBiS, 2012. http://rubis.ow2.org
[14] TPC-W, 2012. http://jmob.ow2.org/tpcw.html
[15] Faban, 2012. http://faban.sunsource.net
[16] 2012. http://www.mysql.com/products/cluster
[17] 2012. http://memcached.org
Copyright © 2013 SciRes. JSEA