 J. Biomedical Science and Engineering, 2013, 6, 124-133 JBiSE http://dx.doi.org/10.4236/jbise.2013.62016 Published Online February 2013 (http://www.scirp.org/journal/jbise/) Monitoring vascular changes induced by photodynamic therapy using contrast-enhanced micro-computed tomography Otilia C. Nasui1, Stuart K. Bisland2, Nancy L. Ford1,3* 1Department of Physics, Ryerson University, Toronto, Canada 2Division of Orthopaedic Surgery, McMaster University, Hamilton, Canada 3Department of Oral Biological and Medical Sciences, University of British Columbia, Vancouver, Canada Email: nlford@dentistry.ubc.ca Received 3 January 2013; revised 3 February 2013; accepted 10 February 2013 ABSTRACT The aim of this study was to determine whether con- trast-enhanced micro-computed tomography can be used for non-invasive imaging of the early-stage changes in the vasculature of tumours that have been treated with photodynamic therapy (PDT). The sub- jects used were C3H mice with an RIF-1 tumour im- planted subcutaneously and allowed to grow for 3 weeks prior to treatment. The experimental groups were PDT-treated (150 J/cm2 and 50 J/cm2) and con- trol (150 J/cm2 light-only and untreated). The laser light exposure was performed at 15 - 30 minutes after the administration of the photosensitizer (BPD-MA). The contrast-enhanced micro-computed tomography imaging procedure consisted of eight-second scans taking place before treatment and up to 24 hours af- ter treatment. The 150 J/cm2 PDT group showed a significant increase in the ratio of blood volume to tumour volume at 2, 8 and 24 hours after treatment when compared to pre-treatment measurements (p < 0.01). The observed increase in the blood volume to tumour volume at the later time points corresponds to a decrease in epithelial coverage on immunohisto- chemical stained (CD31) slides for the 150 J/cm2 PDT group at 24 hours after treatment. This preliminary study indicates that micro-CT can detect compro- mised vasculature in tumours treated with high-flu- ence photodynamic therapy as early as 2 hours post treatment. Keywords: Micro-Computed Tomography; Contrast Agent; Animal Model; Photodynamic Therapy; Cancer 1. INTRODUCTION Photodynamic therapy (PDT) is a cancer treatment able to cause selective destruction of tumours while avoiding damage to adjacent healthy tissue. Depending on the photosensitizer used, the effects induced can be vascular or non-vascular. One photosensitizing agent, benzopor- phyrin derivative monoacid ring (BPD-MA), has been shown previously to induce vascular collapse in eye con- ditions and tumours [1]. The treatment efficacy depends on the time interval between the administration of the photosensitizer and the light exposure as well as the du- ration of the light delivery. In the 15 to 30 minutes fol- lowing administration, the photosensitizer remains within the blood vessels, and therefore only vascular effects are obtained upon activation with the laser. Beyond this time interval, the photosensitizer leaks out of the vasculature and into the surrounding tissue allowing for PDT de- struction to occur in the surrounding tissue [2-5]. Photosensitizer kinetics and efficacy in the treatment of different tumour types can be studied in preclinical rodent models. For monitoring of the PDT treatment ef- ficacy non-invasively and longitudinally, imaging tech- niques such as magnetic resonance imaging, ultra- sound, and optical coherence tomography have been investi- gated [6-9]. In ultrasound, it is difficult to obtain an iso- tropic representation of the treated tumour as the spatial resolution varies with depth and position of the trans- ducer. In addition, tissue properties change as a result of PDT treatment making registration of images acquired at different time points difficult. Ultrasound is currently being used in cell studies in vitro where depth and tissue inhomogeneity are not a problem [6]. In optical coherence tomography, the resolution ex- ceeds 10 m, but the limitation is that only one image at a specific depth can be acquired for each time point. The tissue properties change over time in response to treat- ment; therefore, in a longitudinal study, it could be diffi- cult to identify and obtain sequential images at the same depth or even in the same plane that was previously cho- *Formerly at Ryerson University. OPEN ACCESS 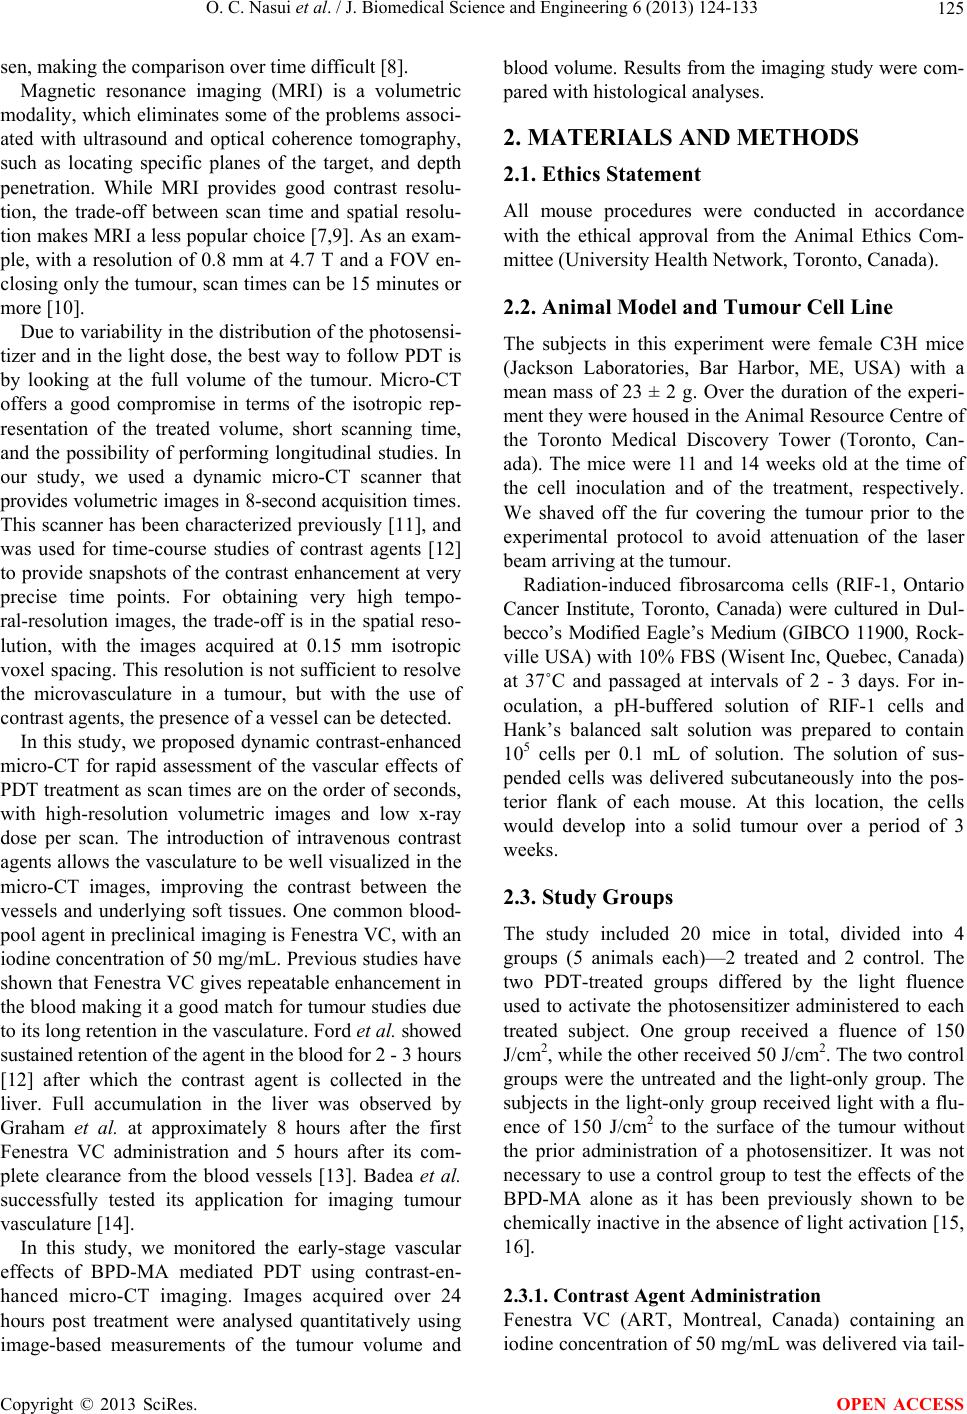 O. C. Nasui et al. / J. Biomedical Science and Engineering 6 (2013) 124-133 125 sen, making the comparison over time difficult [8]. Magnetic resonance imaging (MRI) is a volumetric modality, which eliminates some of the problems associ- ated with ultrasound and optical coherence tomography, such as locating specific planes of the target, and depth penetration. While MRI provides good contrast resolu- tion, the trade-off between scan time and spatial resolu- tion makes MRI a less popular choice [7,9]. As an exam- ple, with a resolution of 0.8 mm at 4.7 T and a FOV en- closing only the tumour, scan times can be 15 minutes or more [10]. Due to variability in the distribution of the photosensi- tizer and in the light dose, the best way to follow PDT is by looking at the full volume of the tumour. Micro-CT offers a good compromise in terms of the isotropic rep- resentation of the treated volume, short scanning time, and the possibility of performing longitudinal studies. In our study, we used a dynamic micro-CT scanner that provides volumetric images in 8-second acquisition times. This scanner has been characterized previously [11], and was used for time-course studies of contrast agents [12] to provide snapshots of the contrast enhancement at very precise time points. For obtaining very high tempo- ral-resolution images, the trade-off is in the spatial reso- lution, with the images acquired at 0.15 mm isotropic voxel spacing. This resolution is not sufficient to resolve the microvasculature in a tumour, but with the use of contrast agents, the presence of a vessel can be detected. In this study, we proposed dynamic contrast-enhanced micro-CT for rapid assessment of the vascular effects of PDT treatment as scan times are on the order of seconds, with high-resolution volumetric images and low x-ray dose per scan. The introduction of intravenous contrast agents allows the vasculature to be well visualized in the micro-CT images, improving the contrast between the vessels and underlying soft tissues. One common blood- pool agent in preclinical imaging is Fenestra VC, with an iodine concentration of 50 mg/mL. Previous studies have shown that Fenestra VC gives repeatable enhancement in the blood making it a good match for tumour studies due to its long retention in the vasculature. Ford et al. showed sustained retention of the agent in the blood for 2 - 3 hours [12] after which the contrast agent is collected in the liver. Full accumulation in the liver was observed by Graham et al. at approximately 8 hours after the first Fenestra VC administration and 5 hours after its com- plete clearance from the blood vessels [13]. Badea et al. successfully tested its application for imaging tumour vasculature [14]. In this study, we monitored the early-stage vascular effects of BPD-MA mediated PDT using contrast-en- hanced micro-CT imaging. Images acquired over 24 hours post treatment were analysed quantitatively using image-based measurements of the tumour volume and blood volume. Results from the imaging study were com- pared with histological analyses. 2. MATERIALS AND METHODS 2.1. Ethics Statement All mouse procedures were conducted in accordance with the ethical approval from the Animal Ethics Com- mittee (University Health Network, Toronto, Canada). 2.2. Animal Model and Tumour Cell Line The subjects in this experiment were female C3H mice (Jackson Laboratories, Bar Harbor, ME, USA) with a mean mass of 23 ± 2 g. Over the duration of the experi- ment they were housed in the Animal Resource Centre of the Toronto Medical Discovery Tower (Toronto, Can- ada). The mice were 11 and 14 weeks old at the time of the cell inoculation and of the treatment, respectively. We shaved off the fur covering the tumour prior to the experimental protocol to avoid attenuation of the laser beam arriving at the tumour. Radiation-induced fibrosarcoma cells (RIF-1, Ontario Cancer Institute, Toronto, Canada) were cultured in Dul- becco’s Modified Eagle’s Medium (GIBCO 11900, Rock- ville USA) with 10% FBS (Wisent Inc, Quebec, Canada) at 37˚C and passaged at intervals of 2 - 3 days. For in- oculation, a pH-buffered solution of RIF-1 cells and Hank’s balanced salt solution was prepared to contain 105 cells per 0.1 mL of solution. The solution of sus- pended cells was delivered subcutaneously into the pos- terior flank of each mouse. At this location, the cells would develop into a solid tumour over a period of 3 weeks. 2.3. Study Groups The study included 20 mice in total, divided into 4 groups (5 animals each)—2 treated and 2 control. The two PDT-treated groups differed by the light fluence used to activate the photosensitizer administered to each treated subject. One group received a fluence of 150 J/cm2, while the other received 50 J/cm2. The two control groups were the untreated and the light-only group. The subjects in the light-only group received light with a flu- ence of 150 J/cm2 to the surface of the tumour without the prior administration of a photosensitizer. It was not necessary to use a control group to test the effects of the BPD-MA alone as it has been previously shown to be chemically inactive in the absence of light activation [15, 16]. 2.3.1. Cont ras t Agent Admi nistration Fenestra VC (ART, Montreal, Canada) containing an iodine concentration of 50 mg/mL was delivered via tail- Copyright © 2013 SciRes. OPEN ACCESS 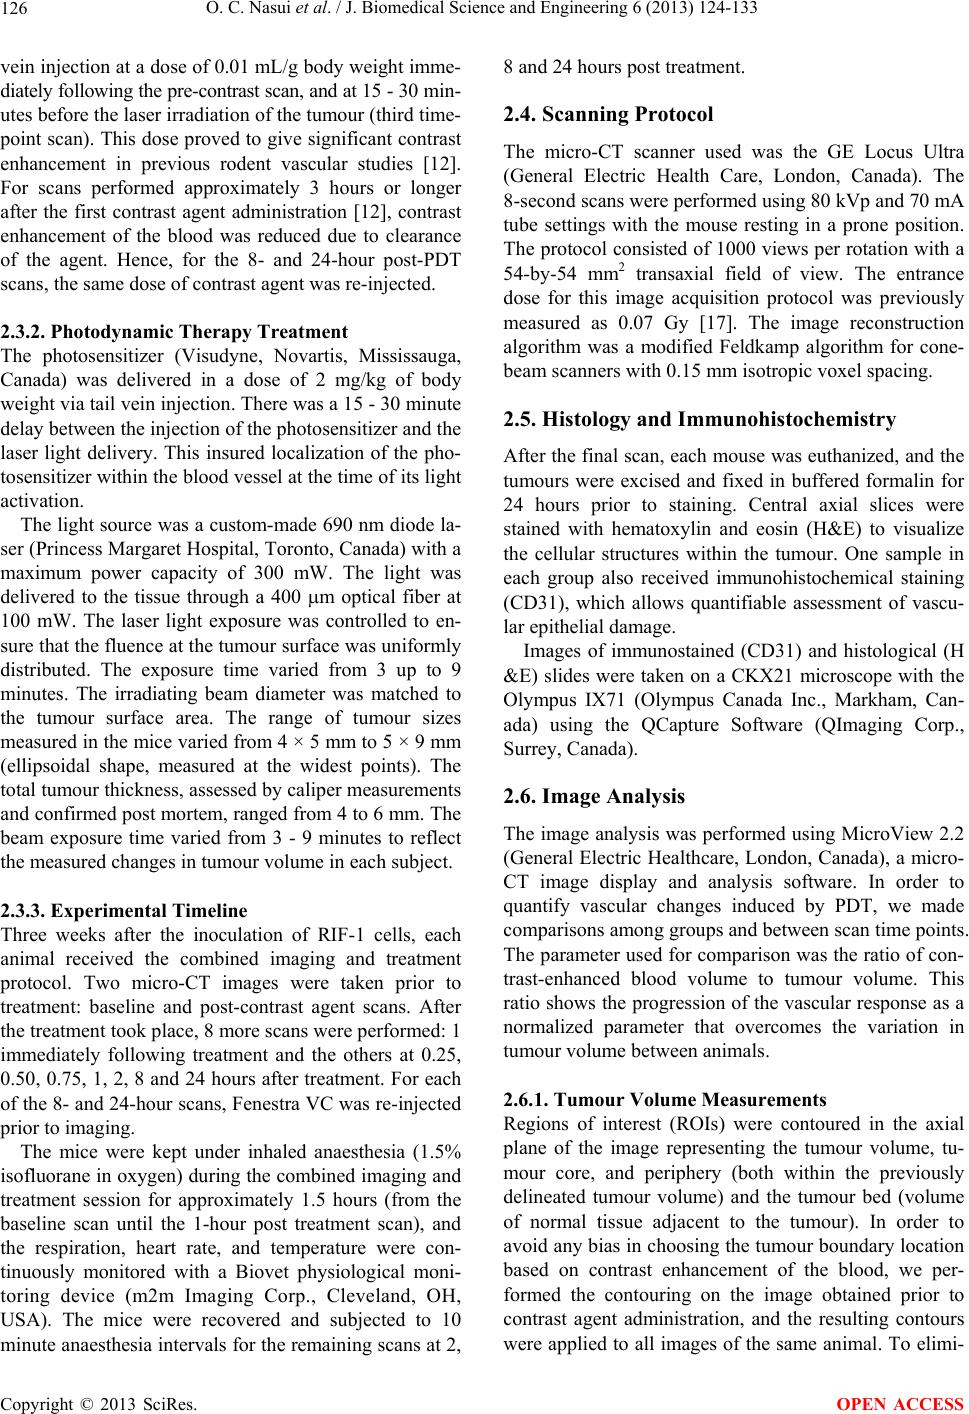 O. C. Nasui et al. / J. Biomedical Science and Engineering 6 (2013) 124-133 126 vein injection at a dose of 0.01 mL/g body weight imme- diately following the pre-contrast scan, and at 15 - 30 min- utes before the laser irradiation of the tumour (third time- point scan). This dose proved to give significant contrast enhancement in previous rodent vascular studies [12]. For scans performed approximately 3 hours or longer after the first contrast agent administration [12], contrast enhancement of the blood was reduced due to clearance of the agent. Hence, for the 8- and 24-hour post-PDT scans, the same dose of contrast agent was re-injected. 2.3.2. Photodynamic Therapy Treatment The photosensitizer (Visudyne, Novartis, Mississauga, Canada) was delivered in a dose of 2 mg/kg of body weight via tail vein injection. There was a 15 - 30 minute delay between the injection of the photosensitizer and the laser light delivery. This insured localization of the pho- tosensitizer within the blood vessel at the time of its light activation. The light source was a custom-made 690 nm diode la- ser (Princess Margaret Hospital, Toronto, Canada) with a maximum power capacity of 300 mW. The light was delivered to the tissue through a 400 m optical fiber at 100 mW. The laser light exposure was controlled to en- sure that the fluence at the tumour surface was uniformly distributed. The exposure time varied from 3 up to 9 minutes. The irradiating beam diameter was matched to the tumour surface area. The range of tumour sizes measured in the mice varied from 4 × 5 mm to 5 × 9 mm (ellipsoidal shape, measured at the widest points). The total tumour thickness, assessed by caliper measurements and confirmed post mortem, ranged from 4 to 6 mm. The beam exposure time varied from 3 - 9 minutes to reflect the measured changes in tumour volume in each subject. 2.3.3. Experimental Timeline Three weeks after the inoculation of RIF-1 cells, each animal received the combined imaging and treatment protocol. Two micro-CT images were taken prior to treatment: baseline and post-contrast agent scans. After the treatment took place, 8 more scans were performed: 1 immediately following treatment and the others at 0.25, 0.50, 0.75, 1, 2, 8 and 24 hours after treatment. For each of the 8- and 24-hour scans, Fenestra VC was re-injected prior to imaging. The mice were kept under inhaled anaesthesia (1.5% isofluorane in oxygen) during the combined imaging and treatment session for approximately 1.5 hours (from the baseline scan until the 1-hour post treatment scan), and the respiration, heart rate, and temperature were con- tinuously monitored with a Biovet physiological moni- toring device (m2m Imaging Corp., Cleveland, OH, USA). The mice were recovered and subjected to 10 minute anaesthesia intervals for the remaining scans at 2, 8 and 24 hours post treatment. 2.4. Scanning Protocol The micro-CT scanner used was the GE Locus Ultra (General Electric Health Care, London, Canada). The 8-second scans were performed using 80 kVp and 70 mA tube settings with the mouse resting in a prone position. The protocol consisted of 1000 views per rotation with a 54-by-54 mm2 transaxial field of view. The entrance dose for this image acquisition protocol was previously measured as 0.07 Gy [17]. The image reconstruction algorithm was a modified Feldkamp algorithm for cone- beam scanners with 0.15 mm isotropic voxel spacing. 2.5. Histology and Immunohistochemistry After the final scan, each mouse was euthanized, and the tumours were excised and fixed in buffered formalin for 24 hours prior to staining. Central axial slices were stained with hematoxylin and eosin (H&E) to visualize the cellular structures within the tumour. One sample in each group also received immunohistochemical staining (CD31), which allows quantifiable assessment of vascu- lar epithelial damage. Images of immunostained (CD31) and histological (H &E) slides were taken on a CKX21 microscope with the Olympus IX71 (Olympus Canada Inc., Markham, Can- ada) using the QCapture Software (QImaging Corp., Surrey, Canada). 2.6. Image Analysis The image analysis was performed using MicroView 2.2 (General Electric Healthcare, London, Canada), a micro- CT image display and analysis software. In order to quantify vascular changes induced by PDT, we made comparisons among groups and between scan time points. The parameter used for comparison was the ratio of con- trast-enhanced blood volume to tumour volume. This ratio shows the progression of the vascular response as a normalized parameter that overcomes the variation in tumour volume between animals. 2.6.1. Tumour Volume Measurements Regions of interest (ROIs) were contoured in the axial plane of the image representing the tumour volume, tu- mour core, and periphery (both within the previously delineated tumour volume) and the tumour bed (volume of normal tissue adjacent to the tumour). In order to avoid any bias in choosing the tumour boundary location based on contrast enhancement of the blood, we per- formed the contouring on the image obtained prior to contrast agent administration, and the resulting contours were applied to all images of the same animal. To elimi- Copyright © 2013 SciRes. OPEN ACCESS  O. C. Nasui et al. / J. Biomedical Science and Engineering 6 (2013) 124-133 127 nate slight movements between the images, all images of the same animal were coordinate-registered to ensure that the ROI was in the correct location. The contours were then interpolated and a three-dimensional rendering of the tumour was generated and the tumour volume was calculated by Microview. For the tumour volume, the contours were selected to follow the margins of the tumour. To contour the tumour bed, the upper boundary followed the margin of the tu- mour and extended into the underlying healthy tissue. The lower boundary of the contour followed the same curvature as the upper boundary to produce a banana- shaped ROI. Extra care was taken to exclude the femur in all slices to avoid classifying the bone as contrast- enhanced blood. Each tumour bed ROI was individually scaled to the size of the tumour. The contouring of the tumour core was done using the 24 hour post-PDT image. The overall shape of the core was similar to that of the tumour—elliptical—and the diameter of the core was approximately half of the di- ameter of the tumour. No contouring was needed for the periphery, as it was obtained by image subtraction of the core from the original tumour. To assess the variability in contouring of the regions, we performed intra-observer and inter-observer studies. For the variability study, only the tumour was contoured from the baseline images of the 5 untreated mice. To assess intra-observer variability, one observer performed the contouring procedure using the same window and level settings three times with approximately one-month interval between contouring sessions. For inter-observer variability, the measurements by the first observer were compared with measurements by two additional observ- ers, who each performed the contouring procedure once using the same window and level settings. 2.6.2. Blood Volume Measurements The image acquired immediately post-contrast injection for the 5 control subjects was used to determine the grey-scale value that would separate the blood from the tumour tissue. An ROI, ranging in size from 1.27 to 1.62 mm3, was drawn such that approximately 50% of the voxels represented blood, and the rest represented tu- mour tissue. Within each ROI, the threshold value separating con- trast-enhanced blood voxels and tumour tissue voxels was found [18]. The mean value for the control animals was determined (100 HU) and applied to all images in the study. For estimates of the blood volume within the tumour, a seeded region-growing algorithm was used to select voxels with a grey-scale value above the threshold (100 HU). The blood volume was obtained within the tumour ROI, in the core and periphery regions of the tumour, and in the healthy tissue comprising the tumour bed. 2.6.3. Immunohistochemistry For one mouse in each study group, the microscopy im- ages of CD31 stained tissue taken with a 40× magnifica- tion factor were converted to threshold-based binary im- ages using Adobe Photoshop CS3 (Adobe Systems Inc., San Jose, USA). The CD31 stained areas were those of lowest intensity [19-21]—the pixels of grey-scale value of zero after the threshold-based conversion. By sum- ming up all pixels of zero grey-scale value, the total CD31 stained area was obtained, which corresponds to the epithelial coverage. The ratio of CD31-stained areas over the total tissue area was calculated. This method is an adaptation from a range of other immunohistochemical studies [22-27]. An average over three regions in each tumour section was calculated, and the four groups were compared. 2.7. Statistical Analysis For assessment of the vascular response to treatment, comparisons between treatment groups were made using repeated measures two-way ANOVA with Bonferroni post-hoc tests. The software used for the statistical analy- sis was Prism 4 (GraphPad Software Inc., San Diego, USA). 3. RESULTS The metric that we report is the blood volume in the re- gion to the volume of the region, where 4 regions were measured: tumour, tumour core, tumour periphery, and healthy tissue in the tumour bed. We compared these 4 measured values over the course of the experiment to show any changes within each treatment group over 24 hours post treatment as compared with the pre-treatment image. We also compared the treatment groups (150 J/cm2 PDT and 50 J/cm2 PDT) with the untreated groups (150 J/cm2 light-only and untreated) to determine whether there were significant differences. Micro-CT images showing the differences between the tumour vascular response among the groups are given in Figure 1, with multiplanar reformatted images in the axial plane showing the 24-hour post-PDT images of one tumour from each group. The bright regions inside the tumour represent the contrast-enhanced blood, and panel (d) shows increased contrast enhancement in the 150 J/cm2 PDT tumour compared to the other groups. 3.1. Blood Volume to Tumour Volume Ratio Comparisons between the groups showed a significantly Copyright © 2013 SciRes. OPEN ACCESS  O. C. Nasui et al. / J. Biomedical Science and Engineering 6 (2013) 124-133 Copyright © 2013 SciRes. 128 Figure 1. Sample axial view of one mouse in each study group (at the 24-hour post-PDT time-point). (a) Untreated; (b) 150 J/cm2 light-only; (c) 50 J/cm2 PDT; and (d) 150 J/cm2 PDT. Note: all images have an isotropic voxel spacing of 0.15 mm. The scale bar denotes 5 mm, and the arrow points at the location of the tumour. OPEN ACCESS Figure 2. The ratio of blood to tumour volume in the four study groups post-PDT. The timeline includes the time point imme- diately post-PDT and the 24-hour post-PDT time point. higher ratio of blood to tumour volume for the 150 J/cm2 PDT group compared with the other 3 groups at 2, 8 and 24 hours post treatment (p < 0.01). No significant dif- ferences were found at the earlier time points or for the 50 J/cm2 PDT treatment, 150 J/cm2 light-only, or control groups. Results are presented in Figure 2 as a mean of the 5 animals in each group for each time point. The two control groups and the 50 J/cm2 PDT showed slight blood volume to tumour volume increases at the 8- and 24-hour post-PDT time-points when compared to the pre-PDT time-point, which is due to additional injections of the contrast agent at 8 and 24 hours post treatment. Although the contrast enhancement in the blood was reduced at these later time points, the agent had not completely cleared from the blood. It has been shown by Ford et al. [12] that the contrast enhancement of the blood and of the liver parenchyma is equivalent at 8 hours post-injection, indicating that the contrast agent has not completely cleared from the vasculature. As a result of reinjecting the contrast agent, there is a system- atic overestimation of the blood volume at 24 hours post treatment for all treated and untreated groups due to incomplete clearance of the contrast agent from the blood at the later time points. Since the same error occurs for all animals, we believe that the trends observed in the study and the conclusions drawn are valid. 3.2. Tumour Core vs. Tumour Peripheral Changes Some vascular effects at the 8- and 24-hour post-PDT time points for the 50 J/cm2 PDT group may be lost due to averaging effects over the entire tumour. Therefore, separate comparisons in the core and the periphery of the tumour were done to identify any variations in the meas- urements of blood volume to tumour core or peripheral volume in time or between treatment groups. In the peripheral region, the ratio of blood to periphery volume results are illustrated in Figure 3(a). In each group, the ratios obtained from the pre-PDT, the 8- and the 24-hour post-PDT scans were compared. In the 150 J/cm2 PDT group, significant differences were observed at 8 and 24 hours compared with the other 3 groups (p < 0.05). No change in the blood volume-to-periphery vol- ume was detected in the two untreated groups or the 50 J/cm2 PDT group. In the core region, the ratio of blood to core volume is illustrated for all 4 groups in Figure 3(b). This ratio was significantly higher for the 150 J/cm2 PDT group at the 8- and 24-hour post-PDT time-points when compared to the untreated groups (p < 0.05) and for the 50 J/cm2 PDT group at the 24 hour time-point compared with the un-  O. C. Nasui et al. / J. Biomedical Science and Engineering 6 (2013) 124-133 129 Figure 3. Tumour periphery (a) and core (b). The ratio of the blood to periphery volume (a) and blood-to-core volume is shown at 3 time-points: pre-PDT, and 8 hours and 24 hours post-PDT. treated groups (p < 0.05). No significant differences were found betwee n the untreated groups (150 J/cm2 light- only vs. untreated) or between the treated groups (150 J/cm2 PDT vs. 50 J/cm2 PDT). 3.3. Changes in the Tissue Adjacent to the Tumour No blood-volume changes were observed for any of the four groups in the measurements of the healthy tissue in the tumour bed. As expected [4], the vasculature in the tumour bed was not affected by the PDT, suggesting that the treatment successfully targeted the tumour and spared the surrounding healthy tissue. 3.4. Immunohistochemical Results The histology slides, representative of the time point 24 hours after treatment, showed evidence of treatment in the two treated groups (Figure 4). The results obtained from the CD31-based method (Figure 5) showed that the 150 J/cm2 PDT group had the lowest ratio of epithelial area to total tissue, namely 3% ± 2%. The standard error in the ratio measurement in each group was 2% - 5%. Therefore, the 50 J/cm2 PDT and the light-only groups are indistinguishable at values of 14% ± 3% and 11% ± 5%, respectively. Lastly, the con- Figure 4. H&E staining of a tissue sample slice at 24 hours post PDT: (a) 150 J/cm2 PDT; (b) 50 J/cm2 PDT; (c) 150 J/cm2 light-only; and (d) untreated. Note: 20× magnification factor. The scale bar denotes 100 m. trol group showed the highest ratio of epithelial area to total tissue of 29% ± 5%, as expected given that minimal epidermal damage was induced in this group. Comparing the untreated tumour to the tumour that received 150 J/cm2 PDT indicates a reduced amount of epithelium in the tumour vasculature at 24 hours post PDT treatment. The same trend of a decreased amount of epithelium following PDT was also observed immuno- histochemically in other studies [19,22,25]. 3.5. Variability of Contouring ROIs The tumour volume was contoured on 3 separate occa- sions by a single observer for the baseline images of the 5 untreated mice. The tumour volume was calculated for each contouring session, and the mean and standard de- viation was determined. For the single observer, the standard deviation ranged from 3% to 8%. For assessment of interobserver variability, 2 addi- tional observers contoured the same baseline images of the untreated mice using the same window and level set- tings. The tumour volumes were calculated for each ob- server. The mean tumour volume and standard deviation were calculated for the 3 observers, with the standard deviation ranging from 10% to 30%. The means and standard deviations are tabulated for both intra-observer and inter-observer variability in Table 1. As expected, the variability was higher for the inter-observer case. The observers used for the inter-observer case were trained on using the software and were instructed on what to identify as tumour. However, these observers were not as experienced at tumour identification and so they may have selected different tumour margins, especially along the side of the tumour that bordered healthy muscle. To minimize the variability in the measurements, a single experienced observer measured all the values reported in Copyright © 2013 SciRes. OPEN ACCESS  O. C. Nasui et al. / J. Biomedical Science and Engineering 6 (2013) 124-133 Copyright © 2013 SciRes. 130 4. DISCUSSION this study. As expected, the 150 J/cm2 PDT group showed the strongest vascular response. An increase in the ratio of blood to tumour volume was observed at 2, 8 and 24 hours post treatment. In other studies, different parame- ters were monitored, including blood flow [3,5,28,29], blood volume [5], and perfusion [30,31]—which were shown to decrease over time (at 3, 6 or 24 hours). Our approach of using a ratio of the blood to tumour volume normalizes for the different tumour sizes within the group, which may account for the increased values observed in the treated groups. Table 1. Mean and standard deviation of the measurements of the tumour volume as contoured by a single observer on three occasions (intra-observer) and by 3 different observers (inter- observer). Images were from the 5 untreated control mice at baseline (no contrast agent present). Untreated subjects Intra-observer volumes (mm3) Inter-observer volumes (mm3) Mouse 1 160.61 ± 5.55 139.02 ± 27.80 Mouse 2 67.45 ± 5.67 76.05 ± 10.49 Mouse 3 112.32 ± 9.04 117.28 ± 27.53 Mouse 4 55.58 ± 2.11 45.10 ± 14.55 Mouse 5 173.79 ± 5.54 127.12 ± 26.63 Another vascular PDT effect is increased vessel per- meability [3,32] due to vessel dilation [5] and destruction of epithelial cells in the vessel walls. A decrease in the Figure 5. CD31 staining of a tissue sample slice at 24 hours post PDT: (a)-(c) 150 J/cm PDT; (d)-(f) 50 J/cm2 PDT; (g)-(i) 150 J/cm2 light-only; and (j)-(l) untreated. The images show the small epithelial co- verage noticed in the 150 J/cm2 PDT (a)-(c) when compared to the other three groups. Each row of images represents three locations (2 at periphery and 1 at core) on a slide using the 40× magnification factor. The scale bar denotes 100 μm. OPEN ACCESS  O. C. Nasui et al. / J. Biomedical Science and Engineering 6 (2013) 124-133 131 vessel epithelial area (vessel damage) in the 150 J/cm2 PDT group was confirmed by immunohistochemistry (CD31 staining). This stain indicated a smaller ratio of epithelial area to tissue area in the 150 J/cm2 PDT group at the 24 hour time point when the sample was collected. Therefore, blood (along with contrast agent) could leak out from the tumour vessels into the extravascular space, creating enhancement where no vessel was present. With the same volume of contrast agent re-introduced at 8 and 24 hours after treatment, an accumulation of contrast agent at the site of the tumour will result in an increased measured volume of contrast-enhanced blood. The 50 J/cm2 PDT group did not show significantly different results from the control groups for any of the image-based measurements of the blood to tumour ratio or in the periphery of the tumour. A slight increase in the core of the tumour was measured at 24 hours post treat- ment. The treatment effects of low light-fluence PDT were confirmed histologically. Immunohistochemically, looking at the area of vascular epithelial coverage, the results indicated similarities between the 50 J/cm2 PDT group and the light-only control groups in the amount of epithelial disruption measured. From these results, we conclude that high-fluence PDT causes increased vascu- lar disruption compared to low fluence PDT and to the untreated groups. No other imaging studies have separated the vascular effects of PDT into core and peripheral regions of the tumour. The RIF-1 tumour is known to be highly vascu- larized in both the core and the periphery, with the peri- pheral area being slightly richer in blood volume than the core [31]. The periphery effects were shown to be ob- servable with contrast-enhanced micro-CT at the later time points (8 and 24 hours post PDT) in the high flu- ence PDT group, with significantly different values compared with all other groups. In the core, differences were observed at 24 hours between the treated and un- treated groups, but there were no measurable differences between the 150 J/cm2 PDT group and the 50 J/cm2 PDT group. We believe that the PDT may not be as effective in treating the core of the tumour due to attenuation and scattering of the light as it passes through the tissue. Therefore, the core region receives a reduced light flu- ence compared to the peripheral region. The reduced light fluence in the core may lead to the reduced vascular effects we observed in the micro-CT images, and the inability to distinguish between the two PDT-treated groups. Alternatively, it could be that early necrosis has already begun in the core, making the BPD-MA delivery difficult and thereby minimizing the effects of the pho- tosensitizing light irradiation. To ensure that the PDT treatment effectively targeted the tumour, and spared the surrounding healthy tissue, blood volume measurements were made in the tumour bed. No change in the blood to tumour bed volume were observed, confirming that the PDT effects did not take place anywhere outside of the tumour [1]. By delivering the light at a suitably low fluence, the observed vascular effects are limited to the tumoural site. The main limitation of the study is in correlating the experimental end point to give the results biological relevance. In the case of PDT, there is not one single chemical that can be used to confirm or disprove that the PDT treatment took place. Therefore, depending on the aim of the study, different markers can be used that are to be associated with a particular expected effect. Be- cause we applied the laser light within 15 - 30 minutes post-BPD-MA injection, we expected that the photo- sensitizer would be localized to the vasculature, and therefore the effect of the PDT treatment would be dis- ruption of the vessels within the tumour site. We looked at the vascular epithelial cells with CD31 staining to as- sess the amount of vascular disruption caused by the BPD-MA mediated PDT treatment. In the CD31 slides, the area covered by the stain demonstrates the effect of PDT on the vascular epithelium only. For assessment of other markers of the treatment of the tumour, additional studies must be performed to follow the animals for a longer period post treatment to determine whether the tumour volume decreases over time, and to provide more histological samples for other types of staining, such as cell proliferation, apoptosis, etc. A limitation to the image-based method is the manual contouring of the tumour in the micro-CT images. Since the tumour was implanted subcutaneously, the external margins were readily appreciated by the observer. How- ever, if the tumour margin was in contact with the un- derlying muscle, the inherent contrast in the micro-CT image made separating these two tissue types more dif- ficult. The results of the variability study showed that different observers selected the tumour differently, re- sulting in a variation in the measured tumour volume. However, the single observer was very consistent in ex- tracting the tumours, which suggests that the data re- ported, which were measured by a single observer, is internally consistent for our study. The additional pre- caution of using the same contoured ROI for all images of each mouse ensured that the tumour volume was con- sistent throughout the study. Our study has provided a non-invasive means of monitoring the treatment in an in vivo model. In this study, we monitored the tumour vasculature over 24 hours post treatment. From the image-based measure- ments, we could image as early as 2 hours following 150 J/cm2 PDT treatment and gain useful information about the vascular disruption that the treatment has induced. Although we acquired a total of 10 micro-CT images, with a total entrance dose to the animal of 0.7 Gy, future Copyright © 2013 SciRes. OPEN ACCESS  O. C. Nasui et al. / J. Biomedical Science and Engineering 6 (2013) 124-133 132 studies could reduce the number of images to a pre- treatment image, and a post treatment image at 2 - 3 hours post treatment and obtain statistically significant measurements of the blood to tumour volume, blood to core volume, and blood-to-periphery volume, allowing the effectiveness of the treatment to be assessed within hours. By acquiring the post treatment image within 2 - 3 hours, we would enable imaging with a single contrast injection, which would eliminate a systematic error that we faced in this study, while ensuring stable contrast enhancement in the blood [12]. By identifying the optimal time points for imaging, there are two benefits that could be realized for future studies. First, reducing the number of images to 2 en- ables the information to be obtained with a 0.14 Gy total dose to the animal. We anticipate that this x-ray dose would be well tolerated by the animal and would not interfere with the tumour growth, as suggested by Foster et al. [17]. Second, the images could be obtained with the use of more standard micro-CT equipment, which would require longer scan times (15 - 40 minutes) but provide higher spatial resolution (0.05 - 0.1 mm). Since the con- trast enhancement remains stable for up to 4 hours post injection with Fenestra V.C. [12], implementing a higher resolution, long scan at the optimal time points should yield comparable accuracy in measuring the blood vol- ume in the tumour, with the additional ability to visualize some of the smaller vessels within the tumour. 5. CONCLUSION In this study, we used contrast-enhanced micro-CT to monitor BPD-MA mediated photodynamic therapy. Us- ing a blood-pool agent and a dynamic micro-CT scanner, the early time points following treatment were investi- gated, and measurements of the blood to tumour volume were made from the micro-CT images. Blood-to-tissue ratios were measured regionally within the tumour (pe- riphery and core), and in the surrounding healthy tissue (tumour bed) to demonstrate that the treatment effects were localized to the tumour. The treatment response was strongest in the 150 J/cm2 PDT group at 2, 8 and 24 hours after the treatment, and was more pronounced in the periphery of the tumour than in the core. Our results indicate that contrast-enhanced micro-computed tomo- graphy is a feasible tool for non-invasive monitoring of vascular changes induced by photodynamic therapy. These vascular changes can be detected as early as 2 hours post treatment for 150 J/cm2 PDT using contrast-enhanced micro-CT. 6. ACKNOWLEDGEMENTS We would like to acknowledge Dr. Brian Wilson at Princess Margaret Hospital in Toronto for sharing his equipment for the photodynamic therapy, Min Rui for her expertise in cell culturing, and Mafe Monroy for performing tail-vein injections and surgical procedures. Funding for this project was from NSERC and Ryerson University. REFERENCES [1] Richter, A.M., Jain, A.K., Canaan, A.J., et al. (1992) Pho- tosensitizing efficiency of two regioisomers of the ben- zoporphyrin derivative monoacid ring A (BPD-MA). Bio- chemical Pharmacology, 43, 2349-2358. doi:10.1016/0006-2952(92)90313-8 [2] Ichikawa, K., Takeuchi, Y., Yonezawa, S., et al. (2004) Antiangiogenic photodynamic therapy (PDT) using Visu- dyne causes effective suppression of tumor growth. Can- cer Letters, 205, 39-48. doi:10.1016/j.canlet.2003.10.001 [3] Chen, B., Pogue, B.W., Goodwin, I.A., et al. (2003) Blood flow dynamics after photodynamic therapy with vertepor- fin in the RIF-1 tumor. Radiation Research, 160, 452-459. doi:10.1667/RR3059 [4] Chen, B., Xu, Y., Roskams, T., et al. (2001) Efficacy of antitumoral photodynamic therapy with hypericin: Rela- tionship between biodistribution and photodynamic ef- fects in the RIF-1 mouse tumor model. International Journal of Cancer, 93, 275-282. doi:10.1002/ijc.1324 [5] Osaki, T., Takagi, S., Hoshino, Y., et al. (2007) Antitu- mor effects and blood flow dynamics after photodynamic therapy using benzoporphyrin derivative monoacid ring A in KLN205 and LM8 mouse tumor models. Cancer Let- ters, 248, 47-57. doi:10.1016/j.canlet.2006.05.021 [6] Banihashemi, B., Vlad, R., Debeljevic, B., et al. (2008) Ultrasound imaging of apoptosis in tumor response: No- vel preclinical monitoring of photodynamic therapy ef- fects. Cancer Research, 68, 8590-8596. doi:10.1158/0008-5472.CAN-08-0006 [7] Burch, S., London, C., Seguin, B., et al. (2009) Treatment of canine osseous tumors with photodynamic therapy: A pilot study. Clinical Orthopaedics and Related Research, 467, 1028-1034. doi:10.1007/s11999-008-0678-5 [8] Fercher, A.F., Drexler, W., Hitzenberger, C.K., et al. (2003) Optical coherence tomography—Principles and applica- tions. Reports on Progress in Physics, 66, 239-303. doi:10.1088/0034-4885/66/2/204 [9] Celli, J.P., Spring, B.Q., Rizvi, I., et al. (2010) Imaging and photodynamic therapy: Mechanisms, monitoring, and optimization. Chemical Reviews, 110, 2795-2838. doi:10.1021/cr900300p [10] Gross, S., Gilead, A., Scherz, A., et al. (2003) Monitoring photodynamic therapy of solid tumors online by BOLD- contrast MRI. Natu re Medicine, 9, 1327-1331. doi:10.1038/nm940 [11] Du, L.Y., Umoh, J., Nikolov, H.N., et al. (2007) A qual- ity assurance phantom for the performance evaluation of volumetric micro-CT systems. Physics in Medicine and Biology, 52, 7087-7108. doi:10.1088/0031-9155/52/23/021 [12] Ford, N.L., Graham, K.C., Groom, A.C., et al. (2006) Time-course characterization of the computed tomogram- phy contrast enhancement of an iodinated blood-pool Copyright © 2013 SciRes. OPEN ACCESS  O. C. Nasui et al. / J. Biomedical Science and Engineering 6 (2013) 124-133 Copyright © 2013 SciRes. 133 OPEN ACCESS contrast agent in mice using a volumetric flat-panel equipped computed tomography scanner. Investigative Radiology, 41, 384-390. doi:10.1097/01.rli.0000197981.66537.48 [13] Graham, K.C., Ford, N.L., MacKenzie, L.T., et al. (2008) Non-invasive quantification of tumour volume in precli- nical liver metastasis models using contrast-enhanced x-ray computed tomography. Investigative Radiology, 43, 92-99. doi:10.1097/RLI.0b013e31815603d7 [14] Badea, C.T., Hedlund, L.W., De Lin, M., et al. (2006) Tumor imaging in small animals with a combined mi- cro-CT/micro-DSA system using iodinated conventional and blood pool contrast agents. Contrast Media & Mo- lecular Imaging, 1, 153-164. doi:10.1002/cmmi.103 [15] Aveline, B., Hasan, T. and Redmond, R.W. (1994) Photo- physical and photosensitizing properties of benzoporphy- rin derivative monoacid ring A (BPD-MA). Photochem- istry and Photobiology, 59, 328-335. doi:10.1111/j.1751-1097.1994.tb05042.x [16] Henderson, B.W. and Dougherty, T.J. (1992) How does photodynamic therapy work? Photochemistry and Photo- biology, 55, 145-157. doi:10.1111/j.1751-1097.1992.tb04222.x [17] Foster, W.K. and Ford, N.L. (2011) Investigating the effect of longitudinal micro-CT imaging on tumour growth in mice. Physics in Medicine and Biology, 56, 315-326. doi:10.1088/0031-9155/56/2/002 [18] Otsu, N. (1979) A threshold selection method from gray- level histograms. IEEE Transactions on Systems, Man and Cybernetics, 9, 62-66. doi:10.1109/TSMC.1979.4310076 [19] Busch, T.M., Hahn, S.M., Wileyto, E.P., et al. (2004) Hypoxia and Photofrin uptake in the intraperitoneal car- cinomatosis and sarcomatosis of photodynamic therapy patients. Clinical Cancer Research, 10, 4630-4638. doi:10.1158/1078-0432.CCR-04-0359 [20] Phongkitkarun, S., Kobayashi, S., Kan, Z., et al. (2004) Quantification of angiogenesis by functional computed tomography in a matrigel model in rats. Academic Radi- ology, 11, 573-582. doi:10.1016/S1076-6332(03)00728-1 [21] Shaheen, R.M., Davis, D.W., Liu, W., et al. (1999) Anti- angiogenic therapy targeting the tyrosine kinase receptor for vascular endothelial growth factor receptor inhibits the growth of colon cancer liver metastasis and induces tumor and endothelial cell apoptosis. Cancer Research, 59, 5412-5416. [22] Hirakawa, S., Fujii, S., Kajiya, K., et al. (2005) Vascular endothelial growth factor promotes sensitivity to ultra- violet B-induced cutaneous photodamage. Blood, 105, 2392-2399. doi:10.1182/blood-2004-06-2435 [23] Kan, Z., Phongkitkarun, S., Kobayashi, S., et al. (2005) Functional CT for quantifying tumor perfusion in antian- giogenic therapy in a rat model. Radiology, 237, 151-158. doi:10.1148/radiol.2363041293 [24] McGinley, J.N., Knott, K.K. and Thompson, H.J. (2002) Semi-automated method of quantifying vasculature of 1-methyl-1-nitrosourea-induced rat mammary carcinomas using immunohistochemical detection. Journal of Histo- chemistry & Cytochemistry, 50, 213-222. doi:10.1177/002215540205000209 [25] Ojha, N., Roy, S., He, G., et al. (2008) Assessment of wound-site redox environment and the significance of Rac2 in cutaneous healing. Free Radical Biology and Me- dicine, 44, 682-691. doi:10.1016/j.freeradbiomed.2007.10.056 [26] Yeh, D.C., Bula, D.V., Miller, J.W., et al. (2004) Expres- sion of leukocyte adhesion molecules in human subfoveal choroidal neovascular membranes treated with and with- out photodynamic therapy. Investigative Ophthalmology & Visual Science, 45, 2368-2373. doi:10.1167/iovs.03-0981 [27] Kiessling, F., Krix, M., Heilmann, M., et al. (2003) Com- paring dynamic parameters of tumor vascularization in nude mice revealed by magnetic resonance imaging and contrast-enhanced intermittent power Doppler sonogram- phy. Investigative Radiology, 38, 516-524. doi:10.1097/01.rli.0000073448.16334.fe [28] Yu, G., Durduran, T., Zhou, C., et al. (2005) Noninvasive monitoring of murine tumor blood flow during and after photodynamic therapy provides early assessment of thera- peutic efficacy. Clinical Cancer Research, 11, 3543-3552. doi:10.1158/1078-0432.CCR-04-2582 [29] Kurohane, K., Tominaga, A., Sato, K., et al. (2001) Pho- todynamic therapy targeted to tumor-induced angiogenic vessels. Cancer Letters, 167, 49-56. doi:10.1016/S0304-3835(01)00475-X [30] Chen, B., Roskams, T., Xu, Y., et al. (2002) Photody- namic therapy with hypericin induces vascular damage and apoptosis in the RIF-1 mouse tumor model. Interna- tional Journal of Cancer, 98, 284-290. doi:10.1002/ijc.10175 [31] Van Geel, I.P., Oppelaar, H., Rijken, P.F., et al. (1996) Vascular perfusion and hypoxic areas in RIF-1 tumours after photodynamic therapy. British Journal of Cancer, 73, 288-293. doi:10.1038/bjc.1996.51 [32] Chen, B., Pogue, B.W., Luna, J.M., et al. (2006) Tumor vascular permeabilization by vascular-targeting photo- sensitization: Effects, mechanism, and therapeutic impli- cations. Clinical Cancer Research, 12, 917-923. doi:10.1158/1078-0432.CCR-05-1673
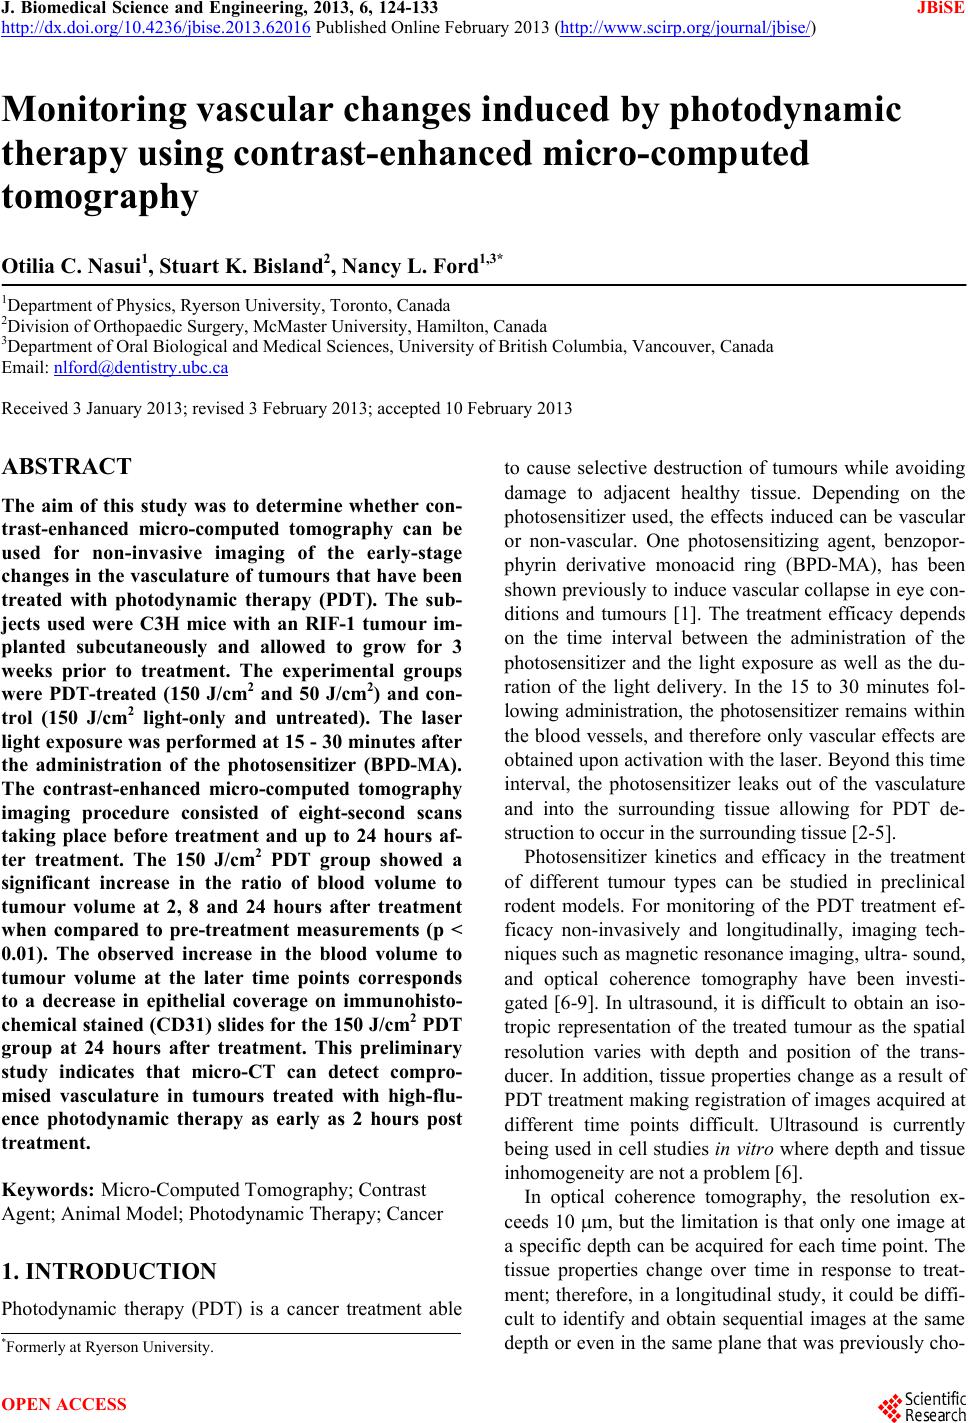
|