J. Biomedical Science and Engineering, 2013, 6, 116-123 JBiSE
http://dx.doi.org/10.4236/jbise.2013.62015 Published Online February 2013 (http://www.scirp.org/journal/jbise/)
How should we assess the mechanical properties of
lower-limb prosthesis technology used in elite sport?—An
initial investigation
Bryce Dyer, Philip Sewell, Siamak Noroozi
School of Design Engineering & Computing, Bournemouth University, Poole, UK
Email: brdyer@bournemouth.ac.uk
Received 13 December 2012; revised 12 January 2013; accepted 18 January 2013
ABSTRACT
Despite recent controversy, it is not yet formally rec-
ognised how lower-limb prosthesis should be assessed
for their performance. To assist in this process, ex-
periments are undertaken to investigate the linearity,
stiffness and assessment of feet based energy return
prosthesis technology typically used for elite level high
speed running. Through initial investigations, it is
concluded that static load testing would not be rec-
ommended to specify or regulate energy return pros-
theses for athletes with a lower-limb amputation. F ur-
thermore, an assessment of energy return technology
when loaded under dynamic conditions demonstrates
changes in mechanical stiffness due to bending and
effective blade length variation during motion. Such
radical changes of boundary conditions due to load-
ing suggest that any assessment of lower-limb pros-
thesis technology in the future should use methods
that do not assume linear mechanical stiffness. The
research into such effects warrants further investiga-
tion in the future.
Keywords: Prostheses; Stiffness; Running; Amputee;
Non-Linearity
1. INTRODUCTION
Paralympic based competition has seen major changes in
its use of technology from its inception uptil the modern
day. The introduc tion of the Seattle foot in 1981 demon-
strated the use of energy storing prosthetic feet in clinical
prescription [1]. This comprised a flexible keel housed
inside a polyurethane shell. When loaded, energy is re-
tained within the structure as potential energy and a per-
centage of this is then returned to the user to assist their
walking motion. However, extending from this devel-
opment, a significant advance for both above and below
knee amputees was made when Van Philips conceived
the Flexfoot in 1987 [1]. This design is the basis of cur-
rent sports lower-limb prosthesis technology which first
saw use in elite competition at the 1988 Paralympic
Games [2].
Lower-limb sports prostheses have been proposed as
being passive forms of technology that should not sur-
pass the performance of the limb they have replaced [3].
However, during the 2012 Paralympic Games 200 m
event, Oscar Pistorius claimed that fellow competitor
Alan Oliveira had a technological advantage through a
change in the design of the lower-limb prosthesis that he
had recently been using. As a result, a prediction of po-
tential unfairness within disability sport amputee sprint-
ing [4] now seems to being realised .
The key performance indicators of sprinting have been
proposed as ground reaction force which then directly
influences step frequency and stride length [5]. In terms
of the characteristics of elite level runners, high lower-
limb stiffness is also critical and is predominantly pro-
vided by the knee joint [6]. With a non-disabled partici-
pant, it has been repo rted that stiffness of the lower-limb
typically remains the same upto moderate running speeds
due to the leg spring length changing to compensate [7]
and has been show to increase with higher speeds [8].
However, in the case of lower-limb sprinters with a be-
low-knee amputation, it is assumed that the disabled
runner cannot modulate lower-limb stiffness to the same
degree due to the passive nature of prosthesis and a loss
of knee and/or the ankle.
Multiple methods have previously been used to assess
the contribution of lower-limb prosthesis techno logy and
these have been applied to an elite bi-lateral amputee
athlete [9]. However, this study used predominately
physiological outcome measures to determine the tech-
nological contribution of such technology. Dyer et al.
concluded that when evaluating lower-limb sports pros-
thesis, a mechanical, and equipment focused approach to
measuring performance enhancement was ethically more
desirable [3].
A biological lower-limb is a highly dynamic, stiffness
OPEN ACCESS
B. Dyer et al. / J. Biomedical Science and Engineering 6 (2013) 116-123 11 7
adjusting entity [7]. However, because an energy return
prosthesis is inherently a spring, it could be assumed that
when subjected to force, its performance can be calcu-
lated as a force-displacement curve [1] or that of a con-
stant stiffness [2]. However, dynamic variability in the
lower-limb stiffness of amputee prostheses when running
have been recorded [10]. If controversy over such tech-
nology continues in sport and functional regulation of
such technology is ultimately required [3], decisions based
upon the assumption of lower-limb prosthesis linear re-
sponse or assessment requires further investigation.
This paper attempts to initially investigate the follow-
ing research qu e stions:
1) Is static load assessment suitable to assist in the
specification of energy return based prosthesis used for
competitive running?
2) Is a prediction of en ergy return technology possible
using static load techniques?
3) Are lower-limb foot prosthesis potentially subjected
to significant boundary condition changes due to load-
ing?
2. METHODS
Three pilot investigations are undertaken to initially in-
vestigate this papers research questions. This will be at-
tempted using t hree dif ferent methods:
1) The linearity characteristic implications of energy
return prosthesis are assessed when using two different
point contact loading techniques of a statically applied
load;
2) A 15 Kg drop test of an energy return prosthesis
from a 110 mm height to see if the prosthesis point of
contact changes when subjected to a dynamic impact;
3) A qualitative assessment of steady state run tests
using energy return technology.
An “Elite Blade” composite energy return foot pros-
thesis (Chas A Blatchford & Sons Ltd, Basingstoke, UK)
is used for the purpose of tests a and b. This prosthesis is
shown in Figure 1. This prosthesis is designed to under-
take a range of activity including low speed running of a
user having a mass of circa 55 Kg. This prosthetic
“blade” is not intended for running speeds expected for
elite athletes. However, in princip le, it is essentially uses
identical energy absorption and return technology as
more specific sprinting designs.
For test c, energy return footwear (Tramp-it BV, Den
Haag, The Netherlands) was used to simulate energy
storage and return technology. This i s shown in Figure 2.
The footwear comprises a compound curved steel
spring. Due to the footwear’s extensive strapping, this
does restrict the participant’s ankle join t range of motion
but it is conceded that it will not remove the joints con-
tribution altogether. Use of this footwear is purely de-
signed to demonstrate the characteristics of energy return
Figure 1. Elite blade prosthesis.
Figure 2. Energy return footwear.
Copyright © 2013 SciRes. OPEN ACCESS
B. Dyer et al. / J. Biomedical Science and Engineering 6 (2013) 116-123
118
technology rather than be a direct equivalent replacement
for sprint prosthesis.
2.1. Linearity Characteristics of Energy Return
Prosthesis
A pilot study is conducted to investigate the linearity of
energy return prosthesis. This will note its behaviour
under load in lieu of the fact that no formalised test cur-
rently exists for spor ts pro s thesis technology.
The prosthesis is loaded using a Testometric strength
testing machine (Testometric Company Ltd., Lancashire,
UK). The test prosthesis is shown in Figure 1 and the
test machine set up is shown in Figure 3.
Two different methods of prosthesis loading are un-
dertaken in this experiment. A schematic of the two con-
ditions is shown in Figure 4.
1) A 28 mm slide of the distal end before becoming
fixed at the distal end (SDE);
2) Fixed at the distal end (FDE).
Condition “a” demonstrates a compression of the
prosthesis but the distal end is initially free to move un-
der load. It does so for a fixed distance of 28 mm after
which it then locks into position and continues to be
loaded. Condition “b” demonstrates a prosthesis com-
pressive load method whereby both the shank and the
distal end are fixed.
Figure 3. Prosthetic blade loading.
(a) (b)
Figure 4. Testometric loading conditions for: (a) SDE; and (b)
FDE method.
The prosthesis distal end of both cond itions is fix ed by
locating against a ledge within an acetyl block as the load
is applied. Ten loadings of each condition to a maximu m
load of 2000 N are conducted. 2000 N is used as this is
approximately four times the bodyweight of the intended
user for this prosthesis specification. Such a bodyweight
impact has been suggested as being consummate of high
speed running [11]. The mean of each loading is re-
corded and the coefficient of variation (CV) is used to
ensure statistical repeatability and stability of the process.
The CV is defined as Standard Deviation divided by the
mean then multiplied by 100 to reflect this ratio as a
percentage. The load application rate of each loading was
50 mm per minute.
Mechanical stiffness is calculated as load (N) divided
by deflection (mm). The stiffness’s of both the peak lo ad-
ing and the average of the full load cycle was r ecorded.
2.2. Prosthesis Drop Tests
The energy return foot prosthesis used in test (a) is also
affixed to an assembly comprising 18 Kg of total mass.
This mass/prosthesis assembly is dropped from a fixed
height to observe the impact related response. The drop
test release mechanism uses a high strength magnet with
its polarity which can be deactivated by turning a dial.
This minimises any unwanted motion of the prosthesis
prior to release. The test rig can be seen in Figure 5.
Copyright © 2013 SciRes. OPEN ACCESS
B. Dyer et al. / J. Biomedical Science and Engineering 6 (2013) 116-123 11 9
Figure 5. Prosthesis drop test rig.
Slippage of the prosthesis upon landing is minimised
by using a high friction coefficient rubber affixed across
the landing area. The falling trajectory of the prosthesis
is tracked via 3 light reflective markers. Their motion is
recorded using a digital video recorder filmed at a fre-
quency of 210 Hz . The li ght re fle cti ve markers ar e placed:
On the top face of the prosthesis “toes”.
At the arbitrary “ankle” position of the prosthesis.
At the straight, “shank” of the prosthesis.
The data is recorded from the period of prosthesis re-
lease to ground impact and then the rebound of the pros-
thesis. 10 “drops” were performed for this experiment
from a height of 110 mm. The area of interest for this
experiment is the behaviour of the prosthesis and its light
reflective markers as it contacts the ground.
The experiment is evaluated within the “Quintic” mo-
tion capture software (Quintic Consultancy Ltd. Coven-
try, UK) with further statistical evaluation performed
using the exported raw data. The data is smoothed using
software based Butterworth filters. Each light reflective
marker is tracked for their movement in both vertical and
horizontal directions during the drop test.
2.3. Energy Return Technology Run Tests
A series of steady state running test trials were performed
to simulate the dynamic loading behaviour of energy re-
turn technology. A non-disabled participant performed
the trials. The participant was a current amateur athlete
with a history of competitive running participation in
events ranging from 100 m upto the marathon distance.
They performed a self-selected warm up prior to the tests
and gave written consent for this experiment.
Two different stiffness settings of the footwear were
used. This was achieved by a fixed change in the blade
length of each shoe. These were both run under a self-
perceived speed by the participant which was requested
to be as fast as they could feasibly achieve. In total, 7
trials of each condition were und ertaken meaning for the
purposes of this study, 14 runs in total were completed.
The run tests were conducted within an indoor, dry
environment in the same session. The running area was
segregated using tap e into 3 distinct zones. There was an
initial 15 metre zone used for the participant to accelerate
from rest, a 4 metre zone whereby the participant was
asked to ensure their best maximal but steady state speed,
and finally another 15 metre zon e used for the particip ant
to safely rested-accelerate.
The running order of each trial was to perform 7 fast
of the less stiff shoe setting and then 7 fast of the shoes
stiffer setting. Whilst the stiffer blade setting of the shoe
was achieved by shortening the blade, this actually cha nged
the geometry of the blade and increased the shoes total
height by 55 mm when unloaded. Each trial was desig-
nated:
1) Symmetrical set up, less stiff blade, “fast” effort;
2) Symmetrical set up, stiffest blade setting, “fast” ef-
fort.
The trials were filmed using a single video camera po-
sitioned opposite the steady state run zone and were
filmed at a frequency of 210 Hz.
The information of interest in this trial was the steady
state speed achieved the stride length, limb to limb sym-
metry and a qualitative visual examination of the shoe
blade behaviour. The visual examination of the trials was
undertaken by reviewi ng the video footage.
3. RESULTS
3.1. Linearity Characteristics of Energy Return
Prosthesis
The results of the FDE and SDE loading conditions are
shown in Table 1.
The low coefficient of variation suggests extremely
high levels of repeatability of the prosthesis behaviour
using both the FDE and SDE methods. The SDE method
had a CV of 0.1%. The SDE method had a CV of 1.7%.
The obtained stiffness from the two methods does high-
light a distinctive difference in measured performance.
Because deflection measured by the assessment machine
will be relative, it is obvious to see a difference in the
Copyright © 2013 SciRes. OPEN ACCESS
B. Dyer et al. / J. Biomedical Science and Engineering 6 (2013) 116-123
120
Table 1. Loading method results.
Value FDESDE
Mean stiffness of load cycle (N/mm) 48 42
Average stiffness of total load cycle (N/mm) 39 26
Peak stiffness fro m 1500 N - 1950 N sample (N/mm ) 69 76
Percentage increase of peak load stiffness over average
stiffness (%) 23 61
CV of stiffness at 1950 N (%) 1.10.2
CV of average stiffness of total load cycle (%) 1.70.1
overall mean. However, there is also a difference when
measuring the last 450 N loading sample too.
The typical load/deflection plots of both the FDE and
SDE methods can be seen in Figure 6.
It can be seen that allowing a slide of the distal end
does create a significantly different obtained stiffness.
The FDE method has a higher overall mean stiffness.
The SDE method is less stiff as the changing spring
length is altering the load cycles boundary conditions
and thus its mechanical properties.
From these plots it can also be seen that the prosthesis
exhibits initial non-linear behaviour irrespective of which
loading methods are used. The SD E method do es show a
decrease in stiffness caused by the controlled distal end
drift which will be due to the relative measurement of the
machine. However, once engagement of the distal end
takes place, a reduced, progressive non-linearity is wit-
nessed and a near parallel trace of the two methods takes
place. However, whilst it appears identical, the SDE and
FDE mechanical stiffness of the upper 450 N final load
cycle of the graph trace does still have a sligh t difference
(as shown in Table 1).
3.2. Prosthesis Drop Tests
The 10 18 Kg drop tests produced rep eatable behavior of
the experiment achieving a coefficient of variation of the
dimensional movement of the light reflective markers of
9%. The typical behavior of the drop test by both the toe
and shin markers is shown in Figure 7.
Figure 7 demonstrates that upon ground contact, the
prosthesis began to rotate forwards (clockwise) approxi-
mately about the toes. The deviation from 0 mm of the
markers during initial freefall was caused by a slight
sheering of the prosthesis away from the release magnet
when dropped. Upon impact, the toe marker exhibited a
direct response to the impact by moving horizontally in a
negative direction 2 mm in 0.04 seconds.
The area of interest to ascertain any change in ground
contact boundary conditions created by the ground im-
pact is the horizontal movement of the toe marker. A
magnification of the toe marker horizontal displacement
at the point of ground impact is shown in Figure 8.
Figure 6. FDE & SDE load/deflection behaviour.
Figure 7. Drop test behavior.
Figure 8. Toe marker horizontal impact displacement.
It can be seen in Figure 8 that immedi ately afte r ground
impact occurs, there is a sudden negative horizontal
change in displacement of 2 mm. At the same point in
time, the “ankle” marker did not move in the horizontal
plane. This suggests that the energy return blade bent at
the point of impact rather than due to any rotation of the
prosthesis to achieve it.
The graph in Figure 8 shows that ground impact takes
place at approximately time frame 25. Upon impact, a
slight rotation of the prosthesis and mass occurs upon
Copyright © 2013 SciRes. OPEN ACCESS
B. Dyer et al. / J. Biomedical Science and Engineering 6 (2013) 116-123
Copyright © 2013 SciRes.
121
OPEN ACCESS
release. The vertical displacement of the shin maker
shows no value until ground contact. At which point the
blade compresses and the prosthesis begins to rotate
forwards as well as the energy transferred by the impact
is then returned to the blade resulting in an upward
launch trajectory.
The toe marker also was subjected to a positive verti-
cal displacement of 2 mm 0.01 seconds after the point of
impact. This demonstrates that the ground point of im-
pact was likely slightly behind the location of the toe
marker. The 2 mm measured vertical displacement reac-
tion is the toes “curling” upwards due to the impact fo rce.
The prosthesis unloaded length compressed by approxi-
mately 30 mm upon ground impact.
3.3. Energy Return Technology Run Tests
The results showing the conduct of the trials are shown
in Table 2.
The Coefficient of Variation scores are of a low per-
centage especially considering the subjective nature of
the running speeds by the p articipant.
At the point of contact the blade begins to compress.
As the participant approaches mid stance, it can be seen
that the distal end of the blade moves vertically towards
the sole as the blade compresses.
At the point of ground contact, the blade contacts the
ground roughly midfoot of the blade which then transfers
marginally to the rearfoot due to the blade bending.
However, once mid stance is achieved, the point of con-
tact begins to shift forwards until take-off. This will mean
that the effective spring length of the blade at the begin-
ning of the gait cycle is quite short but then prog ressively
lengthens towards toe-off. This demonstrates a non-lin-
ear response in stiffness from a blade of this nature both
under compression and extension. Ultimately the blades
stiffness will reduce as the ground contact phase contin-
ues and potential energy is converted to kinetic energy
through vertical movement of the athlete. Enlarged and
overlaid images of the ground contact phases are shown
in Figures 9(a) and (b).
Figure 9 demonstrates ground contact point shifting
due to running gait. In both images, point 1 indicates the
initial ground contact point. The arrow in Figure 9(a)
shows the shift from heel strike to mid stance. The arrow
demonstrates the mid stance distal end of the blade up-
ward deflection. Figure 9(b) shows the ground point of
contact shift from heel strike (1) to toe off (2). The arrow
demonstrates the displacement of the boots ankle point
from initial contact to toe off.
4. DISCUSSION
The first research question asked if static load assess-
ment was suitable to measure lower-limb foot prosthesis
used for competitive running. The two different loading
techniques used in this pilot study did not support this.
Primarily there is a difference in performance of the
prosthesis depending on its length or contact point. Non-
linearity was witnessed in the early stages of loading. It
is proposed that this is due to the tapered profile of the
“foot” region of composite material. The magnitude and
proportion of such non-linearity would likely be small
and unique to each design but it should be reflected that
such a characteristic exists. This supports previous claims
that variable stiffness parameters could be important for
running prosthesis in the future [12].
The second research question asked whether a predic-
tion of energy return technology was possible using static
load techniques. With the SDE method, the obtained
bending deflection would be inaccurate due to the con-
stantly shortening spring length of the “toes” arching
through. The 28 mm slipp age of the SD E method cr eated
a 12% perceived loss in prosthetic stiffness. This was
caused by a combination of the change in spring length
and the relative measurement of compressed deflection
of the machine. Such a characteristic does make the pre-
diction of ERP stiffness by extending the linear portion
more inaccurate and therefore unfair to assess or regulate
the technologies response. From a clinical point of view,
not ensuring the ground contact po int and the point stati-
cally loaded are the same could mean that at best, sig-
nificant tuning of an athlete’s prosthesis geometry would
be required and at worst that an incorrect prosthesis would
be fitted. If such a technique was used to prescribe or
evaluate ERP technology in the future, the lower portions
of such graph traces should be disregarded and the lin-
ear-like sec tion of a lo ad as clo se to those exp ected in the
individual’s event should be selected.
The final research question in this pilot study asked
whether LLP’s are subjected to significant boundary
condition changes due to loading. The pilot tests here
would suggest that they are. The drop test produced a
change in boundary conditions due to impact load and a
resultant deflection which would alter the blades stiffness.
A boundary change was produced due to a change in the
Table 2. Condition 1 & 2 summary.
Blade Setting Self-Selected Speed Running Speed
Mean (M/s) Mean Stride
Freq. (Hz) Stride Freq. Coefficient of
Variation (%) Mean Stride Length
Difference (m)
1 Less stiff “Fast” 4.60 2.98 7 0.05
2 More stiff “Fast” 4.68 3.33 5 0.04
B. Dyer et al. / J. Biomedical Science and Engineering 6 (2013) 116-123
122
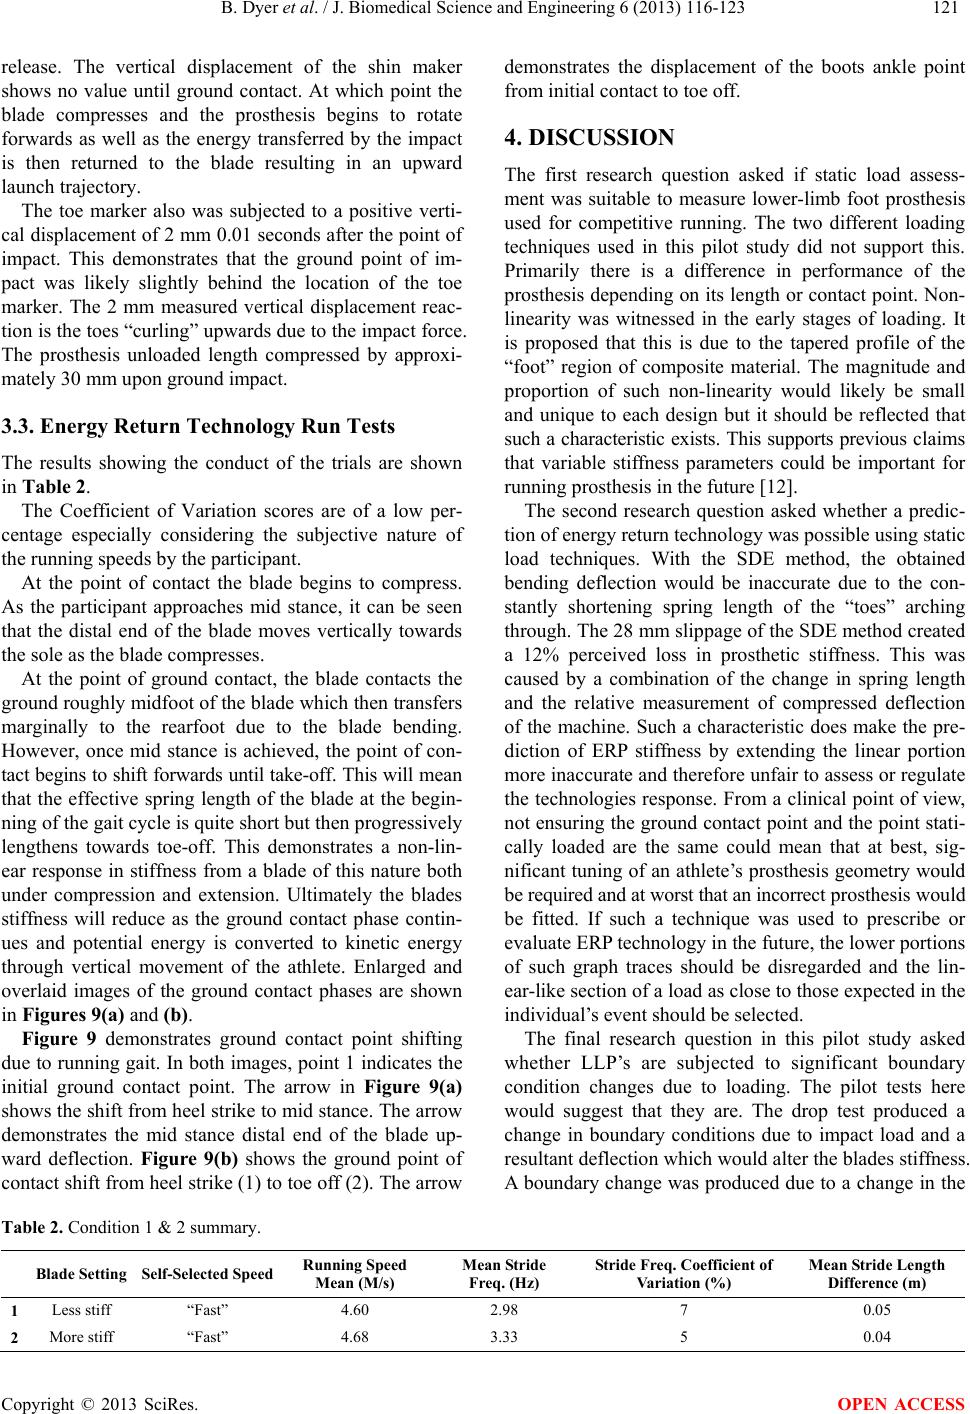
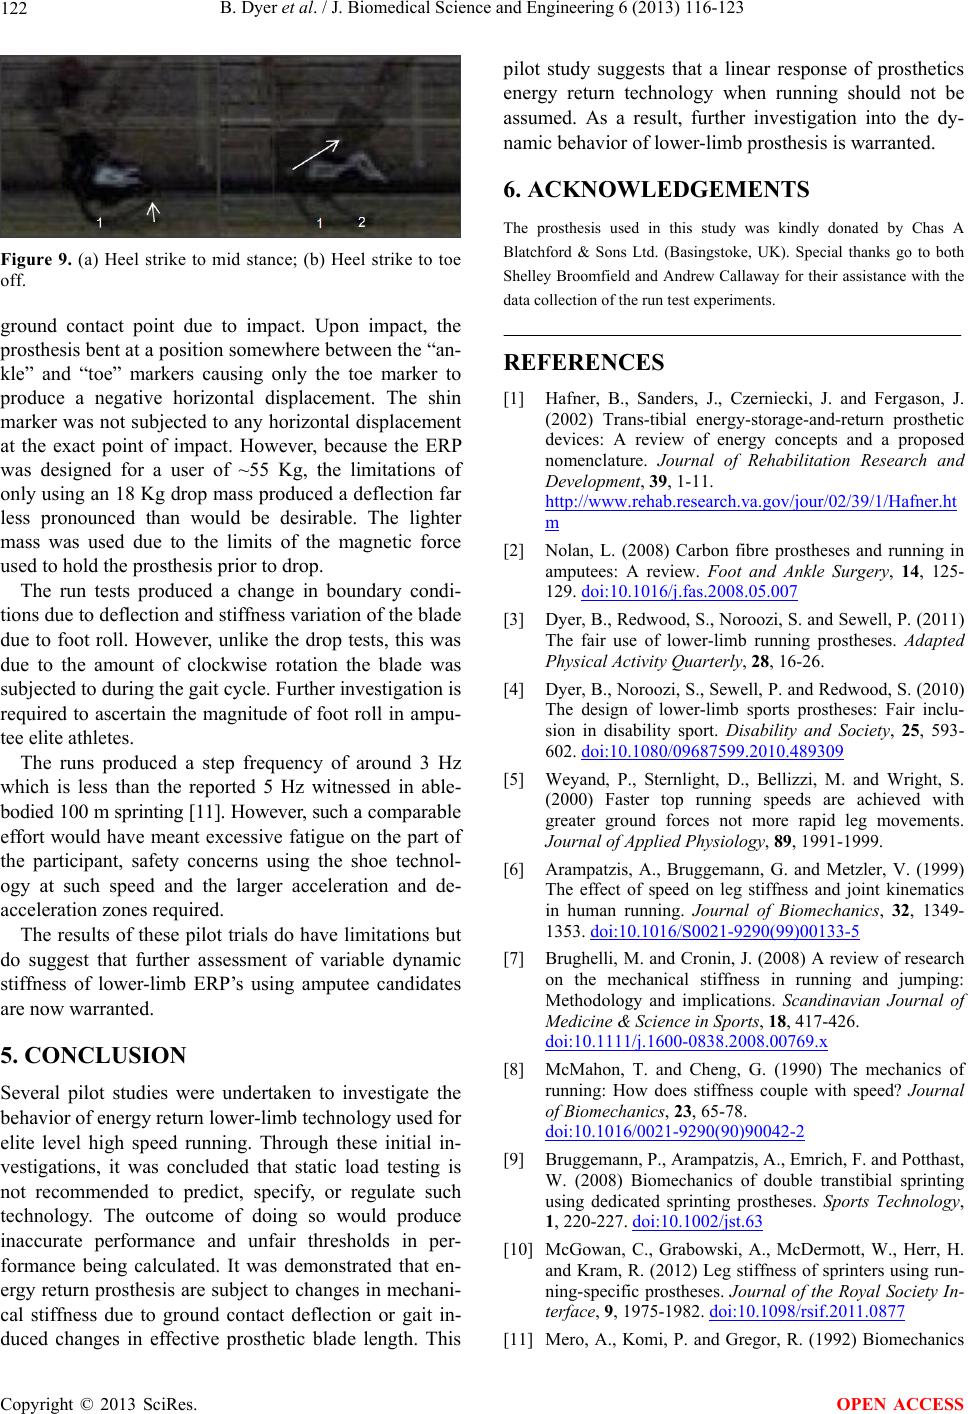
Figure 9. (a) Heel strike to mid stance; (b) Heel strike to toe
off.
ground contact point due to impact. Upon impact, the
prosthesis bent at a position somewhere between the “an-
kle” and “toe” markers causing only the toe marker to
produce a negative horizontal displacement. The shin
marker was not subjected to any horizontal displacement
at the exact point of impact. However, because the ERP
was designed for a user of ~55 Kg, the limitations of
only using an 18 Kg drop mass produced a deflection far
less pronounced than would be desirable. The lighter
mass was used due to the limits of the magnetic force
used to hold the prosthesis pr ior to drop.
The run tests produced a change in boundary condi-
tions due to deflection and stiffness variation of the blade
due to foot roll. However, unlike the drop tests, this was
due to the amount of clockwise rotation the blade was
subjected to during th e gait cycle. Further investigation is
required to ascertain the magnitude of foot roll in ampu-
tee elite athletes.
The runs produced a step frequency of around 3 Hz
which is less than the reported 5 Hz witnessed in able-
bodied 100 m sprinting [11]. However, such a co mpa r ab le
effort would have meant excessive fatigue on the part of
the participant, safety concerns using the shoe technol-
ogy at such speed and the larger acceleration and de-
acceleration zones required.
The results of these p ilot trials do have limitations bu t
do suggest that further assessment of variable dynamic
stiffness of lower-limb ERP’s using amputee candidates
are now warranted.
5. CONCLUSION
Several pilot studies were undertaken to investigate the
behavior of energy return lower-limb technology used for
elite level high speed running. Through these initial in-
vestigations, it was concluded that static load testing is
not recommended to predict, specify, or regulate such
technology. The outcome of doing so would produce
inaccurate performance and unfair thresholds in per-
formance being calculated. It was demonstrated that en-
ergy return prosthesis are subject to changes in mechani-
cal stiffness due to ground contact deflection or gait in-
duced changes in effective prosthetic blade length. This
pilot study suggests that a linear response of prosthetics
energy return technology when running should not be
assumed. As a result, further investigation into the dy-
namic behavior of lower-limb prosthesis is warranted.
6. ACKNOWLEDGEMENTS
The prosthesis used in this study was kindly donated by Chas A
Blatchford & Sons Ltd. (Basingstoke, UK). Special thanks go to both
Shelley Broomfield and Andrew Callaway for their assistance with the
data collection of the run t est experiments.
REFERENCES
[1] Hafner, B., Sanders, J., Czerniecki, J. and Fergason, J.
(2002) Trans-tibial energy-storage-and-return prosthetic
devices: A review of energy concepts and a proposed
nomenclature. Journal of Rehabilitation Research and
Development, 39, 1-11.
http://www.rehab.research.va.gov/jour/02/39/1/Hafner.ht
m
[2] Nolan, L. (2008) Carbon fibre prostheses and running in
amputees: A review. Foot and Ankle Surgery, 14, 125-
129. doi:10.1016/j.fas.2008.05.007
[3] Dyer, B., Redwood, S., Noroozi, S. and Sewell, P. (2011)
The fair use of lower-limb running prostheses. Adapted
Physical Activity Quarterly, 28, 16-26.
[4] Dyer, B., Noroozi, S., Sewell, P. and Redwood, S. (2010)
The design of lower-limb sports prostheses: Fair inclu-
sion in disability sport. Disability and Society, 25, 593-
602. doi:10.1080/09687599.2010.489309
[5] Weyand, P., Sternlight, D., Bellizzi, M. and Wright, S.
(2000) Faster top running speeds are achieved with
greater ground forces not more rapid leg movements.
Journal of Applied Physiology, 89, 1991-1999.
[6] Arampatzis, A., Bruggemann, G. and Metzler, V. (1999)
The effect of speed on leg stiffness and joint kinematics
in human running. Journal of Biomechanics, 32, 1349-
1353. doi:10.1016/S0021-9290(99)00133-5
[7] Brughelli, M. and Cronin, J. (2008) A review of research
on the mechanical stiffness in running and jumping:
Methodology and implications. Scandinavian Journal of
Medicine & Science in Sports, 18, 417-426.
doi:10.1111/j.1600-0838.2008.00769.x
[8] McMahon, T. and Cheng, G. (1990) The mechanics of
running: How does stiffness couple with speed? Journal
of Biomechanics, 23, 65-78.
doi:10.1016/0021-9290(90)90042-2
[9] Bruggemann, P., Arampatzis, A., Emrich, F. and Potthast,
W. (2008) Biomechanics of double transtibial sprinting
using dedicated sprinting prostheses. Sports Technology,
1, 220-227. doi:10.1002/jst.63
[10] McGowan, C., Grabowski, A., McDermott, W., Herr, H.
and Kram, R. (2012) Leg stiffness of sprinters using run-
ning-specific prostheses. Journal of the Royal Society In-
terface, 9, 1975-1982. doi:10.1098/rsif.2011.0877
[11] Mero, A., Komi, P. and Gregor, R. (1992) Biomechanics
Copyright © 2013 SciRes. OPEN ACCESS
B. Dyer et al. / J. Biomedical Science and Engineering 6 (2013) 116-123 123
of sprint running. Sports Medicine, 13, 376-392.
doi:10.2165/00007256-199213060-00002
[12] Farley, C. and Gonzalez, O. (1996) Leg stiffness and s t ri d e
frequency in human running. Journal of Biomechanics,
29, 181-186. doi:10.1016/0021-9290(95)00029-1
Copyright © 2013 SciRes. OPEN ACCESS