Paper Menu >>
Journal Menu >>
 Low Carbon Economy, 2010, 1, 8-17 doi:10.4236/lce.2010.11002 Published Online September 2010 (http://www.SciRP.org/journal/lce) Copyright © 2010 SciRes. LCE 7 Behavioral and Technological Changes Regarding Lighting Consumptions: A MARKAL Case Study Emmanuel Fragnière1,2 , Roman Kanala3, Denis Lavigne4, Francesco Moresino2, Gustave Nguene2 1University of Bath School of Management, Bath, UK; 2Haute Ecole de Gestion (HEG), Carouge, Switzerland; 3University of Ge- neva, Institute of Environmental Sciences, Carouge, Switzerland; 4Collège Militaire Royal de Saint-Jean, Succursale Forces, King- ston, Ontario, Canada. Email: gustave.nguene@a3.epfl.ch Received August 15th, 2010; revised September 10th, 2010; accepted September 15th, 2010. ABSTRACT The present study aims at assessing the joint impact of awareness campaigns and technology choice, on end-use energy consumption behaviour. Actions to achieve energy savings through the use of more energy efficient end-use technology are included. A new MARKAL framework, the Socio-MARKAL, was recently proposed by the authors. As opposed to the traditional MARKAL framework based on technical and economic considerations, the Socio-MARKAL concept inte- grates technological, economic and behavioural contributions to the environment. This study takes into consideration, technological improvements on the demand side by consumers as well as behavioural changes minimizing carbon di- oxide emissions and encouraging rational use of energy. The study presented in this paper, “Lighting Consumptions Habits in Geneva Households”, was conducted from September to December 2009. Based on the statistical analysis of this survey, we have determined coefficients to feed the database of the Socio-MARKAL model (an IEA/ANSWER data- base is available for testing purposes). Keywords: Demand Side Management, Energy and Environmental Planning, MARKAL, Sociological Surveys, Sustainable Development 1. Introduction The original MARKAL model is a multi-period linear programming formulation of a reference energy system (RES). The constraints of the model describe all energy flows, production of electricity and centralized heat, in- dustrial processes, consumption by end-use technologies and lastly energy services. The objective function in the linear programming model is the discounted sum, over the time horizon considered (usually between 30 and 45 years), of investment, operating and maintenance costs of all technologies, plus the cost of energy imports. The model also accounts for emissions of atmospheric pol- lutants (NOx, SO2 and CO2) and is currently used in many countries and regions around the world for the assess- ment of energy pollution abatement policies. As the ex- isting literature shows [1-4], the MARKAL family of models and similar energy optimization models to a cer- tain extent are appropriate to answer questions such as: how do technologies and policies affect the environ- mental impacts of energy use (i.e., GHG and emissions of other pollutants)? How do actions on the demand-side affect the supply-side and vice versa? How to model the dynamics of technology (e.g., the switch from one tech- nology to another)? However, among the existing MARKAL models, the social/sociological aspect of energy use on the de- mand-side is not taken into account. In particular, none of the above mentioned models takes into account the contribution of end use consumers’ behavioural change as a reliable resource for energy efficiency, energy sav- ings, and emissions reductions. Saving energy requires a change in the behavior of consumers, either to improve the energy efficiency of their technology (e.g., technol- ogy switch), or to improve the way they use energy with non-efficient technologies (e.g., better use of a less effi- cient technology). As such, information can be an im- portant driver, as it can positively influence people’s be- havior towards energy and the environment [5]. Do we know enough about factors that can affect the behavior of energy consumers? Is it reasonable to integrate behav- ioral and techno-economic parameters? How behavioral parameters and data can be obtained? 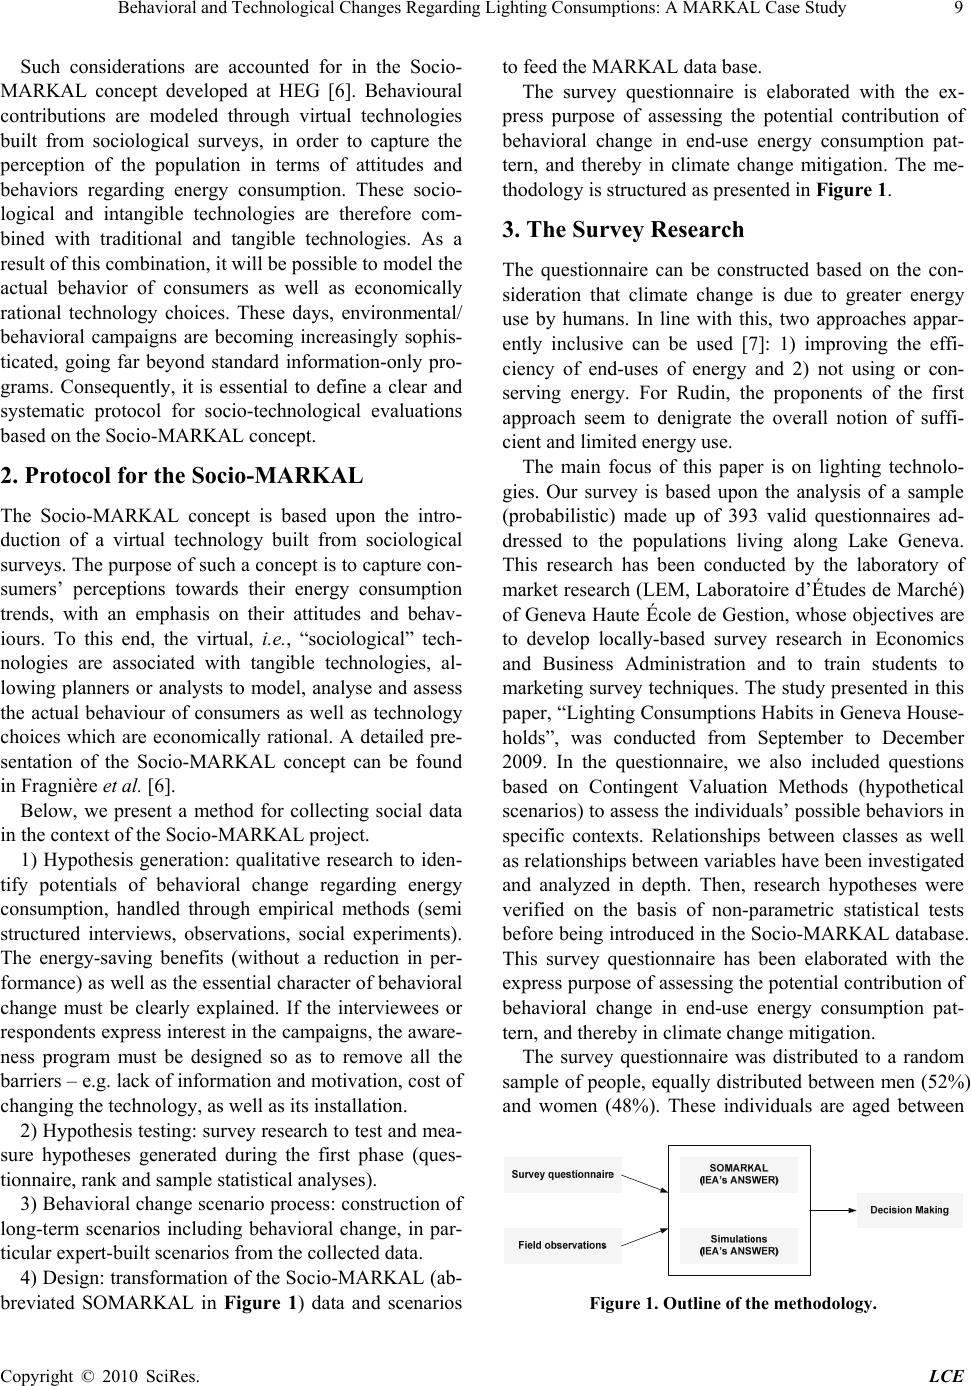 Behavioral and Technological Changes Regarding Lighting Consumptions: A MARKAL Case Study9 Such considerations are accounted for in the Socio- MARKAL concept developed at HEG [6]. Behavioural contributions are modeled through virtual technologies built from sociological surveys, in order to capture the perception of the population in terms of attitudes and behaviors regarding energy consumption. These socio- logical and intangible technologies are therefore com- bined with traditional and tangible technologies. As a result of this combination, it will be possible to model the actual behavior of consumers as well as economically rational technology choices. These days, environmental/ behavioral campaigns are becoming increasingly sophis- ticated, going far beyond standard information-only pro- grams. Consequently, it is essential to define a clear and systematic protocol for socio-technological evaluations based on the Socio-MARKAL concept. 2. Protocol for the Socio-MARKAL The Socio-MARKAL concept is based upon the intro- duction of a virtual technology built from sociological surveys. The purpose of such a concept is to capture con- sumers’ perceptions towards their energy consumption trends, with an emphasis on their attitudes and behav- iours. To this end, the virtual, i.e., “sociological” tech- nologies are associated with tangible technologies, al- lowing planners or analysts to model, analyse and assess the actual behaviour of consumers as well as technology choices which are economically rational. A detailed pre- sentation of the Socio-MARKAL concept can be found in Fragnière et al. [6]. Below, we present a method for collecting social data in the context of the Socio-MARKAL project. 1) Hypothesis generation: qualitative research to iden- tify potentials of behavioral change regarding energy consumption, handled through empirical methods (semi structured interviews, observations, social experiments). The energy-saving benefits (without a reduction in per- formance) as well as the essential character of behavioral change must be clearly explained. If the interviewees or respondents express interest in the campaigns, the aware- ness program must be designed so as to remove all the barriers – e.g. lack of information and motivation, cost of changing the technology, as well as its installation. 2) Hypothesis testing: survey research to test and mea- sure hypotheses generated during the first phase (ques- tionnaire, rank and sample statistical analyses). 3) Behavioral change scenario process: construction of long-term scenarios including behavioral change, in par- ticular expert-built scenarios from the collected data. 4) Design: transformation of the Socio-MARKAL (ab- breviated SOMARKAL in Figure 1) data and scenarios to feed the MARKAL data base. The survey questionnaire is elaborated with the ex- press purpose of assessing the potential contribution of behavioral change in end-use energy consumption pat- tern, and thereby in climate change mitigation. The me- thodology is structured as presented in Figure 1. 3. The Survey Research The questionnaire can be constructed based on the con- sideration that climate change is due to greater energy use by humans. In line with this, two approaches appar- ently inclusive can be used [7]: 1) improving the effi- ciency of end-uses of energy and 2) not using or con- serving energy. For Rudin, the proponents of the first approach seem to denigrate the overall notion of suffi- cient and limited energy use. The main focus of this paper is on lighting technolo- gies. Our survey is based upon the analysis of a sample (probabilistic) made up of 393 valid questionnaires ad- dressed to the populations living along Lake Geneva. This research has been conducted by the laboratory of market research (LEM, Laboratoire d’Études de Marché) of Geneva Haute École de Gestion, whose objectives are to develop locally-based survey research in Economics and Business Administration and to train students to marketing survey techniques. The study presented in this paper, “Lighting Consumptions Habits in Geneva House- holds”, was conducted from September to December 2009. In the questionnaire, we also included questions based on Contingent Valuation Methods (hypothetical scenarios) to assess the individuals’ possible behaviors in specific contexts. Relationships between classes as well as relationships between variables have been investigated and analyzed in depth. Then, research hypotheses were verified on the basis of non-parametric statistical tests before being introduced in the Socio-MARKAL database. This survey questionnaire has been elaborated with the express purpose of assessing the potential contribution of behavioral change in end-use energy consumption pat- tern, and thereby in climate change mitigation. The survey questionnaire was distributed to a random sample of people, equally distributed between men (52%) and women (48%). These individuals are aged between Figure 1. Outline of the methodology. Copyright © 2010 SciRes. LCE 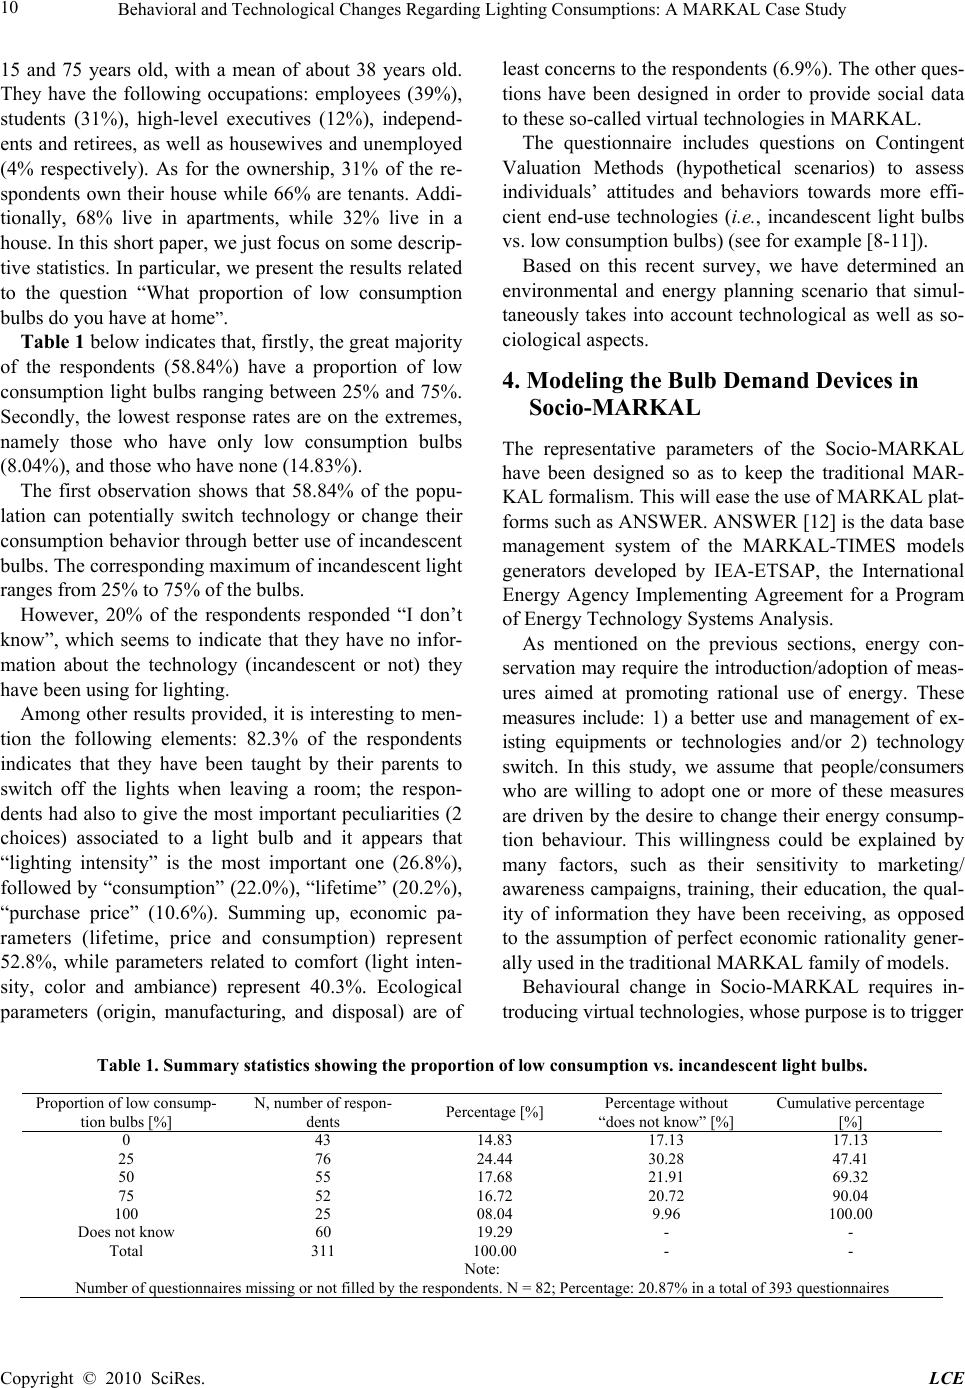 Behavioral and Technological Changes Regarding Lighting Consumptions: A MARKAL Case Study Copyright © 2010 SciRes. LCE 10 15 and 75 years old, with a mean of about 38 years old. They have the following occupations: employees (39%), students (31%), high-level executives (12%), independ- ents and retirees, as well as housewives and unemployed (4% respectively). As for the ownership, 31% of the re- spondents own their house while 66% are tenants. Addi- tionally, 68% live in apartments, while 32% live in a house. In this short paper, we just focus on some descrip- tive statistics. In particular, we present the results related to the question “What proportion of low consumption bulbs do you have at home”. Table 1 below indicates that, firstly, the great majority of the respondents (58.84%) have a proportion of low consumption light bulbs ranging between 25% and 75%. Secondly, the lowest response rates are on the extremes, namely those who have only low consumption bulbs (8.04%), and those who have none (14.83%). The first observation shows that 58.84% of the popu- lation can potentially switch technology or change their consumption behavior through better use of incandescent bulbs. The corresponding maximum of incandescent light ranges from 25% to 75% of the bulbs. However, 20% of the respondents responded “I don’t know”, which seems to indicate that they have no infor- mation about the technology (incandescent or not) they have been using for lighting. Among other results provided, it is interesting to men- tion the following elements: 82.3% of the respondents indicates that they have been taught by their parents to switch off the lights when leaving a room; the respon- dents had also to give the most important peculiarities (2 choices) associated to a light bulb and it appears that “lighting intensity” is the most important one (26.8%), followed by “consumption” (22.0%), “lifetime” (20.2%), “purchase price” (10.6%). Summing up, economic pa- rameters (lifetime, price and consumption) represent 52.8%, while parameters related to comfort (light inten- sity, color and ambiance) represent 40.3%. Ecological parameters (origin, manufacturing, and disposal) are of least concerns to the respondents (6.9%). The other ques- tions have been designed in order to provide social data to these so-called virtual technologies in MARKAL. The questionnaire includes questions on Contingent Valuation Methods (hypothetical scenarios) to assess individuals’ attitudes and behaviors towards more effi- cient end-use technologies (i.e., incandescent light bulbs vs. low consumption bulbs) (see for example [8-11]). Based on this recent survey, we have determined an environmental and energy planning scenario that simul- taneously takes into account technological as well as so- ciological aspects. 4. Modeling the Bulb Demand Devices in Socio-MARKAL The representative parameters of the Socio-MARKAL have been designed so as to keep the traditional MAR- KAL formalism. This will ease the use of MARKAL plat- forms such as ANSWER. ANSWER [12] is the data base management system of the MARKAL-TIMES models generators developed by IEA-ETSAP, the International Energy Agency Implementing Agreement for a Program of Energy Technology Systems Analysis. As mentioned on the previous sections, energy con- servation may require the introduction/adoption of meas- ures aimed at promoting rational use of energy. These measures include: 1) a better use and management of ex- isting equipments or technologies and/or 2) technology switch. In this study, we assume that people/consumers who are willing to adopt one or more of these measures are driven by the desire to change their energy consump- tion behaviour. This willingness could be explained by many factors, such as their sensitivity to marketing/ awareness campaigns, training, their education, the qual- ity of information they have been receiving, as opposed to the assumption of perfect economic rationality gener- ally used in the traditional MARKAL family of models. Behavioural change in Socio-MARKAL requires in- troducing virtual technologies, whose purpose is to trigger Table 1. Summary statistics showing the proportion of low consumption vs. incandescent light bulbs. Proportion of low consump- tion bulbs [%] N, number of respon- dents Percentage [%] Percentage without “does not know” [%] Cumulative percentage [%] 0 43 14.83 17.13 17.13 25 76 24.44 30.28 47.41 50 55 17.68 21.91 69.32 75 52 16.72 20.72 90.04 100 25 08.04 9.96 100.00 Does not know 60 19.29 - - Total 311 100.00 - - Note: Number of questionnaires missing or not filled by the respondents. N = 82; Percentage: 20.87% in a total of 393 questionnaires  Behavioral and Technological Changes Regarding Lighting Consumptions: A MARKAL Case Study Copyright © 2010 SciRes. LCE 11 the survey research are transformed to feed the bulb de- mand devices section of the Socio-MARKAL model. In this short paper, we will concentrate on a single case. Note that due to the qualitative nature of the data, we will be using a narrative scheme to make the case. behavioural change among energy consumers. For the bulb demand devices section of the Socio-MARKAL model, we ended up with the following representation, using structures defined by MARKAL, as outlined in Figure 2. We have two sets of data for the residual capacities for incandescent bulbs RLD1 and low consumption bulbs RLD4. One data set comes from MARKAL data points that are obtained from statistics of observed actual con- texts. The second data set about the number of bulbs and their split comes from the survey and it is not exact be- cause it corresponds to elements of perceptions. The qualitative scale is defined over: zero, 1/4, 1/2, 3/4, all bulbs, and “do not know”. We’ve got four demand devices. Parameters RLD1 and RLD4 represent the real and tangible lighting technolo- gies, receiving electric power as input, and generating residential lighting. Parameters RLD2 and RLD3 represent the virtual tech- nologies. As opposed to the real technologies, virtual technolo- gies receive inputs that are intangible, leading to energy savings or technology switch. These devices are presented below: Residual capacity of behaviour change in favour of electricity savings RLD2 and for technology switch RLD3 is zero at the beginning of the optimisation. Then, we have the evolution of the environment that corre- sponds to Socio-MARKAL scenarios. For instance, there are people who will never change their behaviour and will only use incandescent bulbs RLD1 as long as they can buy them. Then, another case concerns people who are not aware of the advantages of low consumption bulbs and consequently might change their behaviour spontaneously as they get or receive more information. - RLD1, “existing incandescent bulbs” - RLD4, “existing low consumption bulbs - RLD2, “moderate use of incandescent bulbs”, and - RLD3, “switch to low consumption bulbs” - MRKRP2 and MRKRP3 are marketing/awareness campaigns which have the effect of changing the be- haviour of energy consumers. MRKRP2 and MRKRP3 are respectively supposed to trigger the “Moderate use of incandescent light bulbs”, and the behaviour towards low consumption bulbs, i.e. “Technology Switch towards low consumption bulbs”. Finally, there are people who would not change their behaviour without an information campaign; however with an exposure to information, they will start saving energy and/or switch technology. In order to measure this part of behavioural change, we have asked the following questions in the survey: 5. Transforming Sociological Data into MARKAL Parameters: An Example In this section, we show how the statistics obtained from Figure 2. Structure of the reference energy system (RES).  Behavioral and Technological Changes Regarding Lighting Consumptions: A MARKAL Case Study 12 - Question 10: “Did you know that low consumption bulbs may consume up to 5 times less energy than the incandescent ones?” (possible answers: Yes, No). - Question 11: “Did you know that low consumption bulbs have a lifetime up to 10 times superior to the incandescent bulbs?” (possible answers: Yes, No). - Question 12: “If you were better informed about the economic advantages of the low consumption bulbs, would you be ready to abandon completely the incandescent bulbs?” (possible answers: Yes, No). Thanks to these questions, we can identify the part of consumers who were not informed about the energy consumption and lifetime of the technology. But once they got this complement of information, they claim to be ready to undertake technology switch. People who know about the advantages of low consumption bulbs and despite that, are not willing to change, influence the decrease of RLD1 to a steady incompressible level. For people who did not know about the advantages of low consumption bulbs and are then informed, there will be some of them switching to low consumption bulbs. We have then added one more question formulated as hypo- thetical scenarios: - Question 13: “Did you know that if a household changes half of of incandescent bulbs for low con- sumption ones, about 200 CHF per year can be saved?” (possible answers Yes, No). - Question 14: “Based on this information, would you change at least half of your bulbs?” (possible answers: Yes, No, I did it already). This question enables us to identify the part of people who are well informed but will not change, those who were not informed but did the change and finally those who would do the technology switch thanks to the in- formation. In order to assess the drivers of energy savings, we have asked about the reasons why people turn the lights on when they enter into a room. If this is due to their poor eyesight or irrational fear of obscurity, they will probably not change their behaviour. However people who say it is just a habit, or if they do so for comfort, aesthetics, or do not know, they could possibly make the effort to change their behaviour. Likewise, people who say they leave light on when watching TV, could switch it off. But those who do have already done this or who leave only a small spot to reduce contrast and eyestrain, cannot make further savings. This is typically the kind of hypotheses we need to set up in order to get a proxy of the parameters that will be entered into the model. For instance, in Table 1, related to Question 7 “What proportion of low consumption bulbs do you have at home”, we had roughly 20% who wouldn’t know about the number of low consumption bulbs they originally had. Based on cross table analyses involving different ques- tions of the questionnaire, and referring to the above hy- potheses, we propose a new presentation for the propor- tion of low consumption bulbs in Table 2 above. This table is now usable to determine the RESID of RLD 1. 6. Preparing the Data for Socio-MARKAL This section aims at determining the parameters for all the demand technologies (i.e., RLD1, RLD2, RLD3, RLD4) presented in Figure 2. More descriptive details about these technologies can be found in the appendix, in Table 5. We start with RLD3, which corresponds to “Switch to low consumption bulbs”. 6.1. The Case of RLD3 Our evaluation is based on the cross-analysis of ques- tions 13 and 14. The respondents (3.9% of the sample and 15.3% of people who answered “Yes” to question 13) were already informed about the economic advantage of choosing low consumption bulbs and are not willing to change. These respondents represent an incompressible ratio that enters into the efficiency coefficient of the MARKAL model. To this figure, it is necessary to add 14.4% of the sample (i.e., 19.2% of people who an- swered “No” to question 14). These latter persons did not have the information before and were informed during the survey. Still, they indicate that they won’t change their behavior. On the other hand, 9% of the sample and 35.7% of the people answering “Yes” to question 13 were already in- formed about the economic advantages of switching to low consumption bulbs. Moreover, they indicate that they are willing to make a technology switch soon, but did not do it yet. We believe that for these respondents, this new exposition to information represents a reminder. Likewise, 44.2% of the sample (i.e., 59.1% of all people for whom the information is new) claim that they are willing to undertake the technology switch in order to replace half of their incandescent light bulbs by low- consumption bulbs. Finally, people who have announced that they already made the change before the survey, are deducted from Table 2. Descriptive statistics showing the proportion of low consumption light bulbs. Proportion of low consumption bulbs [%] N, number of respondents Percentage [%] 0 53 17.04 25 96 30.87 50 65 20.90 75 72 23.15 100 25 08.04 Total 311 100.00 Copyright © 2010 SciRes. LCE  Behavioral and Technological Changes Regarding Lighting Consumptions: A MARKAL Case Study Copyright © 2010 SciRes. LCE 13 the final ratio that is inputted in MARKAL (53.2% of the people who answered “Yes” to question 14). 6.2. The Case of RLD2 Here we explore and analyze the answers in question 15, “Your electricity consumption would likely change for the following reasons” (respondents can make up to 2 choices among six options). The results (normalised) are presented on the table below. In order to determine the parameters for RLD2, we have considered three different aspects. Firstly, we have decided to evaluate the direct impact of an advertising campaign (i.e., “An information campaign on the media or advertising”) as our main explanatory parameter for RLD2. Secondly, the indirect effect can be represented by both “The opinion of a relative” and “A request from our children”. Thirdly, economic criteria include the in- come modification (i.e., “A change in your income”), and “Electricity price increases”. The former and the latter are excluded because these parameters (effects) are in fact characterized by their economic rationality, which is compatible with the standard MARKAL formulation. Our evaluation shows that 37.5% of all respondents (24.7% of the normalized total, as shown in Table 3 above) declare that an awareness campaign can influence their electricity consumption. Based on this information, we can set the efficiency of the awareness campaign to 24.7%. Setting the efficiency as composed of both the direct and indirect effects, we get 27.5+37.5+11.1 = 76% of all replies (i.e . , 50.2% of the normalized total). How- ever this figure represents the declared likeliness of the respondents influenced directly by an information cam- paign or indirectly through a third-party person (i.e., relatives and parents). 6.3. Determining Investment Costs for MRKP2 and MRKP3 The following table corresponds to the results provided for question 16, “What kind of information means would likely change your behaviour”. These results, presented in Table 4 below, are associated with percentages that have been normalised. In this table, we have included a new column titled “Cost per individual”. These estimates represent calculations based on the results of question 16 and hypotheses related to marketing costs (obtained through a discussion with a marketing expert operating in the Geneva region). In the case of articles from newspa- pers, we consider the cost to be zero because it is an in- dependent editorial initiative. 6.4. Inputting the DM Tables of MARKAL We have implemented a MARKAL model using AN- SWER, the IEA platform. Consequently this kind of simulation will be directly available to ANSWER users and we hope that it will enable them to develop their own Socio MARKAL scenarios (the IEA/ANSWER mdb file of the case study presented in this paper is available by contacting the authors). The following snapshot, exhibited in Figure 3 below, presents an example of this kind of Socio-MARKAL Table 3. Distribution of responses to question 15, “Your electricity consumption would likely change for the following rea- sons” (respondents can choose among up to 2 options). Proportion of respondents (N = 311) Option 1. The opinion of a relative, a friend or a neighboor 18.20 Option 2. A request from your children 7.27 Option 3. An information campaign on the media or advertising 24.74 Option 4. A change in your income 12.53 Option 5. Significant electricity price increase 30.71 Option 6. Nothing would change my behaviour 6.62 Total 100.00 Aggregates Information (options 1 to 3): 50.13% Economic conditions (options 4 & 5): 43.25% Table 4. Distribution of responses to question 16, “What kind of information would likely help changing your behavior”. Means Percentage [%] Cost [CHF] per individual A Web page filled with useful information 10.50 5.00 A Web page with an energy savings calculator 17.60 5.83 Articles from newspapers/TV reports 19.40 0.00 Leaflets from utilities or green organisations 14.50 0.03 Doorstep awareness campaigning 2.40 20.00 Selling points with information (e.g. posters) 12.30 20.00 Advertisement on TV and radio 14.20 1.00 Advertisement campaigns on public transports 9.10 0.25 Total 100  Behavioral and Technological Changes Regarding Lighting Consumptions: A MARKAL Case Study 14 Figure 3. Example of Socio-MARKAL scenarisation developed in IEA’s ANSWER. scenarisation in IEA’s ANSWER. We are aware that this kind of scenarisation is associated with uncertainties and that this kind of development is still in its infancy. How- ever, it offers to policy makers a tool to test environmen- tal policies that involve social change. Recently, new regulations imposing low consumption bulbs have been enforced in the EU as well as in Switzer- land. Consequently, this kind of scenario can be useful to understand alternate evolutions if this kind of regulations were not in place. We have seen that it is particularly difficult to devise hypotheses regarding investment costs. We would like al- so to remind that it is possible to produce shadow prices from MARKAL, because it is based on convex optimiza- tion. So, it is always possible to determine what should be “the rational” cost of awareness campaigns. Copyright © 2010 SciRes. LCE  Behavioral and Technological Changes Regarding Lighting Consumptions: A MARKAL Case Study15 7. Illustration In this section, we will assess the Socio-MARKAL mo- del with an illustration based on three scenarios. In this illustration, we consider an evaluation over a span of 20 years (i.e., from 2005 to 2025) spread over 4 periods of 5 years. 7.1. Assumptions A number of assumptions have been introduced, specifi- cally regarding both the demand investments for residen- tial lighting technologies. The overall demand for light bulbs is expected to grow by about 50% over the evaluation period, i.e., from 1442 hundreds units (144'200 bulbs) in 2005 to 2500 hundreds units (250'000 bulbs) in 2025. Residual capacity is split between RLD1 and RLD4, respectively for 80% and 20%. Investment costs for RLD1 are expected to rise by 40% over the evaluation period, i.e., from 1 CHF/bulb in 2005 to 1.40 CHF/bulb in 2025. However, for low consump- tion bulbs (RLD4) whose costs are set to 10 CHF/bulb in 2005, we assume decreasing costs over the time periods of respectively, 7 CHF/bulb in 2010, 6 CHF/bulb in 2015, 5 CHF/bulb in 2020, and 4 CHF/bulb in 2025. The lifetime of new light bulbs is set to 1 year for in- candescent bulbs (RLD1) and 2 years for low consump- tion bulbs (RLD4). The energy carrier input, (i.e. MA (ENT) in AN- SWER), remains constant over the evaluation period. For RLD1 and RLD4, it is set to 0.0328 TJ/unit and 0.0065 TJ/unit respectively. 7.2. Scenarios and Results We consider three scenarios. Scenario 1: the first scenario (see Figure 4) is charac- terized by investment costs in marketing technologies which are so high that virtual technologies do not appear in the optimal solution. Here, we have a case of classical MARKAL competition between incandescent bulbs (RLD1) and low consumption bulbs (RLD4). Both tech- nologies have bounds. In the case of incandescent bulbs, there is a constraint related to the proportion of people who claim they are not willing to undertake the technol- ogy switch, i.e., from incandescent to low consumption bulbs. On the other hand, for low consumption bulbs, we have put a lower bound equal to the installed capacity on the first period, assuming that in the following periods, their penetration should never go below that value. Scenario 2: the second scenario presented in Figure 5, is an example of a case when the cost of information cam- paigns in favour of technology switch is getting lower so 0 500 1000 1500 2000 2500 2005 2010 2015 2020 2025 RLD4 RLD3 RLD2 RLD1 Figure 4. Outline of scenario 1, “Marketing technologies too costly”. 0 500 1000 1500 2000 2500 2005 2010 2015 20202025 RLD4 RLD3 RLD2 RLD1 Figure 5. Scenario 2, “Marketing for technology switch becomes competitive”. that the campaigns are worth to be financed. In this case, and for two periods, the number of incandescent bulbs decreases, replaced by low consumption bulbs, which appear as the result of the campaign in favour of low con- sumption bulbs. Scenario 3: the third scenario (Figure 6) shows that if the cost of marketing technologies is low, then the en- ergy savings and technology switch may dominate the spontaneous purchase of real bulbs. 8. Conclusions This study implements the Socio-MARKAL framework that would take into account consumers’ technological 0 500 1000 1500 2000 2500 2005 2010 2015 2020 2025 RLD4 RLD3 RLD2 RLD1 Figure 6. Scenario 3, “Both marketing technologies appear- ing in the optimal solution”. Copyright © 2010 SciRes. LCE  Behavioral and Technological Changes Regarding Lighting Consumptions: A MARKAL Case Study Copyright © 2010 SciRes. LCE 16 improvements and behavioral changes minimizing car- bon dioxide emissions and encouraging rational use of energy. In this paper, we firstly present and discuss the results of a survey research related to attitudes and be- haviors towards lighting consumption. We show how to transform the sociological data into parameters for the MARKAL model. Secondly, we prove with this paper that, sociological data can be integrated in a model of technological choices such as MARKAL. The IEA’s platform, ANSWER, has been used for that. Thirdly, our study shows that it is possible to develop environ- mental and energy planning scenarios that simultane- ously take into account technological as well as socio- logical aspects. This study also shows that we have been able to move from an idea (i.e., integration of behavioral aspects of energy consumption into a model of techno- logical choices) to the concept proven (i.e., the Socio- MARKAL). We are currently working to extend the concept to the transportation sector. A new sociological survey about attitudes and behaviors regarding passengers is currently conducted in order to feed the Socio-MARKAL model with additional relevant data. The conclusions drawn from one of our previous stud- ies [10] show that the sociological/behavioural approach, i.e., data collection through surveys and sociological ex- periments are powerful tools that can help people under- stand their (personal) energy use and for motivating their actions to reduce carbon emissions. This means that awareness campaigns can stimulate behaviour change to conserve energy. Consequently, both technological and behavioural contributions can be integrated into a single strategy. In turn, this is enough to justify an extension of the current MARKAL family of models, with the inte- gration of data collected through surveys and/or aware- ness campaigns. 9. Acknowledgements We would like to thank Dr. Christian Decurnex, Director of the Municipal Utility of Nyon (Switzerland), for his strong commitment to the application of the Socio- MARKAL model in a real context. Finally, we would like to express our gratitude to Professor Jean Tuberosa, Director of the Market Studies Laboratory at the Geneva School of Business Administration. REFERENCES [1] L. D. Hamilton, G. A. Goldstein, J. Lee, A. S. Manne, W. Marcuse and S. C. Morris, “MARKAL-MACRO: An Over- view,” BNL-48377, Brookhaven National Laboratory, Up- ton, 1992. [2] E. Fragniere and A. Haurie, “A Stochastic Programming Model for Energy/Environment Choices under Uncer- tainty,” International Journal of Environment and Pollu- tion, Vol. 6, No. 4-6, 1996, pp. 587-603. [3] E. Fragnière, A. Haurie and R. Kanala, “A GIS-Based Re- gional Energy-Environment Policy Mode,” International Journal of Global Energy, Vol. 12, No. 1-6, 1999, pp. 159- 167. [4] H. Turton and L. Barreto, “Long-Term Security of Energy Supply and Climate Change,” Energy Policy, Vol. 34, No. 15, 2006, pp. 2232-2250. [5] H. Hondo and K. Baba, “Socio-Psychological Impacts of the Introduction of Energy Technologies: Change in En- vironmental Behaviour of Households with Photovoltaic Systems,” Applied Energy, Vol. 87, No. 1, 2010, pp. 229- 235. [6] E. Fragniere, R. Kanala, D. Lavigne, F. Moresino, A. De Sousa, C. Cubizolle, C. Decurnex and G. Nguene, “Socio- Markal (Somarkal): First Modeling Attempts in the Nyon Residential and Commercial Sectors Taking into Account Behavioral Uncertainties,” 2009. http://ssrn.com/abstract= 1522143 [7] A. Rudin, “Why We Should Change Our Message and Goa l from “Use Energy Efficiently” to “Use Less En- ergy,” Proceedings of the ACEEE 2000 Summer Study on Energy Efficiency in Buildings, Washington D.C., 2000, pp. 392-340. [8] R. Hoevenagel, “An Assessment of the Contingent Valua- tion Methods,” In: R. Pethig, Ed., Valuing the Environ- ment: Methodological and Measurement Issues, Kluwer Academic Publishers, Dordrecht, 1994, pp. 195-227. [9] G. Catenazzo and E. Fragniere, “La gestion des services,” Economica, Paris, 2008. [10] S. Weber, A. Baranzini and E. Fragnière, “Consumers’ Choices among Alternative Electricity Programs in Ge- neva,” International Journal of Global Energy, Vol. 31, No. 3-4, 2009, pp. 295-309. [11] G. Catenazzo, E. Fragniere, B. Ribordy and J. Tuberosa, “Is the 2008 Financial Turmoil Increasing the Risk of a Bank Run?” Journal of Modern Accounting and Auditing, Vol. 6, No. 1, 2010, pp. 29-45. [12] R. Loulou, G. Goldstein and K. Noble, “MARKAL Users’ Guide: Documentation for the MARKAL Family of Mod- els,” Technical Report, 2004. http://www.etsap.org 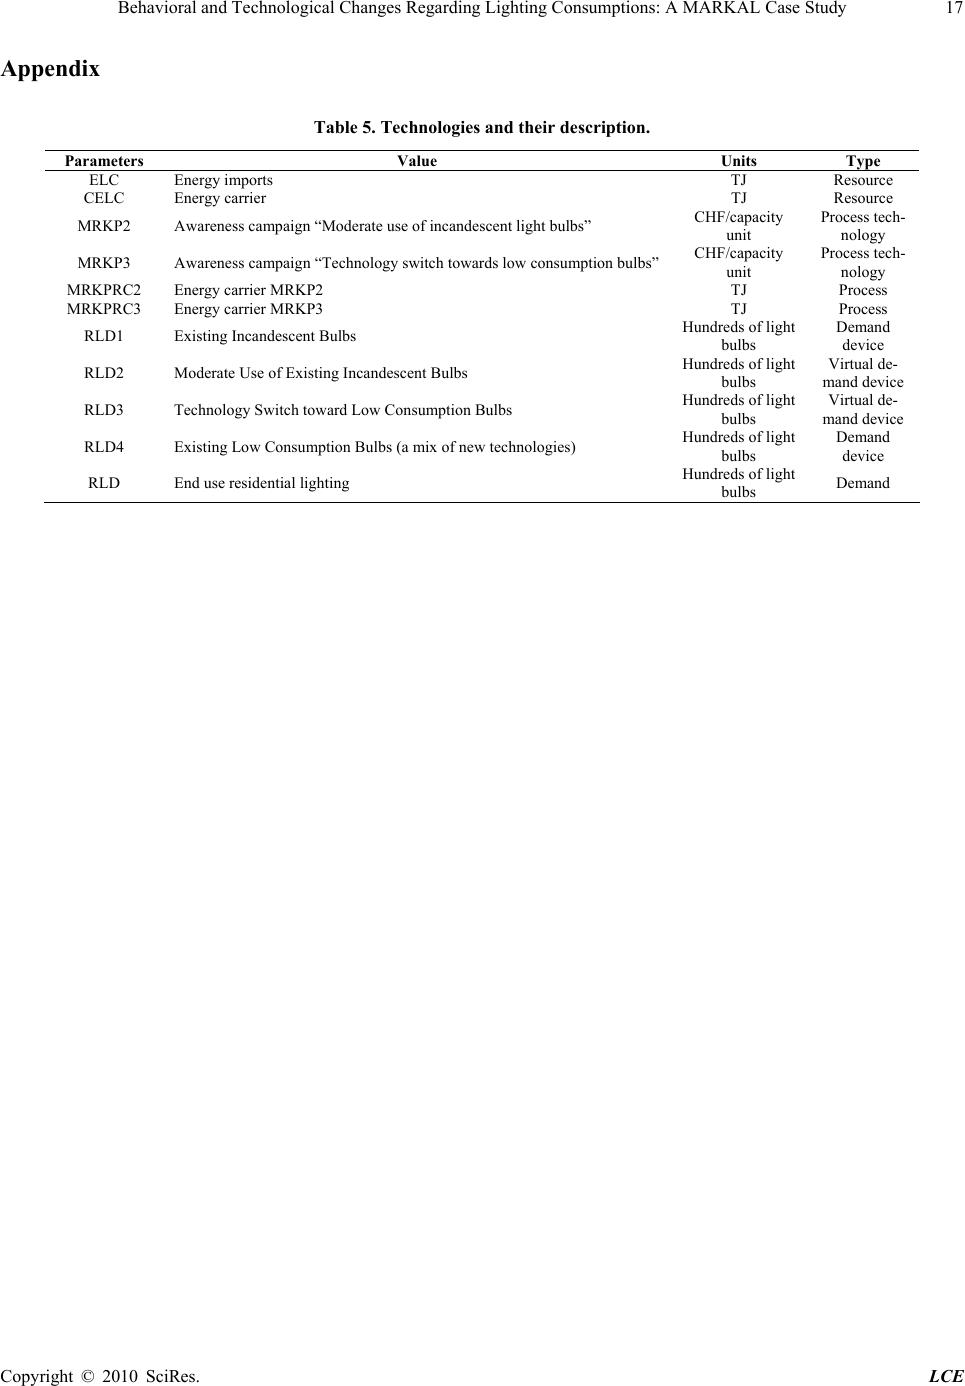 Behavioral and Technological Changes Regarding Lighting Consumptions: A MARKAL Case Study17 Appendix Table 5. Technologies and their description. Parameters Value Units Type ELC Energy imports TJ Resource CELC Energy carrier TJ Resource MRKP2 Awareness campaign “Moderate use of incandescent light bulbs” CHF/capacity unit Process tech- nology MRKP3 Awareness campaign “Technology switch towards low consumption bulbs”CHF/capacity unit Process tech- nology MRKPRC2 Energy carrier MRKP2 TJ Process MRKPRC3 Energy carrier MRKP3 TJ Process RLD1 Existing Incandescent Bulbs Hundreds of light bulbs Demand device RLD2 Moderate Use of Existing Incandescent Bulbs Hundreds of light bulbs Virtual de- mand device RLD3 Technology Switch toward Low Consumption Bulbs Hundreds of light bulbs Virtual de- mand device RLD4 Existing Low Consumption Bulbs (a mix of new technologies) Hundreds of light bulbs Demand device RLD End use residential lighting Hundreds of light bulbs Demand Copyright © 2010 SciRes. LCE |