Paper Menu >>
Journal Menu >>
 Natural Resources, 2010, 1, 34-56 doi:10.4236/nr.2010.11005 Published Online September 2010 (http://www.SciRP.org/journal/nr) Copyright © 2010 SciRes. NR Modelling Irrigation and Salinity Management Strategies in the Ord Irrigation Area Riasat Ali1, John Byrne1, Tara Slaven2 1CSIRO Land and Water, Private Bag 5, Wembley, Australia; 2Department of Agriculture and Food, Western Australia, Kununurra, Australia. Email: Riasat.ali@csiro.au Received September 6th, 2010; revised September 27th 2010; accepted September 30th, 2010. ABSTRACT The Ord River Irrigation Area (ORIA) is located within no rth ern Western Australia near the Northern Territo ry bord er. Since the beginning of irrigated agriculture in the ORIA the groundwater levels have been continuously rising and are now close to the soil surface in some parts of ORIA in northern Western Australia. The groundwater is now saline throughout most of the ORIA and soil salinity risks are high where the watertables are shallow. This research evaluated irrigation and sa linity managemen t strategies for sugarcane and m aize crops grown o ver deep and shallo w, non-saline and saline watertables in the ORIA. The LEACHC model, calibrated using field data, was used to predict the impa cts of various irrigation management strategies on water use and salt accumulation in the root zone. This study concluded that irrigation application equal to 100% of total fortnightly pan evaporation applied at 14 day intervals was a good irrigation strategy for the maize grown over a deep watertable area. This strategy would require around 11 ML/ha of irrigation water per growing season. Irrigation application equal to 75% of total fortnightly pan evaporation, applied every fortnight during first half of the growing season, and 75% of total weekly pan evaporation, applied on a weekly basis during second half of the growing season, would be the best irrigation strategy if it is feasible to chang e the irri- gation interval from 14 to seven days. This irrigation strategy is predicted to have minimal salinity risks and save around 40% irrigation water. The best irrigation strategy for sugarcane grown on Cununurra clay over a deep watert- able area would be irrigation application equal to 50% of the total fortnightly pan evaporation, applied every fortnight during first quarter of the growing season, and irrigation application amounts equal to 100% of total weekly pan evaporation, applied every week during rest of the season. The model predicted no soil salinity risks from this irrigation strategy. The best irrigation strategy for sugarcane over a non-saline, shallow watertable of one or two m depth would be irrigation application amounts equal to 50% of total fortnightly pan evaporation applied every fortnight. In the case of a saline watertable th e same irrigation strateg y was predicted to the best with resp ect to water use efficiency bu t will have high salinity risks without any drainage management. Keywords: Irrigation Modelling, Salinity Modelling, Saline Shallow Watertable, Irrigation Man a gement, Ord River Irrigation Area 1. Introduction Hydrological conditions change with the introduction of irrigated agriculture in almost any landscape. Increased accession to groundwater starts at the commencement of irrigated agriculture and over time it brings groundwater levels closer to the soil surface and leads to the develop- ment of shallow watertables. Evapotranspiration from increased availability of water from shallow watertables is the main cause of soil salinisation in irrigated areas throughout the world [1] and Australia [2]. Availability of abundant water, low population pressures and lack of awareness of the long term implications of excessive use of water has led to the problems of waterlogging and irrigated salinity in a vast majority of the old irrigation systems of the world. Today because of changing climate, high population pressures, water scarcity and increased awareness of the long term implications of excessive use of water every effort should be made to use this resource optimally to enable more production from less water thus reducing wastage via groundwater accession and runoff. In the Ord River Irrigation Area (ORIA) in northern Australia (Figure 1) the groundwater levels were deeper 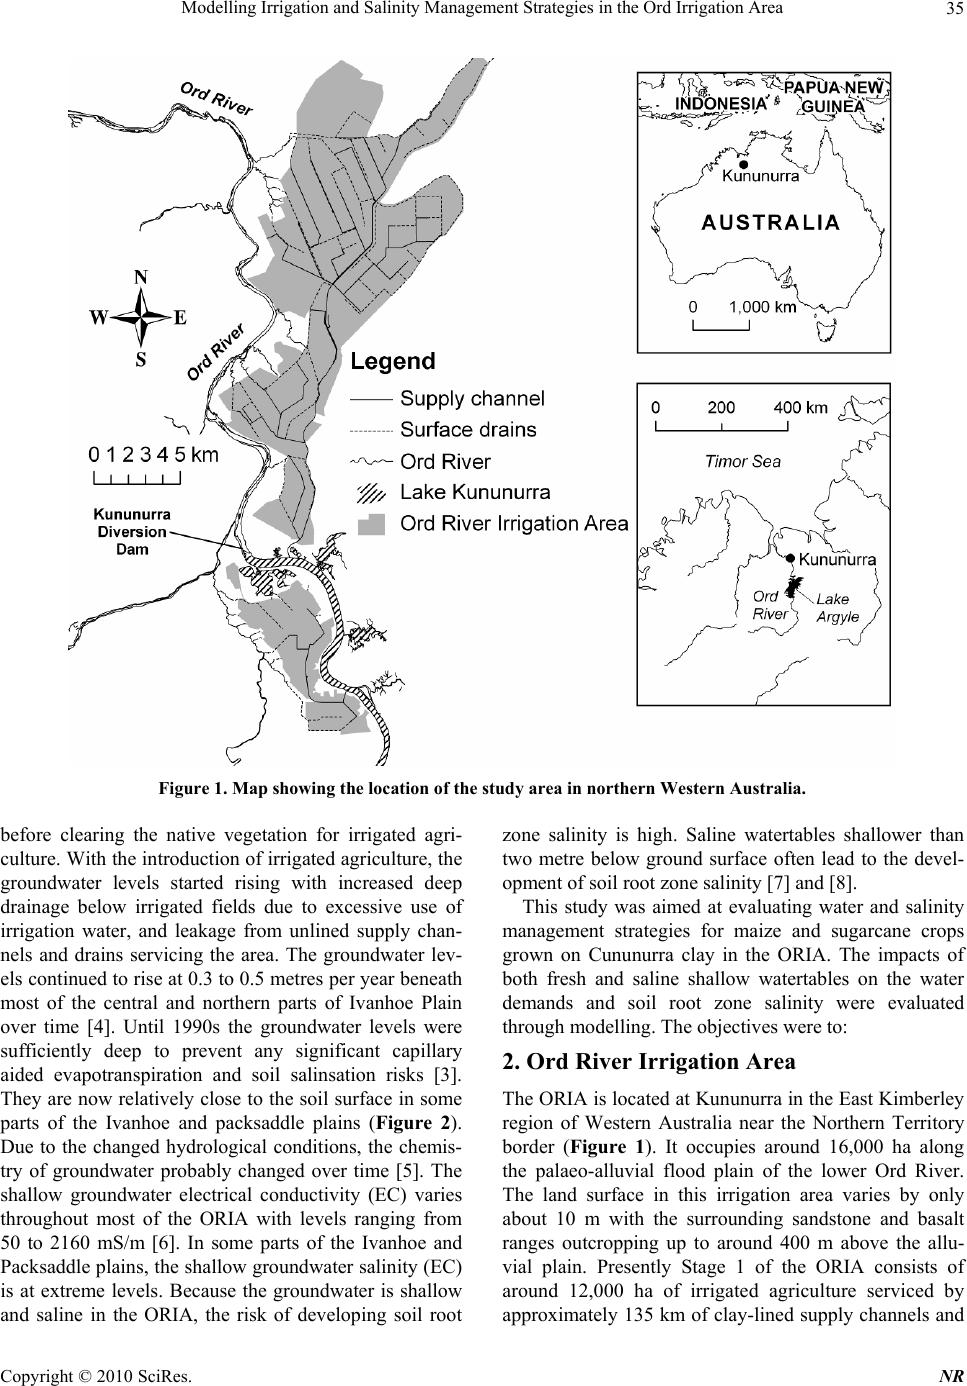 Modelling Irrigation and Salinity Management Strategies in the Ord Irrigation Area35 Figure 1. Map showing the location of the study area in northern Western Australia. before clearing the native vegetation for irrigated agri- culture. With the introduction of irrigated agriculture, the groundwater levels started rising with increased deep drainage below irrigated fields due to excessive use of irrigation water, and leakage from unlined supply chan- nels and drains servicing the area. The groundwater lev- els continued to rise at 0.3 to 0.5 metres per year beneath most of the central and northern parts of Ivanhoe Plain over time [4]. Until 1990s the groundwater levels were sufficiently deep to prevent any significant capillary aided evapotranspiration and soil salinsation risks [3]. They are now relatively close to the soil surface in some parts of the Ivanhoe and packsaddle plains (Figure 2). Due to the changed hydrological conditions, the chemis- try of groundwater probably changed over time [5]. The shallow groundwater electrical conductivity (EC) varies throughout most of the ORIA with levels ranging from 50 to 2160 mS/m [6]. In some parts of the Ivanhoe and Packsaddle plains, the shallow groundwater salinity (EC) is at extreme levels. Because the groundwater is shallow and saline in the ORIA, the risk of developing soil root zone salinity is high. Saline watertables shallower than two metre below ground surface often lead to the devel- opment of soil root zone salinity [7] and [8]. This study was aimed at evaluating water and salinity management strategies for maize and sugarcane crops grown on Cununurra clay in the ORIA. The impacts of both fresh and saline shallow watertables on the water demands and soil root zone salinity were evaluated through modelling. The objectives were to: 2. Ord River Irrigation Area The ORIA is located at Kununurra in the East Kimberley region of Western Australia near the Northern Territory border (Figure 1). It occupies around 16,000 ha along the palaeo-alluvial flood plain of the lower Ord River. The land surface in this irrigation area varies by only about 10 m with the surrounding sandstone and basalt ranges outcropping up to around 400 m above the allu- vial plain. Presently Stage 1 of the ORIA consists of around 12,000 ha of irrigated agriculture serviced by approximately 135 km of clay-lined supply channels and Copyright © 2010 SciRes. NR 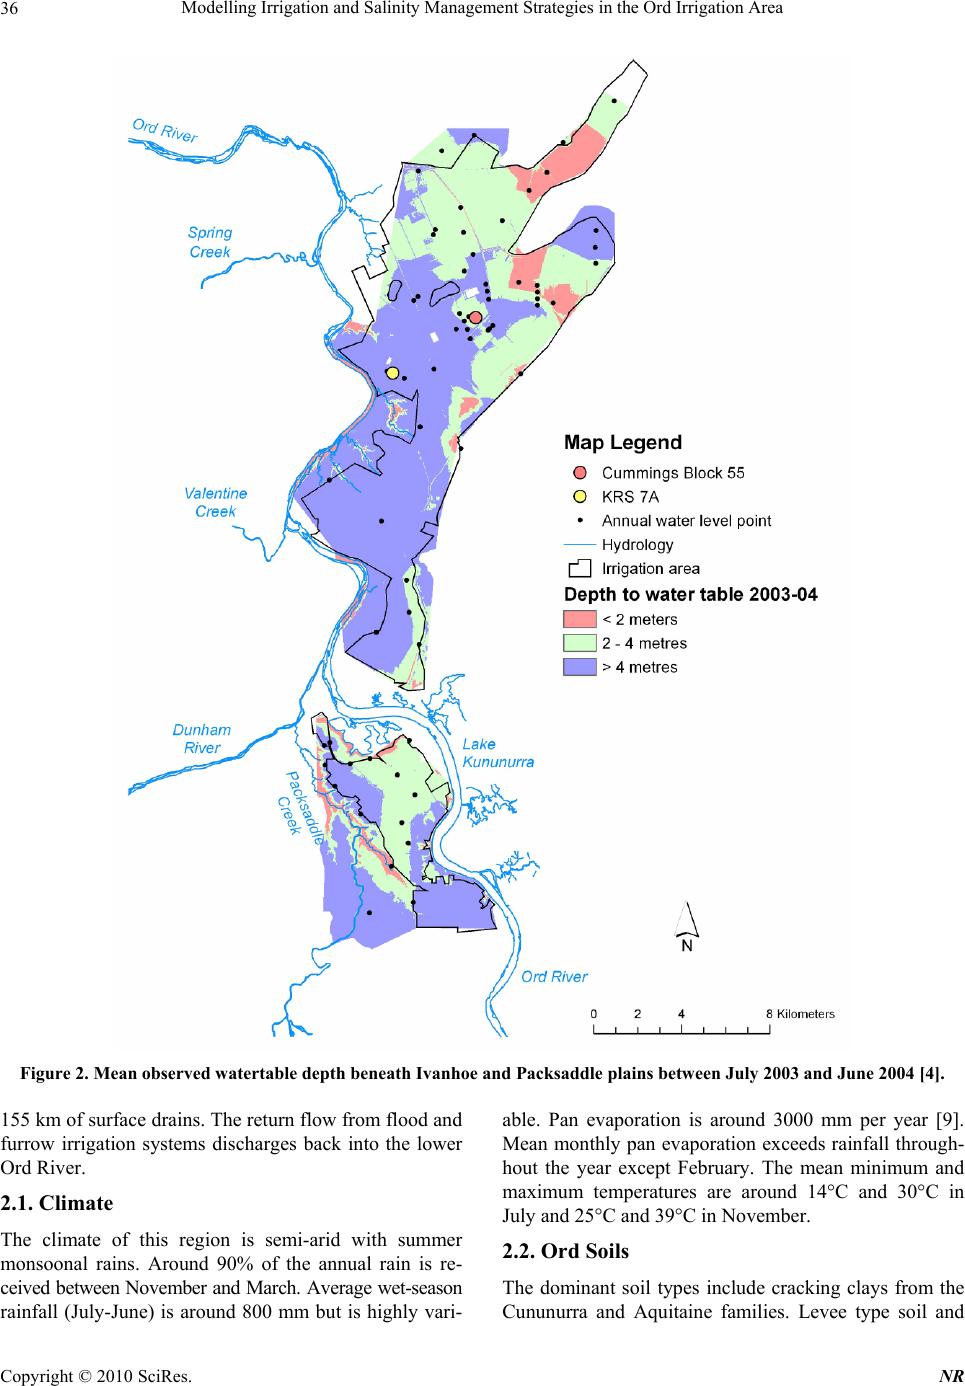 Modelling Irrigation and Salinity Management Strategies in the Ord Irrigation Area 36 Figure 2. Mean observed watertable depth beneath Ivanhoe and Packsaddle plains between July 2003 and June 2004 [4]. 155 km of surface drains. The return flow from flood and furrow irrigation systems discharges back into the lower Ord River. 2.1. Climate The climate of this region is semi-arid with summer monsoonal rains. Around 90% of the annual rain is re- ceived between November and March. Average wet-season rainfall (July-June) is around 800 mm but is highly vari- able. Pan evaporation is around 3000 mm per year [9]. Mean monthly pan evaporation exceeds rainfall through- hout the year except February. The mean minimum and maximum temperatures are around 14°C and 30°C in July and 25°C and 39°C in November. 2.2. Ord Soils The dominant soil types include cracking clays from the Cununurra and Aquitaine families. Levee type soil and Copyright © 2010 SciRes. NR  Modelling Irrigation and Salinity Management Strategies in the Ord Irrigation Area37 sands also exist. The Cununurra clays occur in normal, alkaline and leached phases. Detailed information relat- ing to soils in the Ord River area can be found in [10-12]; and [13]. The normal phase of Cununurra Clay occurs in large areas of the Packsaddle Plain and has a dark colour with medium texture and poor drainage. The alkaline phase consists of imperfect to poorly drained brown clays with fine topsoil and exists in a large area south of the Kimberly Research Station on Ivanhoe Plain. The leached phase occurs in the north and east. It generally has a coarser structure and higher clay content and poor to very poor drainage. Aquitaine soils are bluish-grey to yellow cracking clays and exist in areas subjected to prolonged inundation, such as swamps, and have very poor drainage. Smaller areas of the alkaline and acid phases also occur. Packsaddle loamy sands exist adjacent to the Cununurra clays. These are better drained and well suited to intensive horticultural activities. The light tex- tured Ord loamy sands are located near the river. Sand and gravel beds of the old palaeochannel of the Ord River underlie more than 60 percent of the ORIA. These beds form extensive interconnected aquifers under irri- gated areas of the Packsaddle and Ivanhoe plains. 2.3. Main Crops and Irrigation Methods To identify irrigable areas in the Ivanhoe and Packsaddle plains, a detailed survey of the area was conducted in 1944. The irrigation development project was imple- mented in stages. Initially, only five farms on Ivanhoe Plain were released for irrigation in 1962. By 1969, a total of 30 farms (5,540 ha) were released. The irrigated area increased by 200% to around 11,000 ha between 1990 and 1999. More than half of over 100 active farms are small and rely on off-farm income. About 40 farms are large-scale where a variety of crops are grown. The main crops include sugarcane, maize, chickpea, sun- flower and horticultural including melons, pumpkin, mangoes, bananas citrus and sandlewood. Recently irri- gated sandlewood plantations have increased substan- tially. Sugarcane introduced during 1990s is one of the major crops in the ORIA and has more than double the water requirements of most other crops [14]. Irrigated crops are generally grown during the dry season when growing conditions are best [15]. The irrigated fields are mostly fallow during the wet season except annual crops such as sugarcane. The value of the main crops ranges between $60 and $80 million per annum. The sugarcane, melons and sandlewood produce the highest values. The average output values per hectare of cropped area range from $2,500 to over $17,000. Three high value crops include bananas ($17,200 per ha), melons ($13,600 per ha) and pumpkin ($18,800 per ha). The sugarcane has a relatively low value ($4,200 per ha). Although bananas produce the highest per hectare values their production has almost ceased recently. The sandlewood values almost three times the value of sugarcane; increasing areas of sandle- wood plantations are indicative of their high returns. Common irrigation methods are furrow, sprinkler and drip. Intensive tree crops and bananas, grown on sandier soils, are irrigated using sprinkler and drip irrigation methods. The clay soils are better suited for broad acre farming. On these clay soils, the furrow irrigation is used for most broad acre crop production including sugarcane and maize. Fields are laser levelled to a gradient ranging between 1:800 and 1:2,000. The furrow lengths are often 200 m long and rarely longer than 500 m. The beds are mostly 1.8 m wide and 0.16 m high above furrow. The height between the surface water in the water course and the tumble area of the furrow is called irrigation head and typically ranges between 100 and 250 mm. The water supply from the water course to the furrow is through siphon whose diameter ranges between 25 mm and 50 mm depending on the furrow length and water supply rate. Irrigation interval and application amounts vary de- pending on crop type, growing stage, weather and farmer. They typically range from one week to more than a month and are not optimal. Usually irrigation application amounts are significantly larger than the required amounts determined based on soil moisture deficit. This results in excessive deep drainage and groundwater accessions and runoff from irrigated fields. This also results in applica- tion of irrigations when either too much moisture is still available from an earlier irrigation or the crop is under stress due to insufficient soil moisture. 2.4. Irrigation Water Availability The water allocation for Stage 1 (about 11,000 ha irri- gated area) is 350 GL per year. An allocation of 400 GL per year is set for irrigation of new area of about 14,000 hectares in Stage 2. The irrigation water is supplied by constructing a Kununurra diversion dam on the Ord River and M1 supply channel network. The Kununurra diversion dam, a 20 m high structure that forms Lake Kununurra of 101 GL storage capacity, holds water in the Ord River water course for approximately 50 km up- stream. The Ord River Dam, located approximately 60 km upstream in the Carr Boyd Ranges, was constructed to store water in Lake Argyle to ensure a reliable supply of irrigation water to the ORIA. The water is released from Lake Argyle and stored in Lake Kununurra which provides the head necessary to divert water to irrigation areas in the ORIA. Water levels in Lake Argyle therefore dictate any restriction policies for water demands. The average annual water availability from Lake Ar- Copyright © 2010 SciRes. NR  Modelling Irrigation and Salinity Management Strategies in the Ord Irrigation Area 38 gyle is 4257 GL. The Lake Argyle water is diverted for irrigation use, hydropower generation and environmental releases. Currently only about 8 percent of the available water is used for irrigation in Stage 1 of the ORIA. With the introduction of Stage 2 irrigation area the level of use for irrigation is projected to increase to about 17 percent. If all controlled releases such as irrigation, environmental and power generation are included the level of use in- creases to about 57 percent of the available water. Under a wet future climate increased inflows into Lake Argyle are expected and the annual water availability is pro- jected to increase to about 5110 GL and the relative level of use for controlled releases is projected to reduce to about 50 percent. Under a dry future climate, due to de- creased inflows into Lake Argyle, the annual water availability is expected to reduce to about 3320 GL and relative level of water use for controlled releases is likely to increase to about 64 percent of the total available wa- ter [16]. The water availability for irrigation is not a major is- sue in the ORIA since relatively secured supplies are likely to be available in the future for existing Stage 1 and future Stage 2 irrigation areas. In the ORIA an effi- cient on-farm irrigation water management through an optimal irrigation scheduling is mainly required to maximise crop production and minimise excessive deep drainage. Deep drainage fluxes can vary from negative flux [17] to 119 mm per year [18] under irrigated sugar- cane. Reduction in deep drainage fluxes through an op- timal irrigation scheduling will help control rising wa- tertables and the development of soil salinity in ORIA. 3. Model Description The LEACHC version of LEACHM was selected for irrigation scheduling and assessing the impacts of various fresh and saline shallow watertables on soil salinity built up when the maize and sugarcane are grown on the Cununurra Clay. This model has previously been used for irrigation scheduling under saline shallow watertable conditions [7] and [8]. LEACHM (Leaching Estimation And CHemistry Model) is one of the more complex and comprehensive models for simulating processes in crop root zones [19]. It can also be categorised as a complex model with respect to its approach to soil chemistry be- cause it considers the independent movement of individ- ual ions, including equilibrating the soil solution phase with the solid phase using precipitation-dissolution of lime and gypsum, significant ionic-pairing, and cation exchange. However it tends to under predict reactive ions. LEACHC uses a finite-difference solution of the one-dimensional Richard's equation for unsaturated flow. To approximate the hydraulic conductivity, matric poten- tial and moisture content (K-h-θ) relationships, the model uses either the expressions developed by [20] or fits the two-part retentivity functions developed by [21]. If this retentivity function is selected, various regression equa- tions are available [19,22,23] and [24]. In this study the equations developed by [20] were used for estimating soil retention relationships based on input of soil textural properties, bulk density, organic carbon and saturated hydraulic conductivity in various layers of the soil profile. To approximate evapotranspiration the model uses the method of [25]. From the input of weekly pan evapora- tion totals (P), the model calculates daily potential evapotranspiration (ETd). To determine daily potential transpiration (Td), ETd is multiplied by the crop cover fraction (Ccf). The equation developed by [26] was used to approximate the crop cover during various growing stages of the maize and sugarcane. The daily potential surface evaporation (Ed) is the difference between ETd and Td. The equations used for maize and sugarcane root growth and root density distribution as a function of time in this study are based on those given by [27]. The water uptake rate by the maize and sugarcane roots is approxi- mated by using equation developed by [28]. A number of upper and lower boundary conditions are provided in the model. The upper boundary conditions include ponded or non-ponded infiltration and evapora- tion or zero flux. The five different lower boundary con- ditions are: a) fixed watertable depth; b) free draining profile; c) zero flux; d) lysimeter tank; and e) fluctuating watertable. A fixed watertable boundary condition was used for this study. Use of Richard's equation for unsatu- rated flow assumes that the soil is: homogeneous hori- zontally, rigid and incompressible, non-hysteretic and iso-thermal, and that there is no preferential flow. After the solution of Richard's equation for unsaturated flow, including sinks, the movement and distribution of solutes are modelled by solving numerically the convec- tion-diffusion equation (CDE). The model can handle the movement and distribution of Ca, Mg, Na, K, Cl, SO4, CO3, HCO3, H, OH and their major ion pairs. 4. Material and Methods Two experimental sites (Figure 2) were selected to col- lect the field data about soil physical properties; irriga- tion frequency and application amounts; soil moisture, watertable depth, and soil and water chemistry. The pur- pose was to monitor temporal changes in soil moisture and salinity profiles over the growing period to assess any water or salt stress under current irrigation practice and calibrate LEACHC to enable its use for evaluating various irrigation management strategies. Copyright © 2010 SciRes. NR  Modelling Irrigation and Salinity Management Strategies in the Ord Irrigation Area Copyright © 2010 SciRes. NR 39 4.1. Kimberly Research Station Site–KRS 7A This 6.6 ha site was located near the Kimberly Research Station (KRS) in block 7A (Figure 2). The soil in this block belongs to the Cununurra Clay and a maize crop grown during 2004 was selected for the study. To deter- mine the soil physical and textural properties, soil sam- ples were collected from two locations (7A-1 and 7A-2). At each location, the soil samples were collected from various segments up to 2 m depth. Each soil sample was analysed for soil texture, bulk density, organic carbon, and soil moisture. The saturated paste extracts of soil samples were analysed in the laboratory for major ions, EC and pH. Soil textural and chemical data were used as the initial soil moisture and soil chemical compositions during model calibration. Textural properties of the soil at KRS 7A-1 and KRS 7A-2 (Table 1) were averaged and used as input in the LEACHC model for estimating the soil retention properties. A total soil profile depth of 2 m was divided into 10 segments of 200 mm each seg- ment. The soil textural properties varied across its vari- ous segments as listed in Table 1 and so were the esti- mated retention properties. The soil retention properties estimated by the model were similar to those determined through laboratory experiments by [29] for the Cununurra Clay (Table 2). The amount of soil water available for extraction by the maize plant roots from various segments of a 2 m soil profile was averaged around 220 mm. Additional soil samples, collected on June 11, 2004, July 12, 2004 and October 08, 2004, were analysed for soil moisture and soil chemical properties (EC and pH) and then compared with model predictions during the model calibration. The watertable in the experimental block, monitored by taking regular water level readings from an existing bore hole at this site, varied around 4 m below ground surface throughout the growing season and accordingly its depth was fixed at 4 m in the model. A groundwater sample, collected from the bore hole and analysed for major ions, EC and pH, indicated that the shallow groundwater was saline; EC around 400 mS/m (Table 3); major ions were used as input in the model to represent the initial chemical composition of the watert- able. The maize was sown during the last week of April 2004 which germinated during the first week of May and developed its full canopy during the last week of July 2004. It was harvested during the first week of October 2004. These dates were used for simulating the maize crop growth in the LEACHC. The fertilizer application rates were 250 kg/ha Di-Ammonium Phosphate (DAP), 50 kg/ha Zinc Sulphate Monohydrate, 50 kg/ha Sulphate of Potash and 460 kg/ha Urea. The maize roots can de- velop up to 2 m below the ground surface [30]. However most of the maize roots are concentrated within the top parts of the soil profile according to many researchers [31,32] and [33]. For this study a 2 m root zone was as- sumed. The relative fraction of maximum root length density followed that described by [34]. Using this ge- neric distribution the root zone was subdivided into four quarters with 40, 30, 20 and 10 percent of the roots in each quarter starting from top of the soil profile. Total irrigation and rainfall amounts applied to the crop and used as input into the model were 1300 mm and 15 mm, respectively during the growing season (Table 4). The irrigation applications remained uniform throughout the growing period. During each watering, 9.5 ML was applied in 12 hours to irrigate 6.6 ha of the maize. Because Table 1. Soil textural properties at KRS 7A-1 and KRS 7A-2 near Kimberley Research Station. KRS 7A-1 Depth (mm) Sand % Silt % Clay % OC* % KRS 7A-2 Depth (mm) Sand %Silt % Clay % OC* % 0-100 39.2 16.0 44.8 1.1 0-100 35.9 9.7 54.4 1.0 100-200 39.8 10.1 50.1 0.8 100-200 39.2 10.7 50.1 0.8 200-400 36.6 14.9 48.5 0.5 200-400 35.2 12.4 52.4 0.7 400-800 32.5 15.1 52.4 0.4 400-800 38.6 13.1 48.3 0.4 800-1100 36.3 14.2 49.5 0.4 800-1100 36.3 14.4 49.3 0.4 1100-1500 29.6 18.7 51.7 0.3 1100-1500 42.1 14.7 43.2 0.2 1500-1700 31.2 16.4 52.4 0.2 1500-1700 36.7 19.8 43.5 0.8 1700-2000 41.1 16.0 42.9 0.1 *Organic carbon. 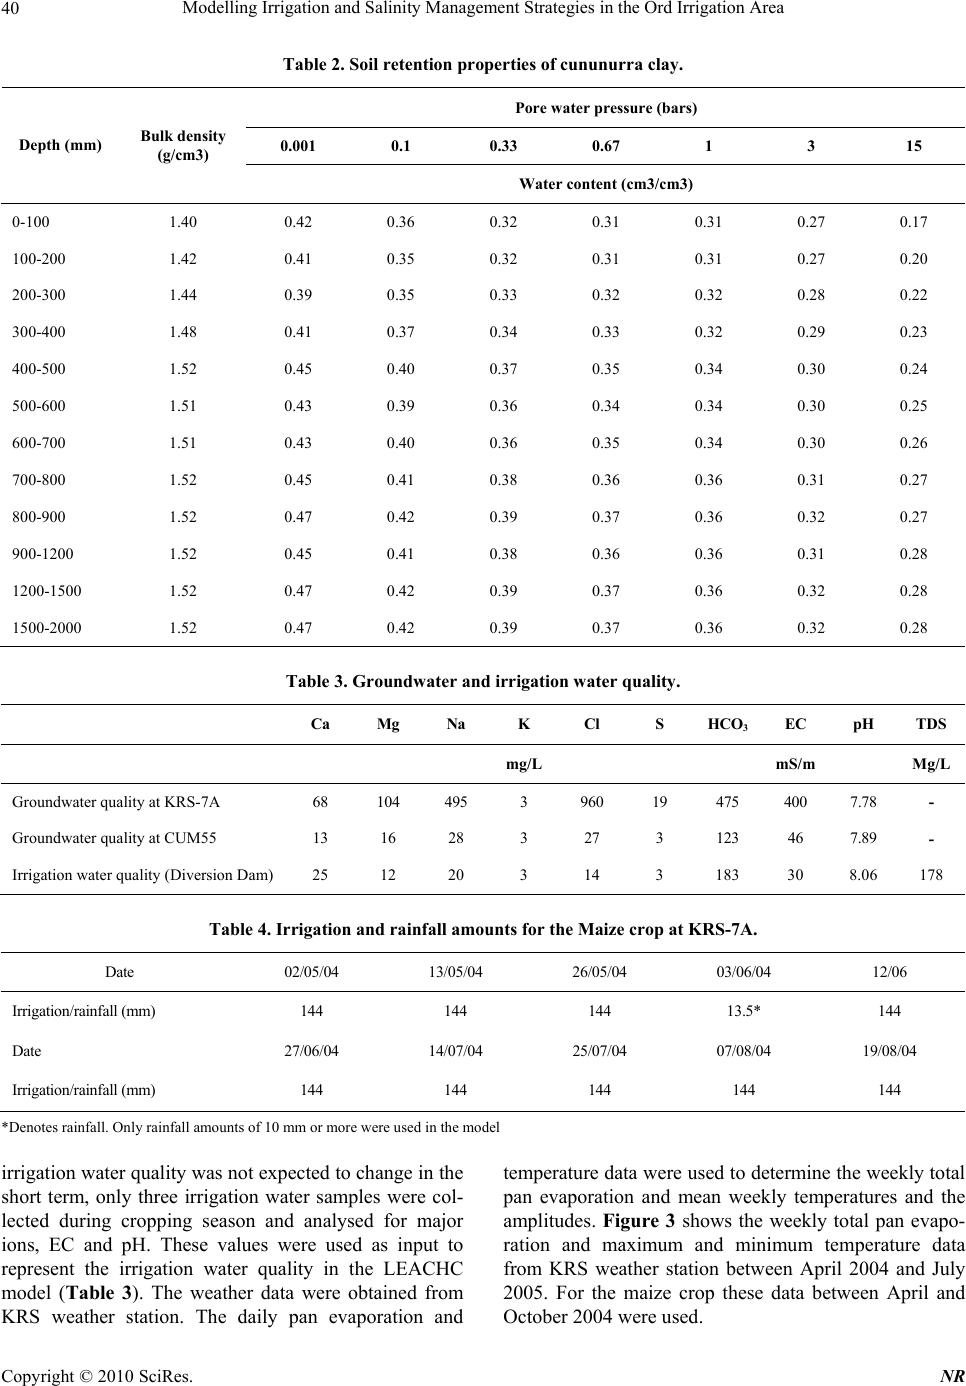 Modelling Irrigation and Salinity Management Strategies in the Ord Irrigation Area 40 Table 2. Soil retention propertie s of cununurra clay. Pore water pressure (bars) 0.001 0.1 0.33 0.67 1 3 15 Depth (mm) Bulk density (g/cm3) Water content (cm3/cm3) 0-100 1.40 0.42 0.36 0.32 0.31 0.31 0.27 0.17 100-200 1.42 0.41 0.35 0.32 0.31 0.31 0.27 0.20 200-300 1.44 0.39 0.35 0.33 0.32 0.32 0.28 0.22 300-400 1.48 0.41 0.37 0.34 0.33 0.32 0.29 0.23 400-500 1.52 0.45 0.40 0.37 0.35 0.34 0.30 0.24 500-600 1.51 0.43 0.39 0.36 0.34 0.34 0.30 0.25 600-700 1.51 0.43 0.40 0.36 0.35 0.34 0.30 0.26 700-800 1.52 0.45 0.41 0.38 0.36 0.36 0.31 0.27 800-900 1.52 0.47 0.42 0.39 0.37 0.36 0.32 0.27 900-1200 1.52 0.45 0.41 0.38 0.36 0.36 0.31 0.28 1200-1500 1.52 0.47 0.42 0.39 0.37 0.36 0.32 0.28 1500-2000 1.52 0.47 0.42 0.39 0.37 0.36 0.32 0.28 Table 3. Groundwate r and irrigation w a ter quality. Ca Mg Na K Cl S HCO3 EC pH TDS mg/L mS/m Mg/L Groundwater quality at KRS-7A 68 104 495 3 960 19 475 400 7.78 - Groundwater quality at CUM55 13 16 28 3 27 3 123 46 7.89 - Irrigation water quality (Diversion Dam) 25 12 20 3 14 3 183 30 8.06 178 Table 4. Irrigation and rainfall amounts for the Maize crop at KRS-7A. Date 02/05/04 13/05/04 26/05/04 03/06/04 12/06 Irrigation/rainfall (mm) 144 144 144 13.5* 144 Date 27/06/04 14/07/04 25/07/04 07/08/04 19/08/04 Irrigation/rainfall (mm) 144 144 144 144 144 *Denotes rainfall. Only rainfall amounts of 10 mm or more were used in the model irrigation water quality was not expected to change in the short term, only three irrigation water samples were col- lected during cropping season and analysed for major ions, EC and pH. These values were used as input to represent the irrigation water quality in the LEACHC model (Table 3). The weather data were obtained from KRS weather station. The daily pan evaporation and temperature data were used to determine the weekly total pan evaporation and mean weekly temperatures and the amplitudes. Figure 3 shows the weekly total pan evapo- ration and maximum and minimum temperature data from KRS weather station between April 2004 and July 2005. For the maize crop these data between April and ctober 2004 were used. O Copyright © 2010 SciRes. NR 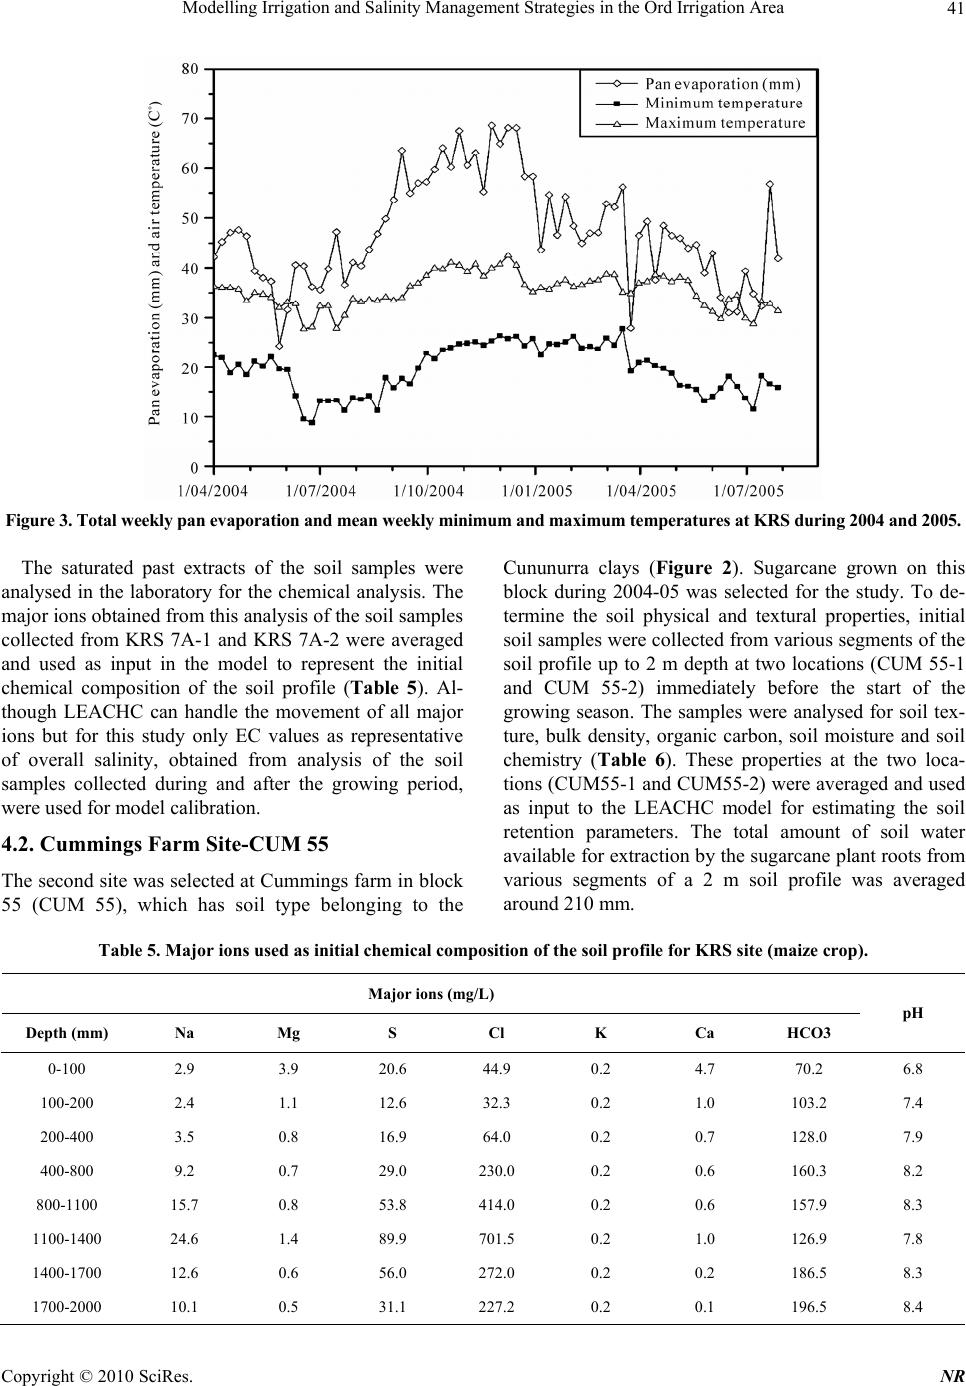 Modelling Irrigation and Salinity Management Strategies in the Ord Irrigation Area41 Figure 3. Total weekly pan evaporation and mean weekly minimum and maximum temperatures at KRS during 2004 and 2005. The saturated past extracts of the soil samples were analysed in the laboratory for the chemical analysis. The major ions obtained from this analysis of the soil samples collected from KRS 7A-1 and KRS 7A-2 were averaged and used as input in the model to represent the initial chemical composition of the soil profile (Table 5). Al- though LEACHC can handle the movement of all major ions but for this study only EC values as representative of overall salinity, obtained from analysis of the soil samples collected during and after the growing period, were used for model calibration. 4.2. Cummings Farm Site-CUM 55 The second site was selected at Cummings farm in block 55 (CUM 55), which has soil type belonging to the Cununurra clays (Figure 2). Sugarcane grown on this block during 2004-05 was selected for the study. To de- termine the soil physical and textural properties, initial soil samples were collected from various segments of the soil profile up to 2 m depth at two locations (CUM 55-1 and CUM 55-2) immediately before the start of the growing season. The samples were analysed for soil tex- ture, bulk density, organic carbon, soil moisture and soil chemistry (Table 6). These properties at the two loca- tions (CUM55-1 and CUM55-2) were averaged and used as input to the LEACHC model for estimating the soil retention parameters. The total amount of soil water available for extraction by the sugarcane plant roots from various segments of a 2 m soil profile was averaged around 210 mm. Table 5. Major ions used as initial chemical composition of the soil profile for KRS site (maize crop). Major ions (mg / L) Depth (mm) Na Mg S Cl K Ca HCO3 pH 0-100 2.9 3.9 20.6 44.9 0.2 4.7 70.2 6.8 100-200 2.4 1.1 12.6 32.3 0.2 1.0 103.2 7.4 200-400 3.5 0.8 16.9 64.0 0.2 0.7 128.0 7.9 400-800 9.2 0.7 29.0 230.0 0.2 0.6 160.3 8.2 800-1100 15.7 0.8 53.8 414.0 0.2 0.6 157.9 8.3 1100-1400 24.6 1.4 89.9 701.5 0.2 1.0 126.9 7.8 1400-1700 12.6 0.6 56.0 272.0 0.2 0.2 186.5 8.3 1700-2000 10.1 0.5 31.1 227.2 0.2 0.1 196.5 8.4 Copyright © 2010 SciRes. NR 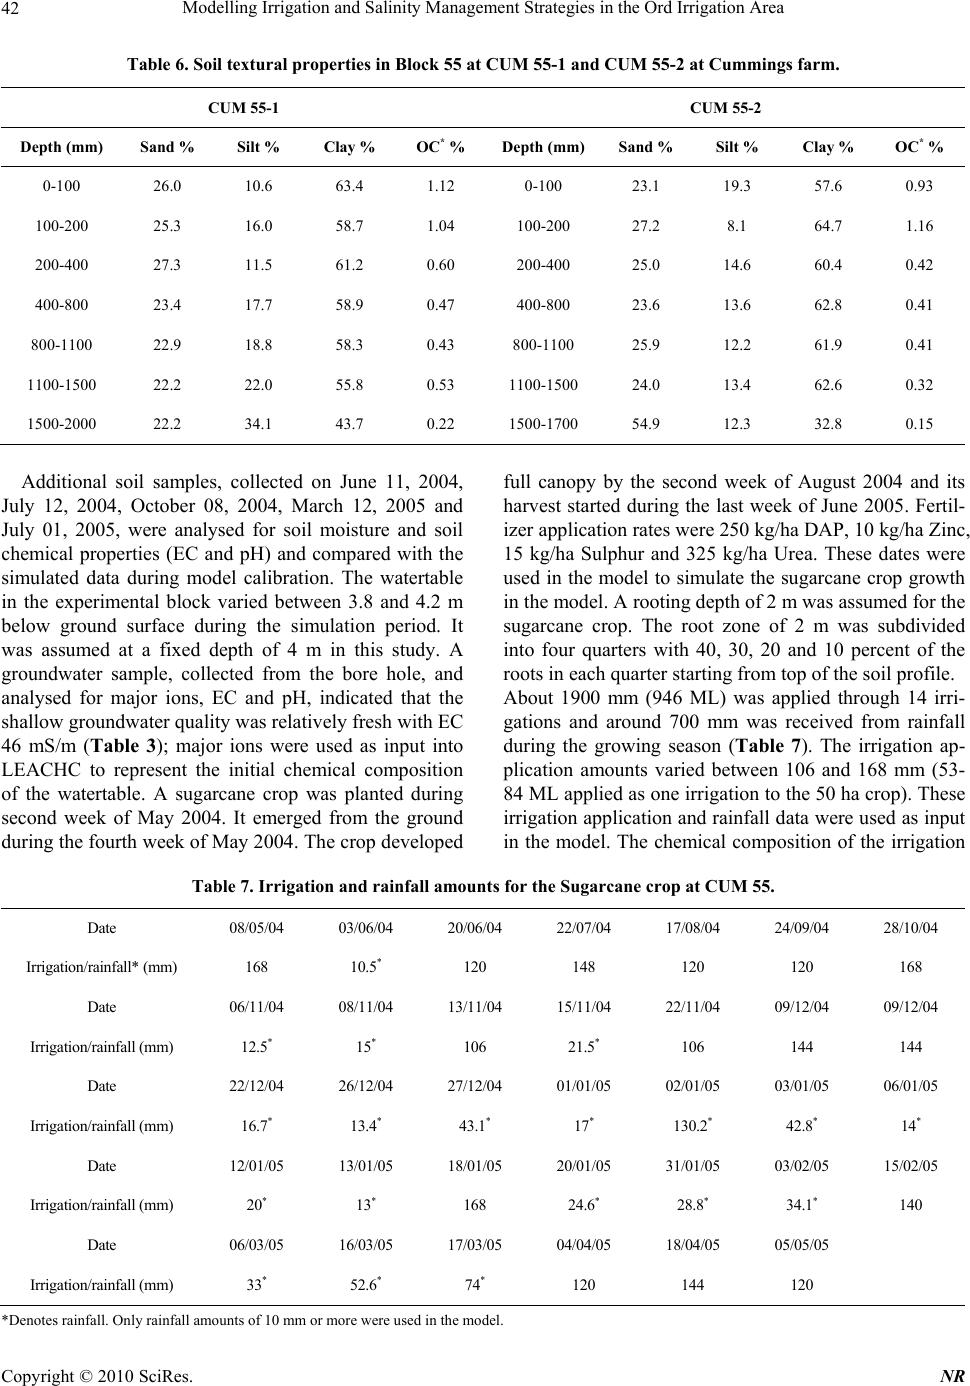 Modelling Irrigation and Salinity Management Strategies in the Ord Irrigation Area 42 Table 6. Soil textural properties in Block 55 at CUM 55-1 and CUM 55-2 at Cummings farm. CUM 55-1 CUM 55-2 Depth (mm) Sand % Silt % Clay % OC* % Depth (mm)Sand % Silt % Clay % OC* % 0-100 26.0 10.6 63.4 1.12 0-100 23.1 19.3 57.6 0.93 100-200 25.3 16.0 58.7 1.04 100-200 27.2 8.1 64.7 1.16 200-400 27.3 11.5 61.2 0.60 200-400 25.0 14.6 60.4 0.42 400-800 23.4 17.7 58.9 0.47 400-800 23.6 13.6 62.8 0.41 800-1100 22.9 18.8 58.3 0.43 800-1100 25.9 12.2 61.9 0.41 1100-1500 22.2 22.0 55.8 0.53 1100-1500 24.0 13.4 62.6 0.32 1500-2000 22.2 34.1 43.7 0.22 1500-1700 54.9 12.3 32.8 0.15 Additional soil samples, collected on June 11, 2004, July 12, 2004, October 08, 2004, March 12, 2005 and July 01, 2005, were analysed for soil moisture and soil chemical properties (EC and pH) and compared with the simulated data during model calibration. The watertable in the experimental block varied between 3.8 and 4.2 m below ground surface during the simulation period. It was assumed at a fixed depth of 4 m in this study. A groundwater sample, collected from the bore hole, and analysed for major ions, EC and pH, indicated that the shallow groundwater quality was relatively fresh with EC 46 mS/m (Table 3); major ions were used as input into LEACHC to represent the initial chemical composition of the watertable. A sugarcane crop was planted during second week of May 2004. It emerged from the ground during the fourth week of May 2004. The crop developed full canopy by the second week of August 2004 and its harvest started during the last week of June 2005. Fertil- izer application rates were 250 kg/ha DAP, 10 kg/ha Zinc, 15 kg/ha Sulphur and 325 kg/ha Urea. These dates were used in the model to simulate the sugarcane crop growth in the model. A rooting depth of 2 m was assumed for the sugarcane crop. The root zone of 2 m was subdivided into four quarters with 40, 30, 20 and 10 percent of the roots in each quarter starting from top of the soil profile. About 1900 mm (946 ML) was applied through 14 irri- gations and around 700 mm was received from rainfall during the growing season (Table 7). The irrigation ap- plication amounts varied between 106 and 168 mm (53- 84 ML applied as one irrigation to the 50 ha crop). These irrigation application and rainfall data were used as input in the model. The chemical composition of the irrigation Table 7. Irrigation and rainfall amounts for the Sugarcane crop at CUM 55. Date 08/05/04 03/06/04 20/06/04 22/07/04 17/08/04 24/09/04 28/10/04 Irrigation/rainfall* (mm) 168 10.5* 120 148 120 120 168 Date 06/11/04 08/11/04 13/11/04 15/11/04 22/11/04 09/12/04 09/12/04 Irrigation/rainfall (mm) 12.5* 15* 106 21.5* 106 144 144 Date 22/12/04 26/12/04 27/12/04 01/01/05 02/01/05 03/01/05 06/01/05 Irrigation/rainfall (mm) 16.7* 13.4* 43.1* 17* 130.2* 42.8* 14* Date 12/01/05 13/01/05 18/01/05 20/01/05 31/01/05 03/02/05 15/02/05 Irrigation/rainfall (mm) 20* 13* 168 24.6* 28.8* 34.1* 140 Date 06/03/05 16/03/05 17/03/05 04/04/05 18/04/05 05/05/05 Irrigation/rainfall (mm) 33* 52.6* 74* 120 144 120 *Denotes rainfall. Only rainfall amounts of 10 mm or more were used in the model. Copyright © 2010 SciRes. NR 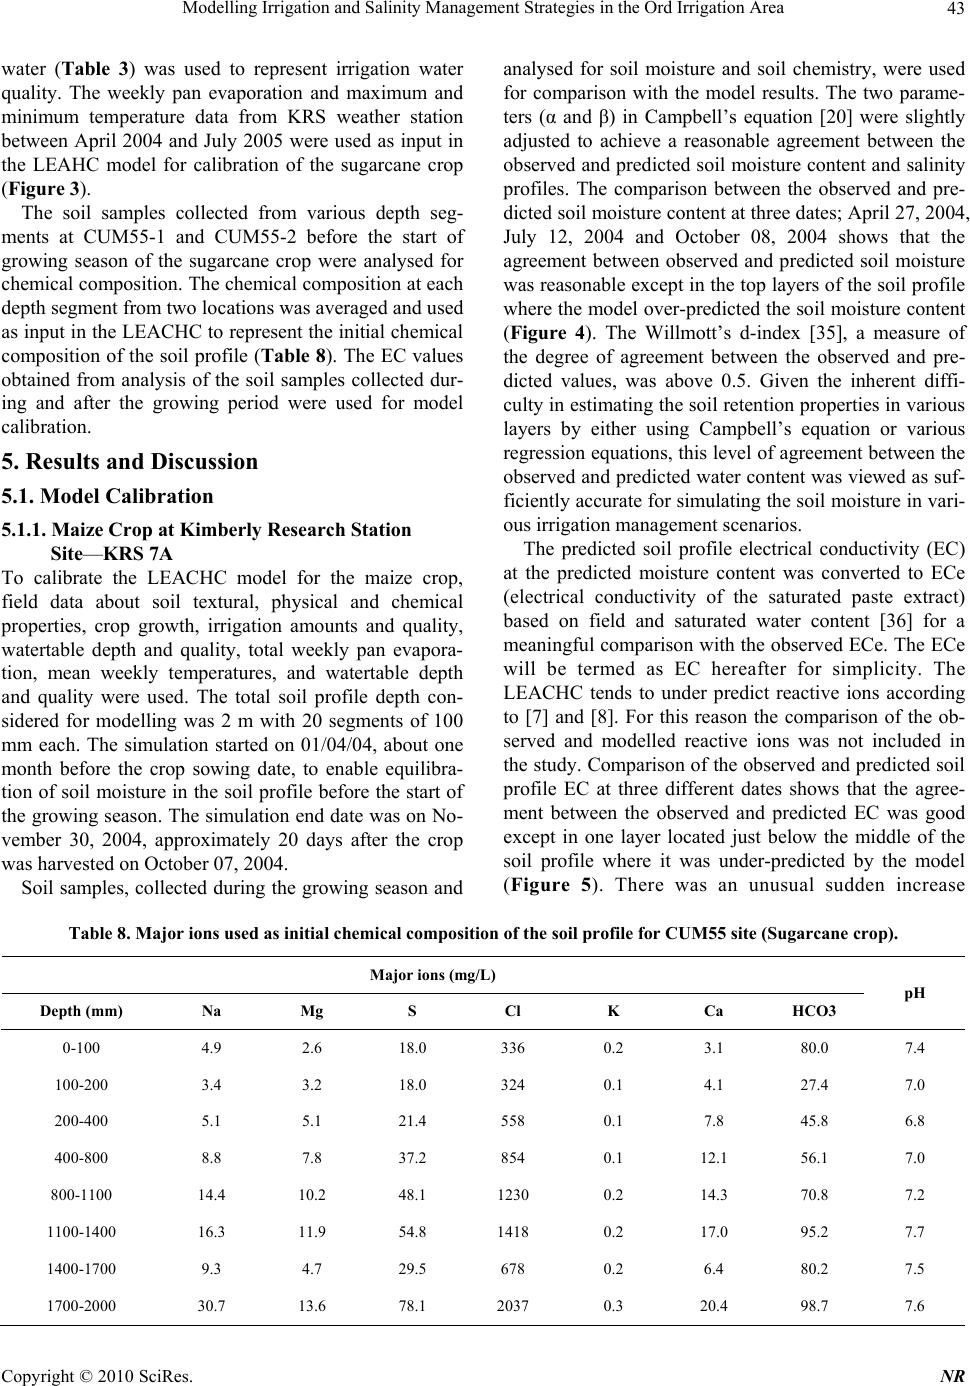 Modelling Irrigation and Salinity Management Strategies in the Ord Irrigation Area43 water (Table 3) was used to represent irrigation water quality. The weekly pan evaporation and maximum and minimum temperature data from KRS weather station between April 2004 and July 2005 were used as input in the LEAHC model for calibration of the sugarcane crop (Figure 3). The soil samples collected from various depth seg- ments at CUM55-1 and CUM55-2 before the start of growing season of the sugarcane crop were analysed for chemical composition. The chemical composition at each depth segment from two locations was averaged and used as input in the LEACHC to represent the initial chemical composition of the soil profile (Table 8). The EC values obtained from analysis of the soil samples collected dur- ing and after the growing period were used for model calibration. 5. Results and Discussion 5.1. Model Calibration 5.1.1. Maize Crop at Kimberly Research Station Site—KRS 7A To calibrate the LEACHC model for the maize crop, field data about soil textural, physical and chemical properties, crop growth, irrigation amounts and quality, watertable depth and quality, total weekly pan evapora- tion, mean weekly temperatures, and watertable depth and quality were used. The total soil profile depth con- sidered for modelling was 2 m with 20 segments of 100 mm each. The simulation started on 01/04/04, about one month before the crop sowing date, to enable equilibra- tion of soil moisture in the soil profile before the start of the growing season. The simulation end date was on No- vember 30, 2004, approximately 20 days after the crop was harvested on October 07, 2004. Soil samples, collected during the growing season and analysed for soil moisture and soil chemistry, were used for comparison with the model results. The two parame- ters (α and β) in Campbell’s equation [20] were slightly adjusted to achieve a reasonable agreement between the observed and predicted soil moisture content and salinity profiles. The comparison between the observed and pre- dicted soil moisture content at three dates; April 27, 2004, July 12, 2004 and October 08, 2004 shows that the agreement between observed and predicted soil moisture was reasonable except in the top layers of the soil profile where the model over-predicted the soil moisture content (Figure 4). The Willmott’s d-index [35], a measure of the degree of agreement between the observed and pre- dicted values, was above 0.5. Given the inherent diffi- culty in estimating the soil retention properties in various layers by either using Campbell’s equation or various regression equations, this level of agreement between the observed and predicted water content was viewed as suf- ficiently accurate for simulating the soil moisture in vari- ous irrigation management scenarios. The predicted soil profile electrical conductivity (EC) at the predicted moisture content was converted to ECe (electrical conductivity of the saturated paste extract) based on field and saturated water content [36] for a meaningful comparison with the observed ECe. The ECe will be termed as EC hereafter for simplicity. The LEACHC tends to under predict reactive ions according to [7] and [8]. For this reason the comparison of the ob- served and modelled reactive ions was not included in the study. Comparison of the observed and predicted soil profile EC at three different dates shows that the agree- ment between the observed and predicted EC was good except in one layer located just below the middle of the soil profile where it was under-predicted by the model (Figure 5). There was an unusual sudden increase Table 8. Major ions used as initial chemical composition of the soil profile for CUM55 site (Sugarcane crop). Major ions (mg / L) Depth (mm) Na Mg S Cl K Ca HCO3 pH 0-100 4.9 2.6 18.0 336 0.2 3.1 80.0 7.4 100-200 3.4 3.2 18.0 324 0.1 4.1 27.4 7.0 200-400 5.1 5.1 21.4 558 0.1 7.8 45.8 6.8 400-800 8.8 7.8 37.2 854 0.1 12.1 56.1 7.0 800-1100 14.4 10.2 48.1 1230 0.2 14.3 70.8 7.2 1100-1400 16.3 11.9 54.8 1418 0.2 17.0 95.2 7.7 1400-1700 9.3 4.7 29.5 678 0.2 6.4 80.2 7.5 1700-2000 30.7 13.6 78.1 2037 0.3 20.4 98.7 7.6 Copyright © 2010 SciRes. NR 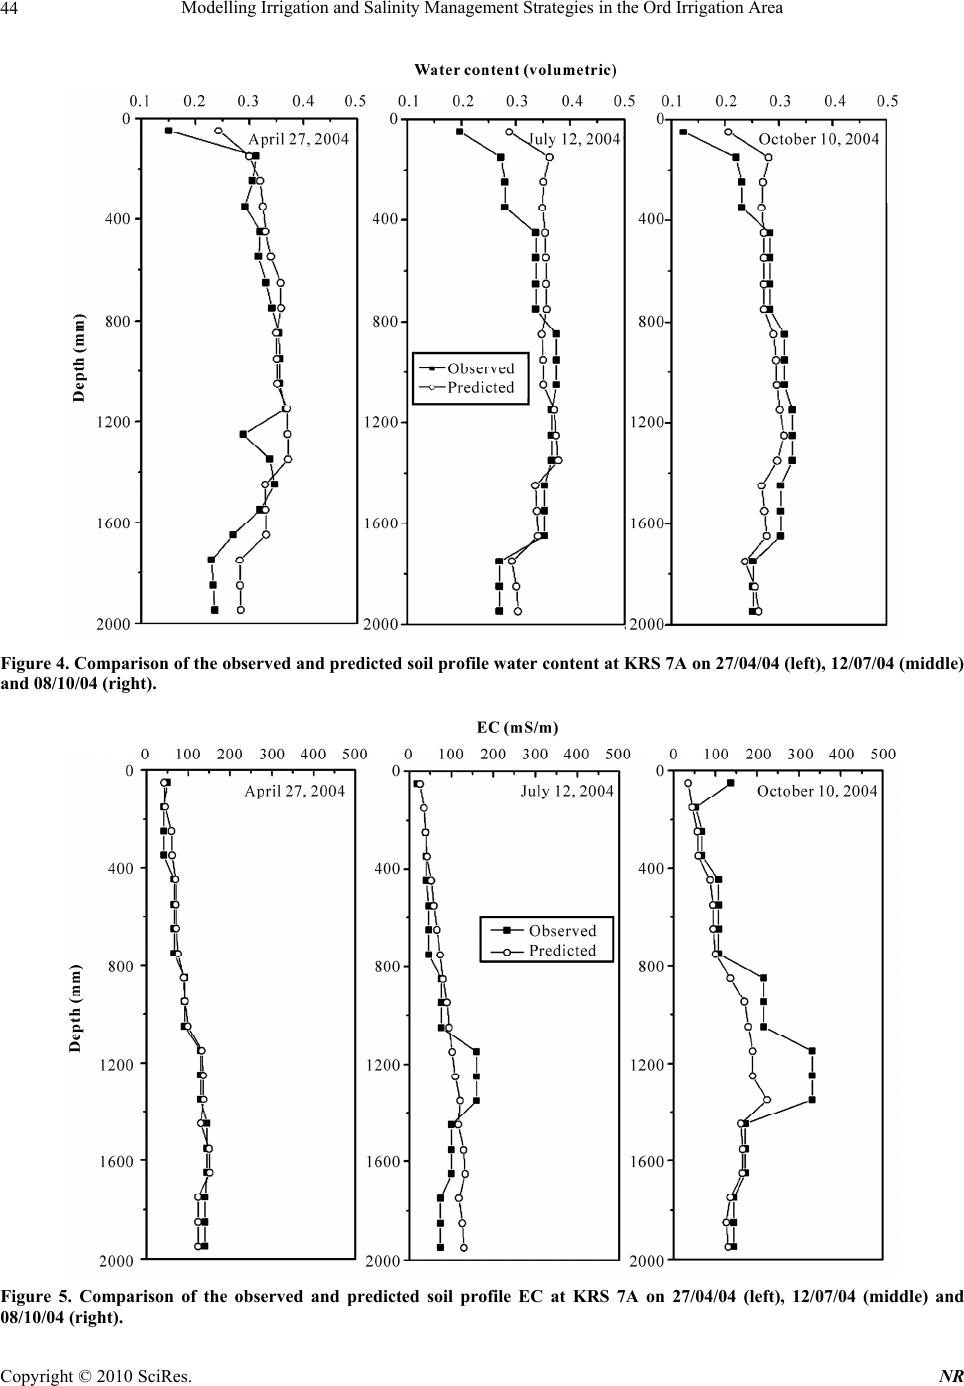 Modelling Irrigation and Salinity Management Strategies in the Ord Irrigation Area 44 Figure 4. Comparison of the observed and predicted soil profile water content at KRS 7A on 27/04/04 (left), 12/07/04 (middle) and 08/10/04 (right). Figure 5. Comparison of the observed and predicted soil profile EC at KRS 7A on 27/04/04 (left), 12/07/04 (middle) and 8/10/04 (right). 0 Copyright © 2010 SciRes. NR 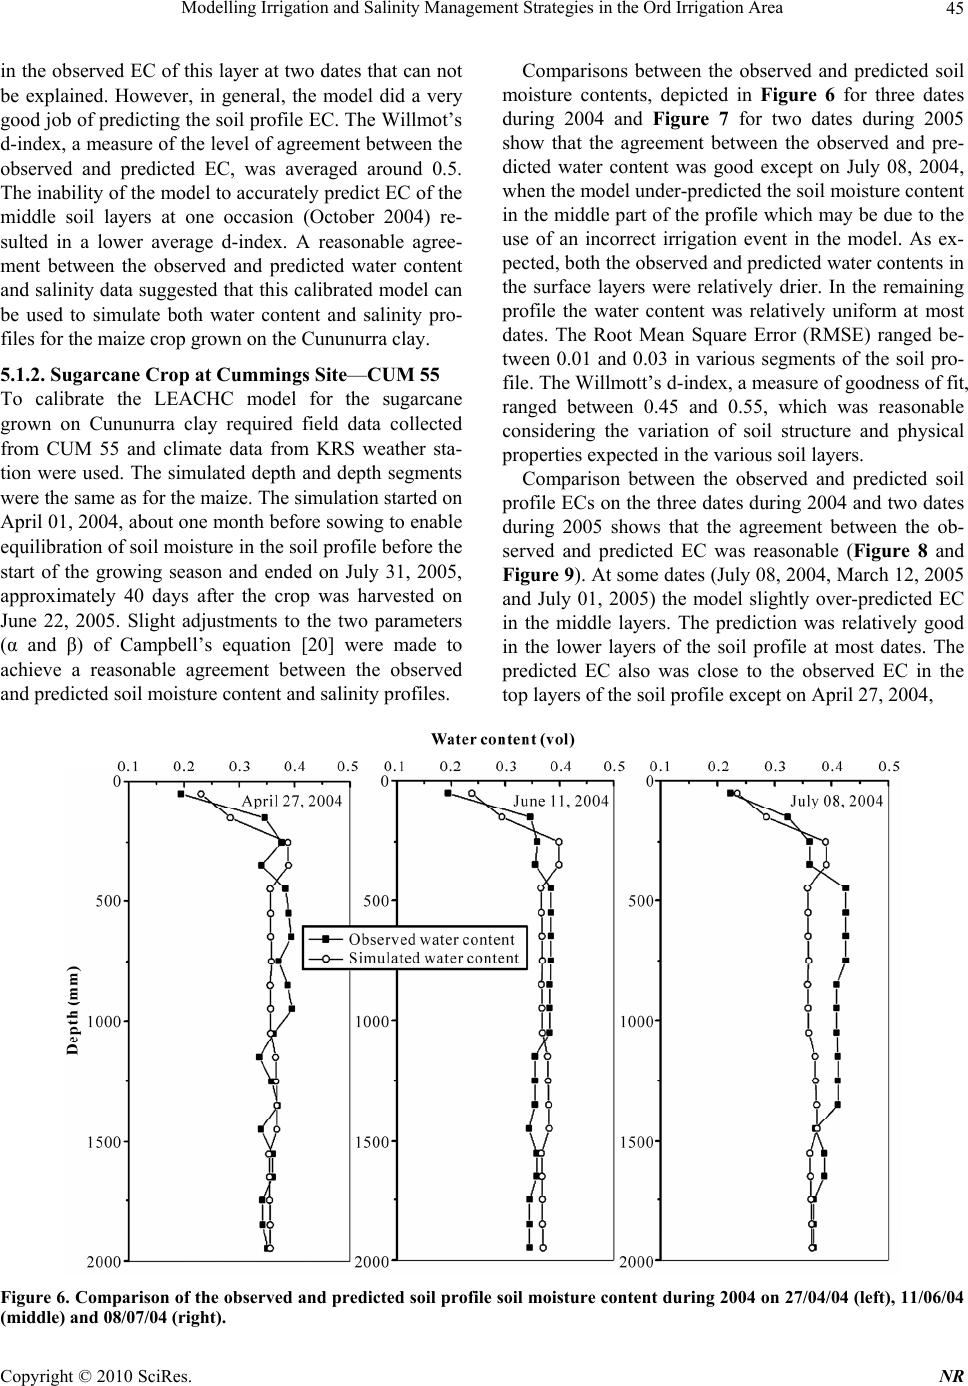 Modelling Irrigation and Salinity Management Strategies in the Ord Irrigation Area Copyright © 2010 SciRes. NR 45 Comparisons between the observed and predicted soil moisture contents, depicted in Figure 6 for three dates during 2004 and Figure 7 for two dates during 2005 show that the agreement between the observed and pre- dicted water content was good except on July 08, 2004, when the model under-predicted the soil moisture content in the middle part of the profile which may be due to the use of an incorrect irrigation event in the model. As ex- pected, both the observed and predicted water contents in the surface layers were relatively drier. In the remaining profile the water content was relatively uniform at most dates. The Root Mean Square Error (RMSE) ranged be- tween 0.01 and 0.03 in various segments of the soil pro- file. The Willmott’s d-index, a measure of goodness of fit, ranged between 0.45 and 0.55, which was reasonable considering the variation of soil structure and physical properties expected in the various soil layers. in the observed EC of this layer at two dates that can not be explained. However, in general, the model did a very good job of predicting the soil profile EC. The Willmot’s d-index, a measure of the level of agreement between the observed and predicted EC, was averaged around 0.5. The inability of the model to accurately predict EC of the middle soil layers at one occasion (October 2004) re- sulted in a lower average d-index. A reasonable agree- ment between the observed and predicted water content and salinity data suggested that this calibrated model can be used to simulate both water content and salinity pro- files for the maize crop grown on the Cununurra clay. 5.1.2. Su ga rcane Crop at Cummings Site—CUM 55 To calibrate the LEACHC model for the sugarcane grown on Cununurra clay required field data collected from CUM 55 and climate data from KRS weather sta- tion were used. The simulated depth and depth segments were the same as for the maize. The simulation started on April 01, 2004, about one month before sowing to enable equilibration of soil moisture in the soil profile before the start of the growing season and ended on July 31, 2005, approximately 40 days after the crop was harvested on June 22, 2005. Slight adjustments to the two parameters (α and β) of Campbell’s equation [20] were made to achieve a reasonable agreement between the observed and predicted soil moisture content and salinity profiles. Comparison between the observed and predicted soil profile ECs on the three dates during 2004 and two dates during 2005 shows that the agreement between the ob- served and predicted EC was reasonable (Figure 8 and Figure 9). At some dates (July 08, 2004, March 12, 2005 and July 01, 2005) the model slightly over-predicted EC in the middle layers. The prediction was relatively good in the lower layers of the soil profile at most dates. The predicted EC also was close to the observed EC in the top layers of the soil profile except on April 27, 2004, Figure 6. Comparison of the observed and predicted soil profile soil moisture content during 2004 on 27/04/04 (left), 11/06/04 (middle) and 08/07/04 (right).  Modelling Irrigation and Salinity Management Strategies in the Ord Irrigation Area 46 Figure 7. Comparison of the observed and predicted soil moisture content of the soil profile at CUM 55 on 12/03/05 (left) and 01/07/05 (right). Figure 8. Comparison of the observed and predicted soil profile EC at CUM 55 on 27/04/04 (left), 11/06/04 (middle) and 08/07/04 (right). Copyright © 2010 SciRes. NR 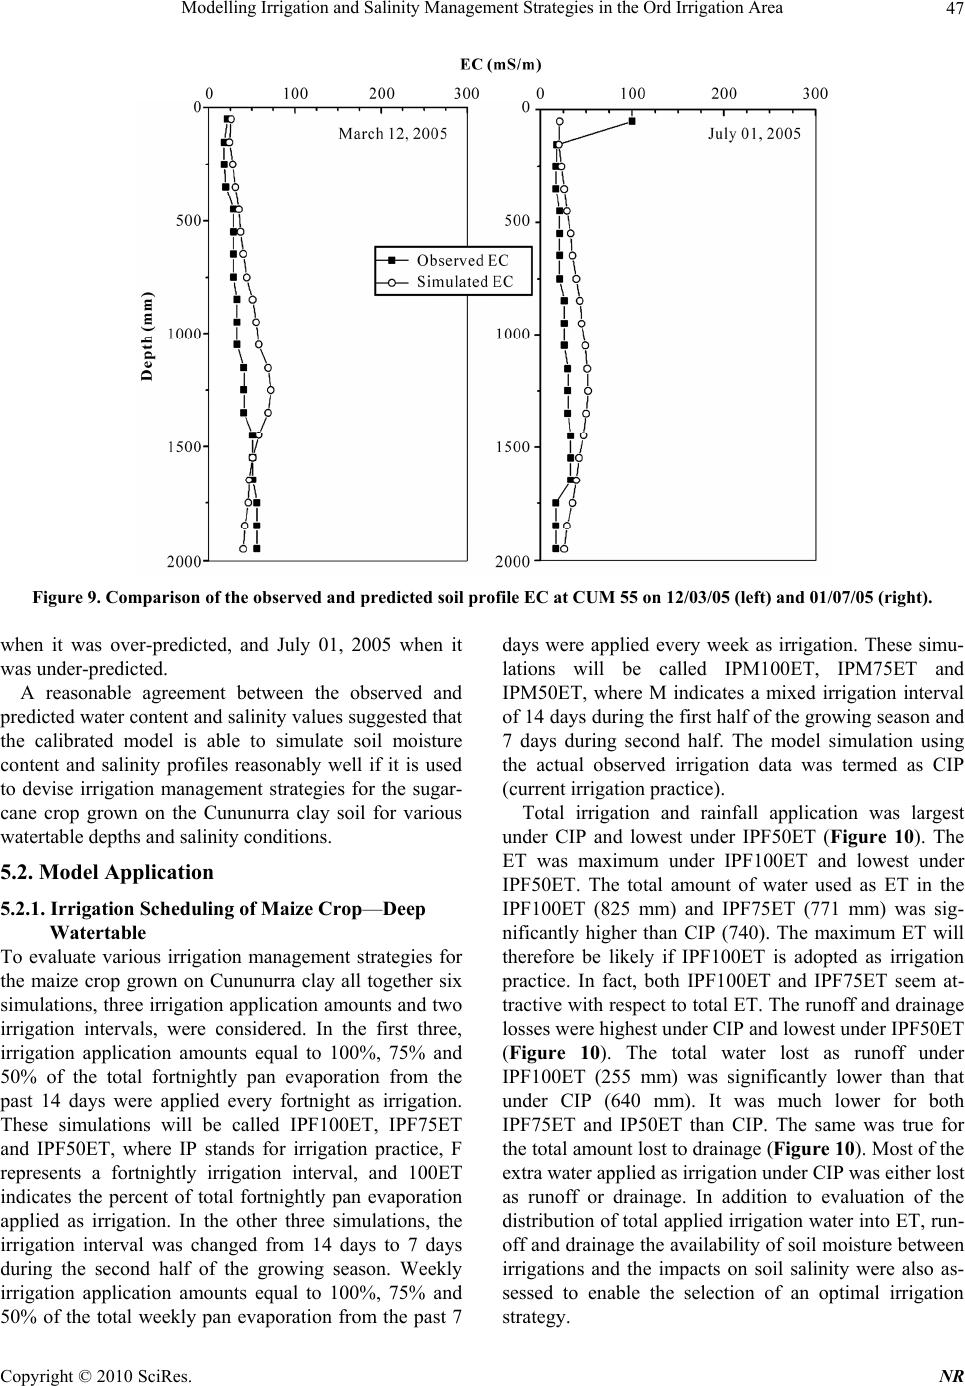 Modelling Irrigation and Salinity Management Strategies in the Ord Irrigation Area Copyright © 2010 SciRes. NR 47 Figure 9. Comparison of the observed and predicted soil profile EC at CUM 55 on 12/03/05 (left) and 01/07/05 (right). when it was over-predicted, and July 01, 2005 when it was under-predicted. A reasonable agreement between the observed and predicted water content and salinity values suggested that the calibrated model is able to simulate soil moisture content and salinity profiles reasonably well if it is used to devise irrigation management strategies for the sugar- cane crop grown on the Cununurra clay soil for various watertable depths and salinity conditions. 5.2. Model Application 5.2.1. Irrigation Scheduling of Maize Crop—Deep Watertable To evaluate various irrigation management strategies for the maize crop grown on Cununurra clay all together six simulations, three irrigation application amounts and two irrigation intervals, were considered. In the first three, irrigation application amounts equal to 100%, 75% and 50% of the total fortnightly pan evaporation from the past 14 days were applied every fortnight as irrigation. These simulations will be called IPF100ET, IPF75ET and IPF50ET, where IP stands for irrigation practice, F represents a fortnightly irrigation interval, and 100ET indicates the percent of total fortnightly pan evaporation applied as irrigation. In the other three simulations, the irrigation interval was changed from 14 days to 7 days during the second half of the growing season. Weekly irrigation application amounts equal to 100%, 75% and 50% of the total weekly pan evaporation from the past 7 days were applied every week as irrigation. These simu- lations will be called IPM100ET, IPM75ET and IPM50ET, where M indicates a mixed irrigation interval of 14 days during the first half of the growing season and 7 days during second half. The model simulation using the actual observed irrigation data was termed as CIP (current irrigation practice). Total irrigation and rainfall application was largest under CIP and lowest under IPF50ET (Figure 10). The ET was maximum under IPF100ET and lowest under IPF50ET. The total amount of water used as ET in the IPF100ET (825 mm) and IPF75ET (771 mm) was sig- nificantly higher than CIP (740). The maximum ET will therefore be likely if IPF100ET is adopted as irrigation practice. In fact, both IPF100ET and IPF75ET seem at- tractive with respect to total ET. The runoff and drainage losses were highest under CIP and lowest under IPF50ET (Figure 10). The total water lost as runoff under IPF100ET (255 mm) was significantly lower than that under CIP (640 mm). It was much lower for both IPF75ET and IP50ET than CIP. The same was true for the total amount lost to drainage (Figure 10). Most of the extra water applied as irrigation under CIP was either lost as runoff or drainage. In addition to evaluation of the distribution of total applied irrigation water into ET, run- off and drainage the availability of soil moisture between irrigations and the impacts on soil salinity were also as- sessed to enable the selection of an optimal irrigation strategy. 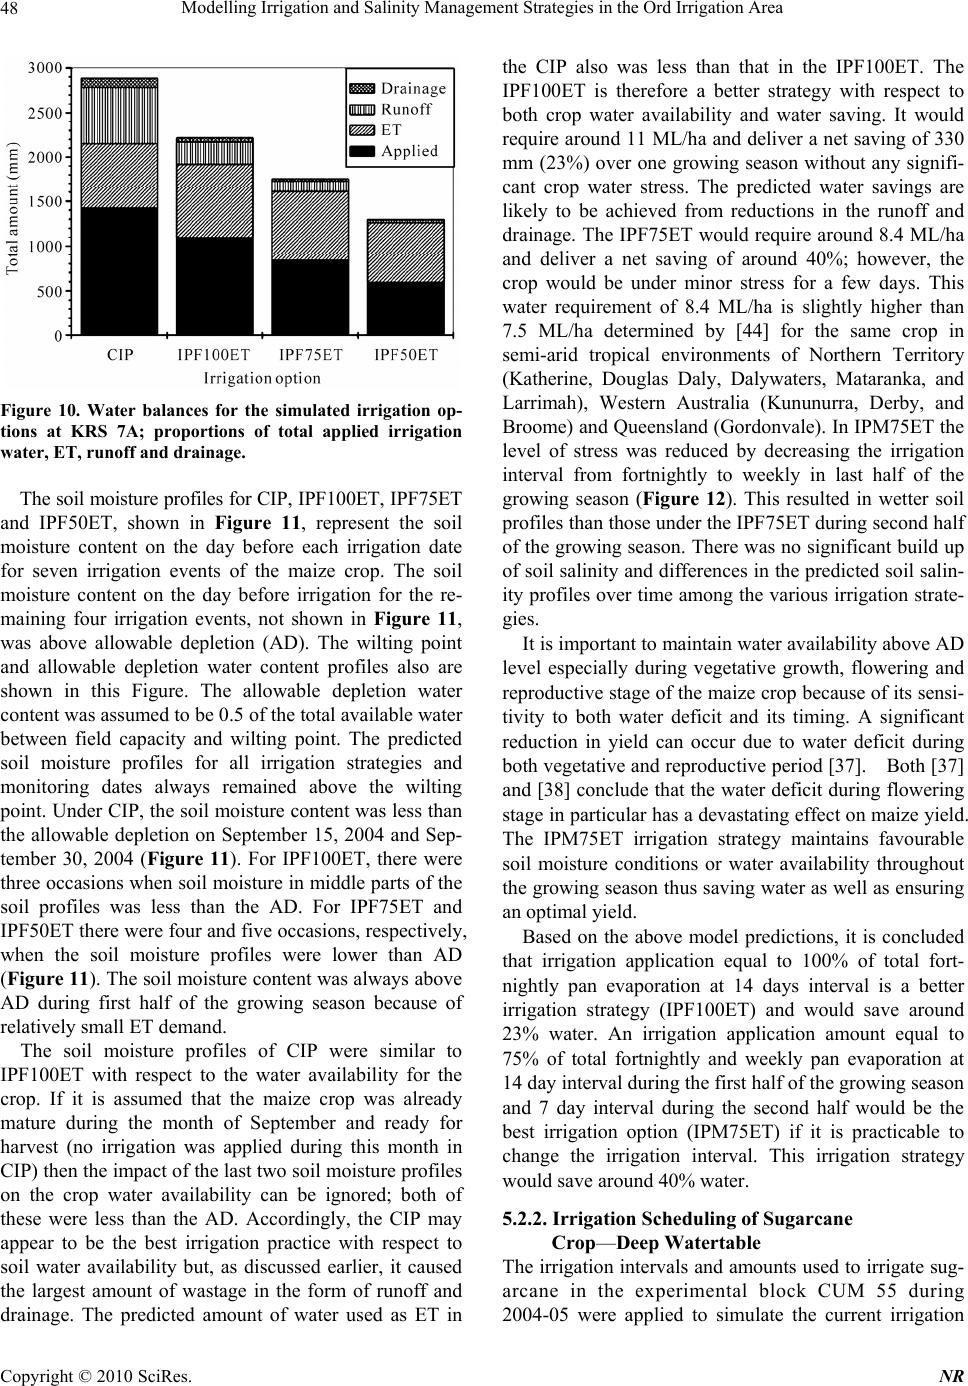 Modelling Irrigation and Salinity Management Strategies in the Ord Irrigation Area 48 Figure 10. Water balances for the simulated irrigation op- tions at KRS 7A; proportions of total applied irrigation water, ET, runoff and drainage. The soil moisture profiles for CIP, IPF100ET, IPF75ET and IPF50ET, shown in Figure 11, represent the soil moisture content on the day before each irrigation date for seven irrigation events of the maize crop. The soil moisture content on the day before irrigation for the re- maining four irrigation events, not shown in Figure 11, was above allowable depletion (AD). The wilting point and allowable depletion water content profiles also are shown in this Figure. The allowable depletion water content was assumed to be 0.5 of the total available water between field capacity and wilting point. The predicted soil moisture profiles for all irrigation strategies and monitoring dates always remained above the wilting point. Under CIP, the soil moisture content was less than the allowable depletion on September 15, 2004 and Sep- tember 30, 2004 (Figure 11). For IPF100ET, there were three occasions when soil moisture in middle parts of the soil profiles was less than the AD. For IPF75ET and IPF50ET there were four and five occasions, respectively, when the soil moisture profiles were lower than AD (Figure 11). The soil moisture content was always above AD during first half of the growing season because of relatively small ET demand. The soil moisture profiles of CIP were similar to IPF100ET with respect to the water availability for the crop. If it is assumed that the maize crop was already mature during the month of September and ready for harvest (no irrigation was applied during this month in CIP) then the impact of the last two soil moisture profiles on the crop water availability can be ignored; both of these were less than the AD. Accordingly, the CIP may appear to be the best irrigation practice with respect to soil water availability but, as discussed earlier, it caused the largest amount of wastage in the form of runoff and drainage. The predicted amount of water used as ET in the CIP also was less than that in the IPF100ET. The IPF100ET is therefore a better strategy with respect to both crop water availability and water saving. It would require around 11 ML/ha and deliver a net saving of 330 mm (23%) over one growing season without any signifi- cant crop water stress. The predicted water savings are likely to be achieved from reductions in the runoff and drainage. The IPF75ET would require around 8.4 ML/ha and deliver a net saving of around 40%; however, the crop would be under minor stress for a few days. This water requirement of 8.4 ML/ha is slightly higher than 7.5 ML/ha determined by [44] for the same crop in semi-arid tropical environments of Northern Territory (Katherine, Douglas Daly, Dalywaters, Mataranka, and Larrimah), Western Australia (Kununurra, Derby, and Broome) and Queensland (Gordonvale). In IPM75ET the level of stress was reduced by decreasing the irrigation interval from fortnightly to weekly in last half of the growing season (Figure 12). This resulted in wetter soil profiles than those under the IPF75ET during second half of the growing season. There was no significant build up of soil salinity and differences in the predicted soil salin- ity profiles over time among the various irrigation strate- gies. It is important to maintain water availability above AD level especially during vegetative growth, flowering and reproductive stage of the maize crop because of its sensi- tivity to both water deficit and its timing. A significant reduction in yield can occur due to water deficit during both vegetative and reproductive period [37]. Both [37] and [38] conclude that the water deficit during flowering stage in particular has a devastating effect on maize yield. The IPM75ET irrigation strategy maintains favourable soil moisture conditions or water availability throughout the growing season thus saving water as well as ensuring an optimal yield. Based on the above model predictions, it is concluded that irrigation application equal to 100% of total fort- nightly pan evaporation at 14 days interval is a better irrigation strategy (IPF100ET) and would save around 23% water. An irrigation application amount equal to 75% of total fortnightly and weekly pan evaporation at 14 day interval during the first half of the growing season and 7 day interval during the second half would be the best irrigation option (IPM75ET) if it is practicable to change the irrigation interval. This irrigation strategy would save around 40% water. 5.2.2. Irrigation Scheduling of Sugarcane Crop—Deep Watertable The irrigation intervals and amounts used to irrigate sug- arcane in the experimental block CUM 55 during 2004-05 were applied to simulate the current irrigation Copyright © 2010 SciRes. NR 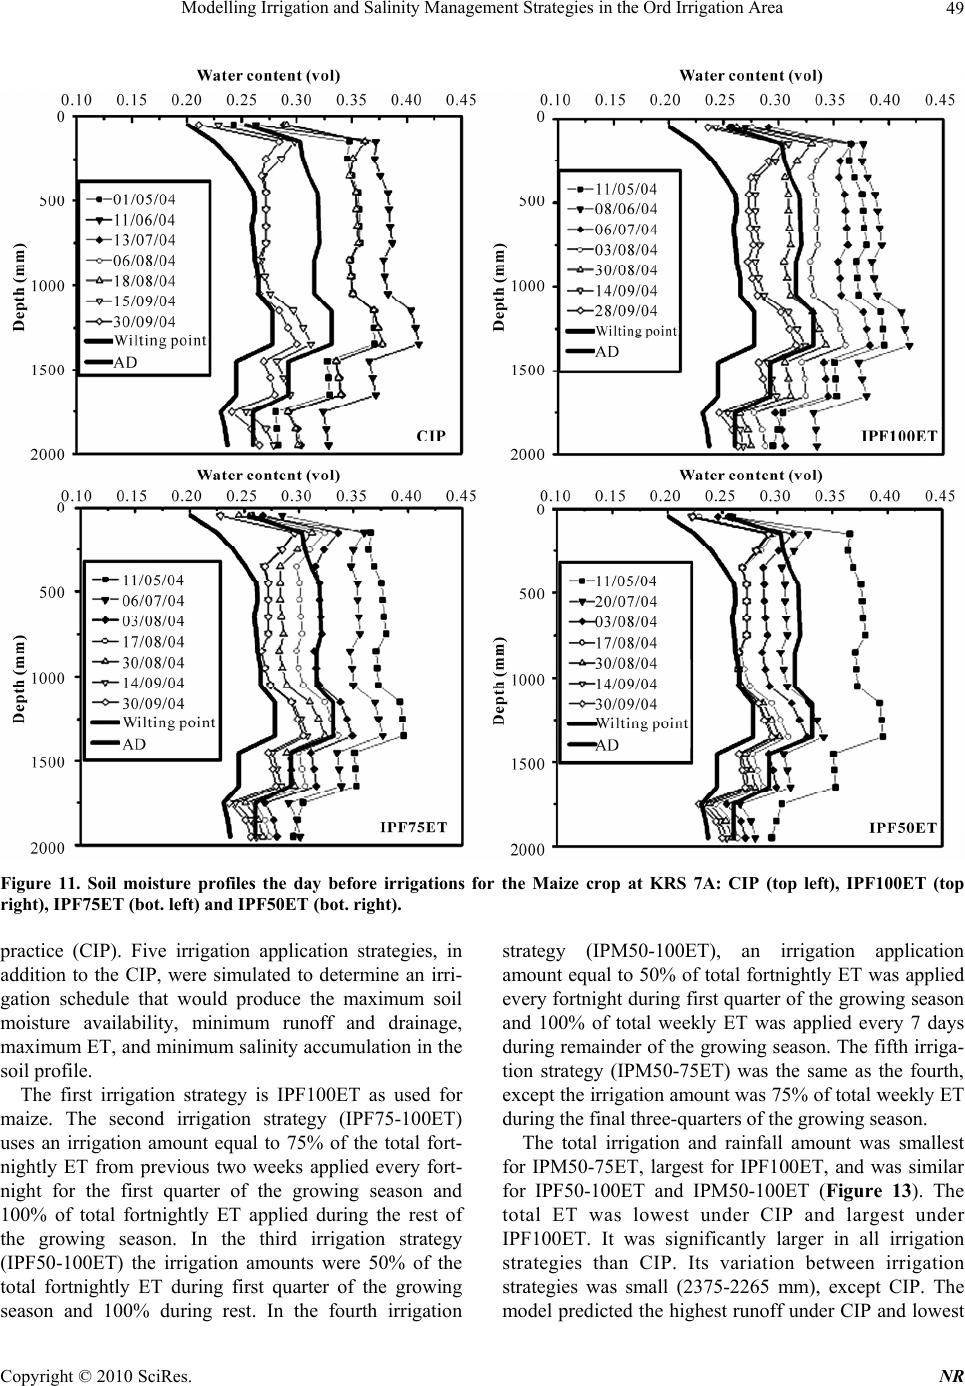 Modelling Irrigation and Salinity Management Strategies in the Ord Irrigation Area Copyright © 2010 SciRes. NR 49 Figure 11. Soil moisture profiles the day before irrigations for the Maize crop at KRS 7A: CIP (top left), IPF100ET (top right), IPF75ET (bot. left) and IPF50ET (bot. right). practice (CIP). Five irrigation application strategies, in addition to the CIP, were simulated to determine an irri- gation schedule that would produce the maximum soil moisture availability, minimum runoff and drainage, maximum ET, and minimum salinity accumulation in the soil profile. The first irrigation strategy is IPF100ET as used for maize. The second irrigation strategy (IPF75-100ET) uses an irrigation amount equal to 75% of the total fort- nightly ET from previous two weeks applied every fort- night for the first quarter of the growing season and 100% of total fortnightly ET applied during the rest of the growing season. In the third irrigation strategy (IPF50-100ET) the irrigation amounts were 50% of the total fortnightly ET during first quarter of the growing season and 100% during rest. In the fourth irrigation strategy (IPM50-100ET), an irrigation application amount equal to 50% of total fortnightly ET was applied every fortnight during first quarter of the growing season and 100% of total weekly ET was applied every 7 days during remainder of the growing season. The fifth irriga- tion strategy (IPM50-75ET) was the same as the fourth, except the irrigation amount was 75% of total weekly ET during the final three-quarters of the growing season. The total irrigation and rainfall amount was smallest for IPM50-75ET, largest for IPF100ET, and was similar for IPF50-100ET and IPM50-100ET (Figure 13). The total ET was lowest under CIP and largest under IPF100ET. It was significantly larger in all irrigation strategies than CIP. Its variation between irrigation strategies was small (2375-2265 mm), except CIP. The model predicted the highest runoff under CIP and lowest  Modelling Irrigation and Salinity Management Strategies in the Ord Irrigation Area 50 Figure12. Soil moisture profiles the day before IPM75ET irrigations for the Maize crop at KRS 7A. Figure 13. Water balances for the simulated irrigation op- tions at CUM 55; total applied irrigation amount, ET, run- off and drainage. under IPM50-75ET. The total drainage was largest under IPF100ET and lowest under IPM50-75ET. Considering total ET, runoff and drainage together, IPM50-100ET and IPM50-75ET gave the best results; both had compa- rable total ET and less runoff and drainage than CIP. Assessments of the soil moisture availability and salt accumulation in the root zone also are required to iden- tify the best irrigation strategy. The soil moisture profiles on the day before each irri- gation for CIP (Figure 14) show that there were only few dates when the soil moisture was above the allowable depletion level indicating that the sugarcane crop was under soil moisture stress. On some dates, the soil mois- ture was very close to the wilting point, and it is expected that the crop experienced moisture stress at least during Figure 14. Soil moisture profiles the day before CIP irriga- tions for the Sugarcane crop at CUM 55. these days. A small total ET under CIP also indicates that the crop was under moisture stress at least some days during the growing season. Neither the irrigation amounts nor the irrigation intervals were appropriate. The irrigation amounts were large, which resulted in ex- cessive runoff; and the irrigation intervals were too long, which resulted in soil moisture stress. Soil moisture stress or water deficits have varying ef- fects on sugarcane crop development, biomass accumu- lation and partitioning of biomass to millable stalk and sucrose, both during the season and at final harvest [39]. Water deficits during the tillering phase significantly affects leaf area, tillering and biomass accumulation but have relatively little effects on final yield. However wa- ter deficits, after the leaf area index is reached over 2, have more deleterious effects on final yield of total bio- mass, stalk biomass and stalk sucrose [39]. Therefore it is highly likely that the water deficit occurred during the growing season under CIP had significant impacts on final yield of sugarcane. The predicted soil moisture pro- files for the IPF100ET, IPF75-100ET, IPF50-100ET, IMP50-75ET were below AD level on some dates. The soil moisture profiles for IPM50-100ET, shown in Fig- ure 15, were always above the AD level, except one date. This irrigation strategy (IPM50-100ET) is recommended for the sugarcane crop grown on the Cununurra clay in the ORIA. This strategy ensures to maintain favourable soil moisture conditions throughout the growing season which is a prerequisite for the maximum crop productiv- ity. A total of about 2200 mm of water will be required for irrigation where crops are irrigated after half the soil water supply is depleted. Thi amount equates to about s Copyright © 2010 SciRes. NR 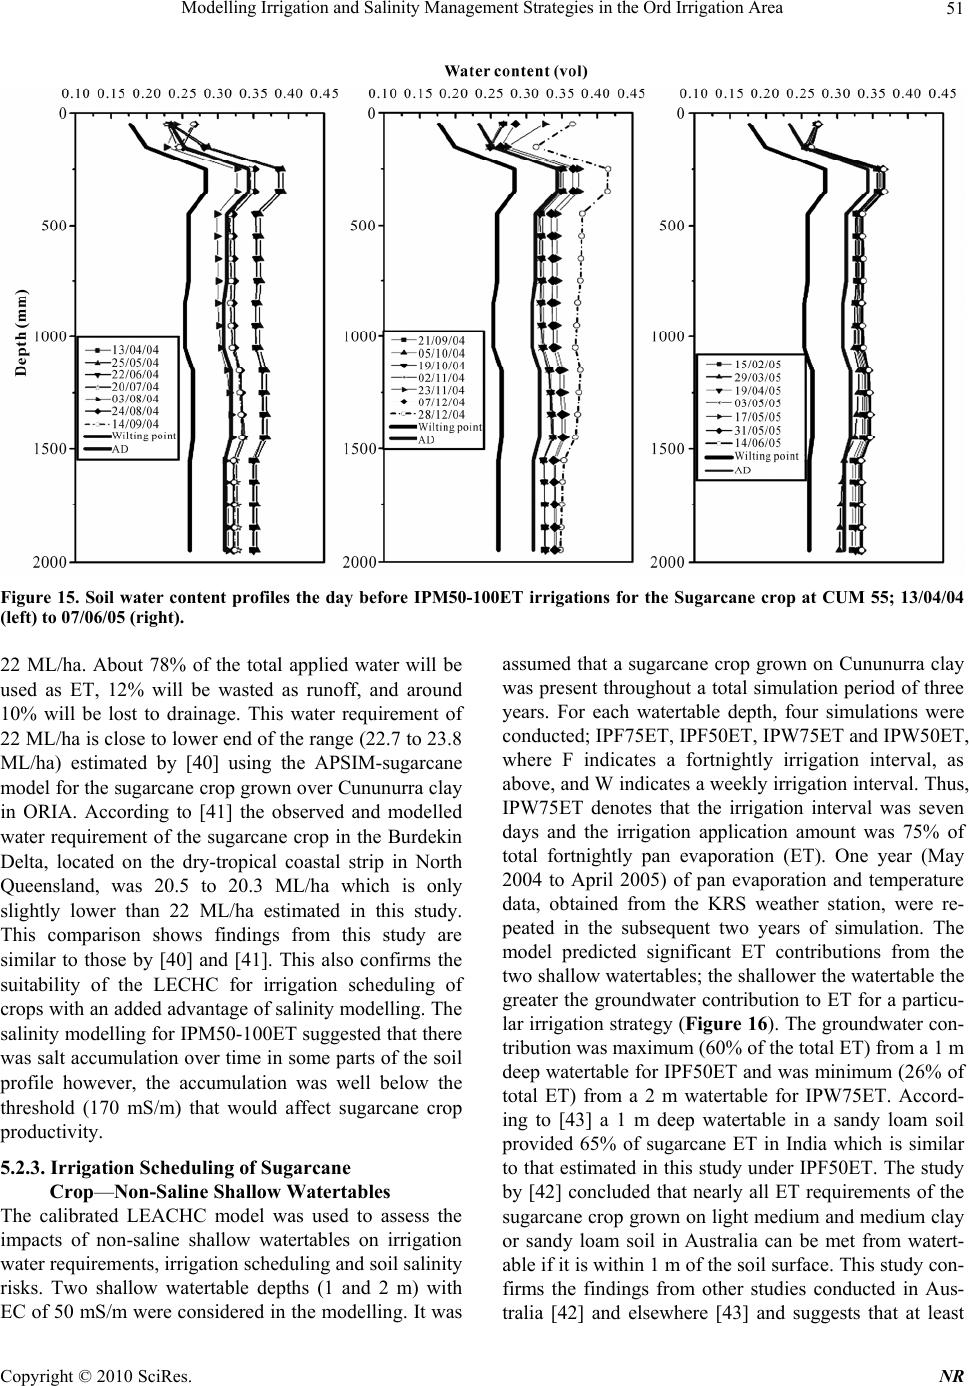 Modelling Irrigation and Salinity Management Strategies in the Ord Irrigation Area Copyright © 2010 SciRes. NR 51 Figure 15. Soil water content profiles the day before IPM50-100ET irrigations for the Sugarcane crop at CUM 55; 13/04/04 (left) to 07/06/05 (right). 22 ML/ha. About 78% of the total applied water will be used as ET, 12% will be wasted as runoff, and around 10% will be lost to drainage. This water requirement of 22 ML/ha is close to lower end of the range (22.7 to 23.8 ML/ha) estimated by [40] using the APSIM-sugarcane model for the sugarcane crop grown over Cununurra clay in ORIA. According to [41] the observed and modelled water requirement of the sugarcane crop in the Burdekin Delta, located on the dry-tropical coastal strip in North Queensland, was 20.5 to 20.3 ML/ha which is only slightly lower than 22 ML/ha estimated in this study. This comparison shows findings from this study are similar to those by [40] and [41]. This also confirms the suitability of the LECHC for irrigation scheduling of crops with an added advantage of salinity modelling. The salinity modelling for IPM50-100ET suggested that there was salt accumulation over time in some parts of the soil profile however, the accumulation was well below the threshold (170 mS/m) that would affect sugarcane crop productivity. 5.2.3. Irrigation Scheduling of Sugarcane Crop—Non-Saline Shallow Watertables The calibrated LEACHC model was used to assess the impacts of non-saline shallow watertables on irrigation water requirements, irrigation scheduling and soil salinity risks. Two shallow watertable depths (1 and 2 m) with EC of 50 mS/m were considered in the modelling. It was assumed that a sugarcane crop grown on Cununurra clay was present throughout a total simulation period of three years. For each watertable depth, four simulations were conducted; IPF75ET, IPF50ET, IPW75ET and IPW50ET, where F indicates a fortnightly irrigation interval, as above, and W indicates a weekly irrigation interval. Thus, IPW75ET denotes that the irrigation interval was seven days and the irrigation application amount was 75% of total fortnightly pan evaporation (ET). One year (May 2004 to April 2005) of pan evaporation and temperature data, obtained from the KRS weather station, were re- peated in the subsequent two years of simulation. The model predicted significant ET contributions from the two shallow watertables; the shallower the watertable the greater the groundwater contribution to ET for a particu- lar irrigation strategy (Figure 16). The groundwater con- tribution was maximum (60% of the total ET) from a 1 m deep watertable for IPF50ET and was minimum (26% of total ET) from a 2 m watertable for IPW75ET. Accord- ing to [43] a 1 m deep watertable in a sandy loam soil provided 65% of sugarcane ET in India which is similar to that estimated in this study under IPF50ET. The study by [42] concluded that nearly all ET requirements of the sugarcane crop grown on light medium and medium clay or sandy loam soil in Australia can be met from watert- able if it is within 1 m of the soil surface. This study con- firms the findings from other studies conducted in Aus- tralia [42] and elsewhere [43] and suggests that at least 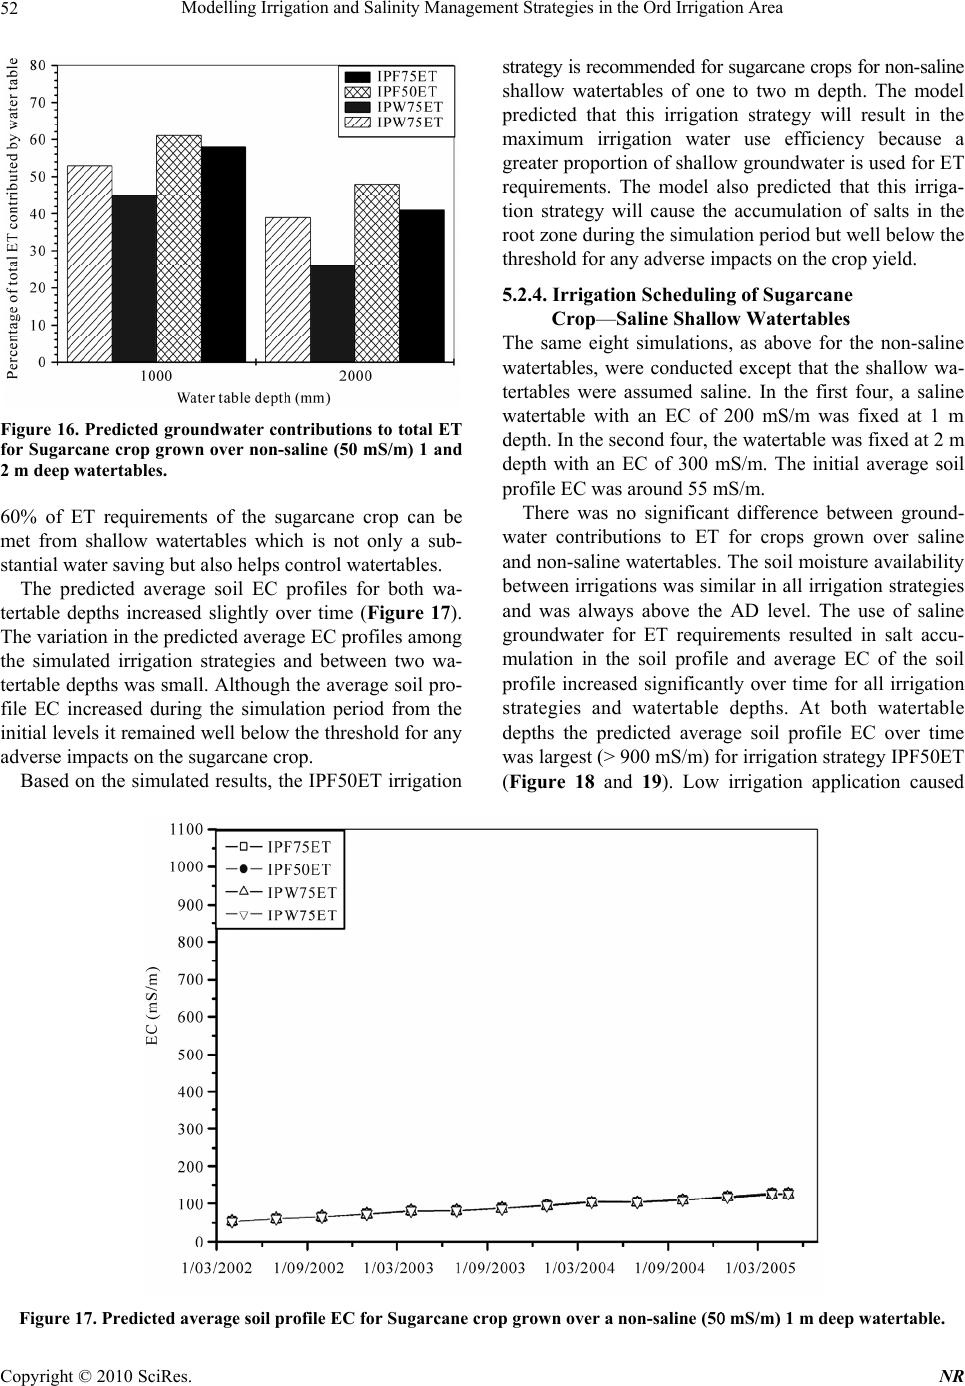 Modelling Irrigation and Salinity Management Strategies in the Ord Irrigation Area 52 Figure 16. Predicted groundw ater contributions to total ET for Sugarcane crop grown over non-saline (50 mS/m) 1 and 2 m deep watertables. 60% of ET requirements of the sugarcane crop can be met from shallow watertables which is not only a sub- stantial water saving but also helps control watertables. The predicted average soil EC profiles for both wa- tertable depths increased slightly over time (Figure 17). The variation in the predicted average EC profiles among the simulated irrigation strategies and between two wa- tertable depths was small. Although the average soil pro- file EC increased during the simulation period from the initial levels it remained well below the threshold for any adverse impacts on the sugarcane crop. Based on the simulated results, the IPF50ET irrigation strategy is recommended for sugarcane crops for non-saline shallow watertables of one to two m depth. The model predicted that this irrigation strategy will result in the maximum irrigation water use efficiency because a greater proportion of shallow groundwater is used for ET requirements. The model also predicted that this irriga- tion strategy will cause the accumulation of salts in the root zone during the simulation period but well below the threshold for any adverse impacts on the crop yield. 5.2.4. Irrigation Scheduling of Sugarcane Crop—Saline Shallow Watertables The same eight simulations, as above for the non-saline watertables, were conducted except that the shallow wa- tertables were assumed saline. In the first four, a saline watertable with an EC of 200 mS/m was fixed at 1 m depth. In the second four, the watertable was fixed at 2 m depth with an EC of 300 mS/m. The initial average soil profile EC was around 55 mS/m. There was no significant difference between ground- water contributions to ET for crops grown over saline and non-saline watertables. The soil moisture availability between irrigations was similar in all irrigation strategies and was always above the AD level. The use of saline groundwater for ET requirements resulted in salt accu- mulation in the soil profile and average EC of the soil profile increased significantly over time for all irrigation strategies and watertable depths. At both watertable depths the predicted average soil profile EC over time was largest (> 900 mS/m) for irrigation strategy IPF50ET (Figure 18 and 19). Low irrigation application caused Figure 17. Predicted average soil profile EC for Sugarcane crop gr own over a non-saline (50 mS/m) 1 m deep watertable. Copyright © 2010 SciRes. NR  Modelling Irrigation and Salinity Management Strategies in the Ord Irrigation Area53 Figure 18. Predicted average soil profile EC for Sugarcane crop grown over a saline (200 mS/m) 1 m deep watertable. Figure 19. Predicted average soil profile EC for Sugarcane crop grown over a saline (300 mS/m) 2 m deep watertable. withdrawal of more water from the watertable which resulted in the highest average soil profile EC over time. The lowest average soil profile EC (> 500 mS/m) re- sulted from IPW75ET at both watertable depths but it was well above the level tolerable by the sugarcane crop. In summary, the modelling suggests that the soil pro- file salinity risk will be high if a saline watertable exists for long periods at or above 2 m depth which is consis- tent with an earlier finding by [8]. Over irrigations may reduce the build up of soil profile salinity through flush- ing but it will result in excessive accessions to the wa- tertable causing groundwater to rise even further. The recommended management strategy for a saline shallow watertable is to lower its level below 2 m by artificial deep open or sub-surface drainage first and then apply regular leaching applications to flush excessive salts from the root zone area into the drainage system [8]. Without this intervention, it is likely that high evapora- tive demands, extended fallow periods and low irrigation application will cause excessive accumulation of salts in the soil profile. 5.3. Application of Recommended Irrigation Strategies This study identified irrigation strategies that ensure effi- cient water use, optimal crop water availability and mini- Copyright © 2010 SciRes. NR  Modelling Irrigation and Salinity Management Strategies in the Ord Irrigation Area 54 mal salinity risks for the maize and sugarcane crops in the ORIA. The practical application and feasibility of the recommended irrigation strategies including irrigation intervals and their variation within a growing season were confirmed through discussions with the Ord Irriga- tion Cooperative and farming community. New irrigation areas are being developed under Ord Stage 2, adjacent to the existing Stage 1 irrigation area, where large areas are likely to be allocated for sugarcane. Because of similar climate, soil and other conditions, the irrigation strategies identified for the sugarcane crop in the Stage 1 area will be applicable to this crop to be grown in Stage 2 area. Also because the Ord Stage 2 is largely a closed ground- water flow system it will be even more important to con- trol deep drainage in this area. Any deep drainage in ex- cess of irrigation requirements is likely to cause a rise in groundwater levels and increase the risk of soil salinity development. Water resource availability for irrigation of the exist- ing and new irrigated areas in the Ord is not likely to be a major issue as enough water resource is expected to be available to meet the current and likely future water de- mands by the irrigation industry. The practical applica- tion of the preferred irrigation techniques is therefore less important with respect to water saving in the ORIA and more important for achieving an optimal yield and con- trolling or reducing deep drainage especially under Ord Stage 2 to avoid the development of shallow watertables and soil salinity. An inefficient irrigation strategy that allows excessive deep drainage in Ord Stage 2 in par- ticular will necessitate the installation of subsurface drainage systems to control rising watertables if crop productivity is to be maintained. Such drainage installa- tions, whether open deep drains or subsurface systems often require significant investments and have associated problems of safe disposal of drainage waters. The irrigation water requirements assessed using LEACHC were compared with findings from other stud- ies to test the applicability of the LEACHC model for irrigation scheduling and salinity management and ex- tending the results to other regions in Australia. The wa- ter requirements assessed in this study were similar to those of the maize crop estimated by [44] at Kununurra (Ord), Derby and Broome in Western Australia; Kathe- rine, Douglas Daly, Dalywaters, Mataranka, and Larri- mah in Northern Territory; and Gordonvale in Queen- sland. This confirms both the applicability of these find- ings to other regions of Australia and the suitability of LEACHC for such a purpose. Similarly the sugarcane water requirements of 20.5 ML/ha to 23 ML/ha deter- mined by [40] in the Ord and by [41] in the Burdekin Delta are similar to the water requirements of 22 ML/ha determined here. It means that the water requirements of the maize and sugarcane crops are similar in the Austra- lian semi-arid tropical environments and therefore the irrigation water requirements determined in this study are applicable in these other environments of Australia. 6. Conclusions This study found that the irrigation application amounts equal to 100% of the total fortnightly pan evaporation, applied at 14 days interval, would be a better irrigation strategy for maize crop grown on Cununurra clay over a deep watertable. The predicted irrigation water use would be around 23% less than the exiting practice. Irri- gation application amounts equal to 75% of the total fortnightly pan evaporation, applied every fortnight dur- ing first half of the growing season, and 75% of the total weekly pan evaporation, applied every week during the second half of the growing season, would be the best irrigation strategy if it is feasible to change the irrigation interval from 14 days to 7 days. The irrigation water use for this irrigation strategy was predicted to be around 40% less than the existing irrigation practice. The study found that the best irrigation strategy for the sugarcane crop grown on Cununurra clay over a deep watertable would be irrigation application amounts equal to 50% of the total fortnightly pan evaporation, applied every fortnight during first quarter of the growing season, and irrigation application amounts equal to 100% of total weekly pan evaporation, applied every week during rest of the season. This irrigation strategy would require around 22 ML/ha of irrigation water for a single sugar- cane crop. The best irrigation strategy for the sugarcane crop grown over a non-saline shallow watertable of ≤ 2 m depth would be irrigation application amounts equal to 50% of the total bi-weekly pan evaporation, applied every 14 days. The model predicted that this irrigation strategy would result in the best water use efficiency by encouraging plants to use groundwater to meet the crop ET requirements. The modelling results indicated that the soil salinity risks would be high if the sugarcane crop was grown for long periods over a saline shallow wa- tertable (≤ 2 m). The best management strategy would be to lower the watertable below 2 m depth by artificial drainage first and then apply regular leaching applica- tions to flush excessive salts into the drainage system. 7. Acknowledgements This research was undertaken as a partnership between the Department of Agriculture and Food, Western Aus- tralian (DAFWA) and CSIRO Land and Water. Project funding was provided by the Australian Government and the Government of Western Australia through the Na- tional Action Plan for Salinity and Water Quality project Copyright © 2010 SciRes. NR 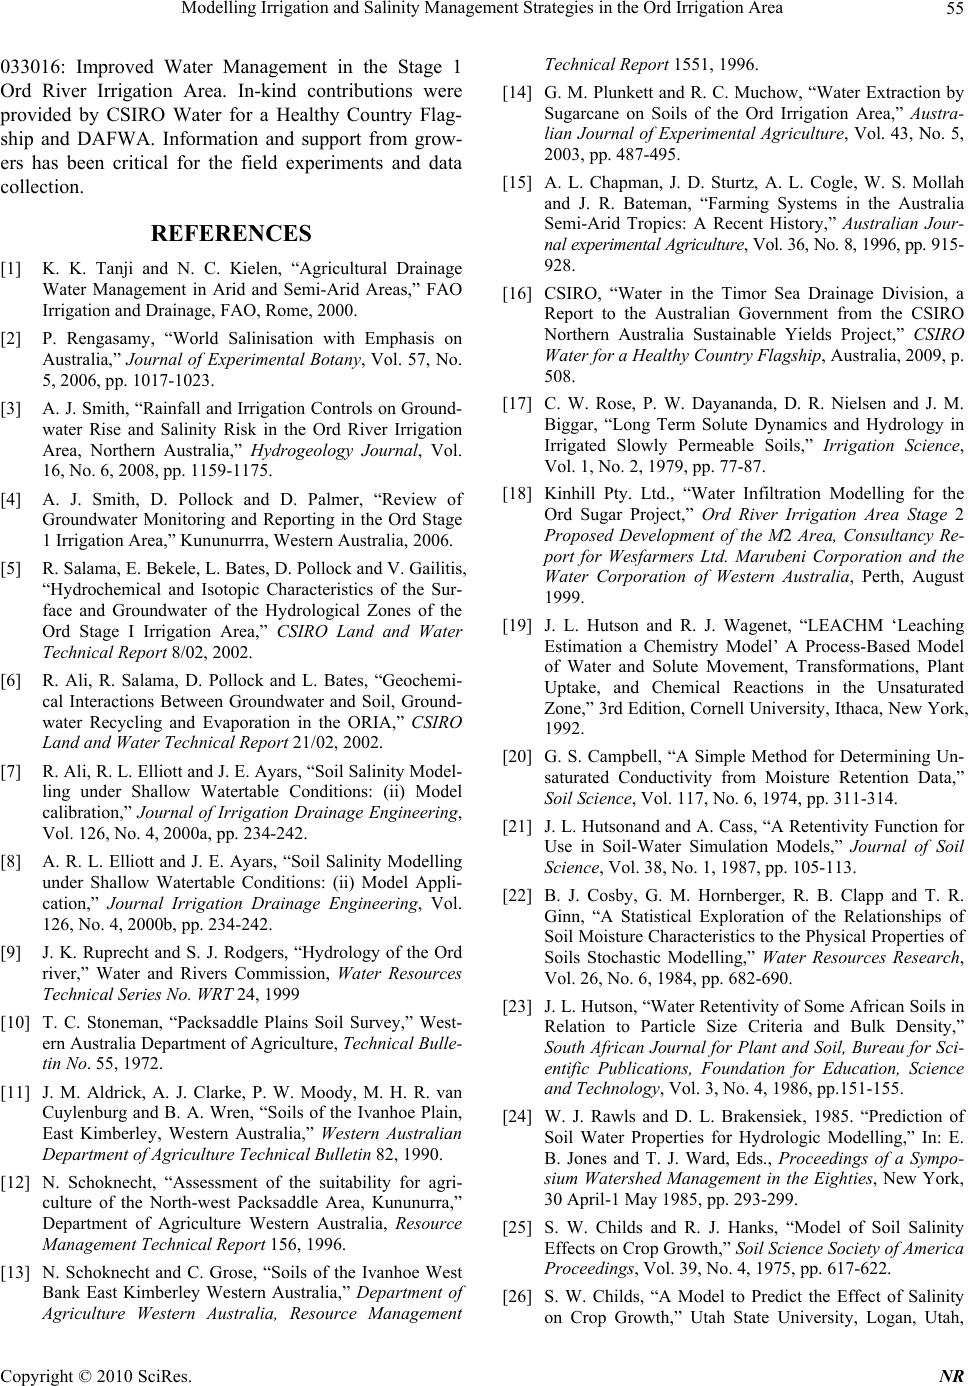 Modelling Irrigation and Salinity Management Strategies in the Ord Irrigation Area55 033016: Improved Water Management in the Stage 1 Ord River Irrigation Area. In-kind contributions were provided by CSIRO Water for a Healthy Country Flag- ship and DAFWA. Information and support from grow- ers has been critical for the field experiments and data collection. REFERENCES [1] K. K. Tanji and N. C. Kielen, “Agricultural Drainage Water Management in Arid and Semi-Arid Areas,” FAO Irrigation and Drainage, FAO, Rome, 2000. [2] P. Rengasamy, “World Salinisation with Emphasis on Australia,” Journal of Experimental Botany, Vol. 57, No. 5, 2006, pp. 1017-1023. [3] A. J. Smith, “Rainfall and Irrigation Controls on Ground- water Rise and Salinity Risk in the Ord River Irrigation Area, Northern Australia,” Hydrogeology Journal, Vol. 16, No. 6, 2008, pp. 1159-1175. [4] A. J. Smith, D. Pollock and D. Palmer, “Review of Groundwater Monitoring and Reporting in the Ord Stage 1 Irrigation Area,” Kununurrra, Western Australia, 2006. [5] R. Salama, E. Bekele, L. Bates, D. Pollock and V. Gailitis, “Hydrochemical and Isotopic Characteristics of the Sur- face and Groundwater of the Hydrological Zones of the Ord Stage I Irrigation Area,” CSIRO Land and Water Technical Report 8/02, 2002. [6] R. Ali, R. Salama, D. Pollock and L. Bates, “Geochemi- cal Interactions Between Groundwater and Soil, Ground- water Recycling and Evaporation in the ORIA,” CSIRO Land and Water Technical Report 21/02, 2002. [7] R. Ali, R. L. Elliott and J. E. Ayars, “Soil Salinity Model- ling under Shallow Watertable Conditions: (ii) Model calibration,” Journal of Irrigation Drainage Engineering, Vol. 126, No. 4, 2000a, pp. 234-242. [8] A. R. L. Elliott and J. E. Ayars, “Soil Salinity Modelling under Shallow Watertable Conditions: (ii) Model Appli- cation,” Journal Irrigation Drainage Engineering, Vol. 126, No. 4, 2000b, pp. 234-242. [9] J. K. Ruprecht and S. J. Rodgers, “Hydrology of the Ord river,” Water and Rivers Commission, Water Resources Technical Series No. WRT 24, 1999 [10] T. C. Stoneman, “Packsaddle Plains Soil Survey,” West- ern Australia Department of Agriculture, Technical Bulle- tin No. 55, 1972. [11] J. M. Aldrick, A. J. Clarke, P. W. Moody, M. H. R. van Cuylenburg and B. A. Wren, “Soils of the Ivanhoe Plain, East Kimberley, Western Australia,” Western Australian Department of Agriculture Technical Bulletin 82, 1990. [12] N. Schoknecht, “Assessment of the suitability for agri- culture of the North-west Packsaddle Area, Kununurra,” Department of Agriculture Western Australia, Resource Management Technical Report 156, 1996. [13] N. Schoknecht and C. Grose, “Soils of the Ivanhoe West Bank East Kimberley Western Australia,” Department of Agriculture Western Australia, Resource Management Technical Report 1551, 1996. [14] G. M. Plunkett and R. C. Muchow, “Water Extraction by Sugarcane on Soils of the Ord Irrigation Area,” Austra- lian Journal of Experimental Agriculture, Vol. 43, No. 5, 2003, pp. 487-495. [15] A. L. Chapman, J. D. Sturtz, A. L. Cogle, W. S. Mollah and J. R. Bateman, “Farming Systems in the Australia Semi-Arid Tropics: A Recent History,” Australian Jour- nal experimental Agriculture, Vol. 36, No. 8, 1996, pp. 915- 928. [16] CSIRO, “Water in the Timor Sea Drainage Division, a Report to the Australian Government from the CSIRO Northern Australia Sustainable Yields Project,” CSIRO Water for a Healthy Country Flagship, Australia, 2009, p. 508. [17] C. W. Rose, P. W. Dayananda, D. R. Nielsen and J. M. Biggar, “Long Term Solute Dynamics and Hydrology in Irrigated Slowly Permeable Soils,” Irrigation Science, Vol. 1, No. 2, 1979, pp. 77-87. [18] Kinhill Pty. Ltd., “Water Infiltration Modelling for the Ord Sugar Project,” Ord River Irrigation Area Stage 2 Proposed Development of the M2 Area, Consultancy Re- port for Wesfarmers Ltd. Marubeni Corporation and the Water Corporation of Western Australia, Perth, August 1999. [19] J. L. Hutson and R. J. Wagenet, “LEACHM ‘Leaching Estimation a Chemistry Model’ A Process-Based Model of Water and Solute Movement, Transformations, Plant Uptake, and Chemical Reactions in the Unsaturated Zone,” 3rd Edition, Cornell University, Ithaca, New York, 1992. [20] G. S. Campbell, “A Simple Method for Determining Un- saturated Conductivity from Moisture Retention Data,” Soil Science, Vol. 117, No. 6, 1974, pp. 311-314. [21] J. L. Hutsonand and A. Cass, “A Retentivity Function for Use in Soil-Water Simulation Models,” Journal of Soil Science, Vol. 38, No. 1, 1987, pp. 105-113. [22] B. J. Cosby, G. M. Hornberger, R. B. Clapp and T. R. Ginn, “A Statistical Exploration of the Relationships of Soil Moisture Characteristics to the Physical Properties of Soils Stochastic Modelling,” Water Resources Research, Vol. 26, No. 6, 1984, pp. 682-690. [23] J. L. Hutson, “Water Retentivity of Some African Soils in Relation to Particle Size Criteria and Bulk Density,” South African Journal for Plant and Soil, Bureau for Sci- entific Publications, Foundation for Education, Science and Technology, Vol. 3, No. 4, 1986, pp.151-155. [24] W. J. Rawls and D. L. Brakensiek, 1985. “Prediction of Soil Water Properties for Hydrologic Modelling,” In: E. B. Jones and T. J. Ward, Eds., Proceedings of a Sympo- sium Watershed Management in the Eighties, New York, 30 April-1 May 1985, pp. 293-299. [25] S. W. Childs and R. J. Hanks, “Model of Soil Salinity Effects on Crop Growth,” Soil Science Society of America Proceedings, Vol. 39, No. 4, 1975, pp. 617-622. [26] S. W. Childs, “A Model to Predict the Effect of Salinity on Crop Growth,” Utah State University, Logan, Utah, Copyright © 2010 SciRes. NR  Modelling Irrigation and Salinity Management Strategies in the Ord Irrigation Area Copyright © 2010 SciRes. NR 56 1975. [27] J. M. Davidson, D.A. Graetz, C. Rao and H. M. Selim, “Simulation of Nitrogen Movement, Transformation and Uptake in Plant Root Zone,” EPA-600/3-78-029, 1978. [28] M. N. Nimah and R. J. Hanks, “Model for Estimating Soil Water, Plant, and Atmospheric Interrelations, I. Descrip- tion and Sensitivity,” Soil Science Society of America Proceedings, Vol. 37, No. 4, 1973, pp. 522-527. [29] B. J. Bridge and R. C. Muchow, “Soil Water Relation- ships for Cununurra Clay and Ord Sandy Loam in the Ord River Irrigation Area,” Tropical Agronomy Technical Memorandum Number 30, CSIRO division of Tropical Crops and Pastures, St. Lucia, Brisbane, Queensland, Australia, 1982. [30] OGTR, “The Biology of Zea Mays L. Ssp Mays (Maize or Corn),” Office of the Gene Technology Regulator (OGTR), Australian Government, Department of Health and Ageing, 2008, p. 80. [31] M. Kondo, M. V. R. Murty, and D. V. Aragones, “Char- acteristics of Root Growth and Water Uptake from Soil in Upland Rice and Maize under Water Stress,” Soil Science and Plant Nutrition, Vol. 46, No. 3, 2000, pp. 721-732. [32] L. M. Dwyer, B. L. Ma, D. W. Stewart, H. N. Hayhoe, D. Balchin, J. L. B. Culley and M. McGovern, “Root Mass Distribution under Conventional and Conservation Till- age,” Canadian Journal of Soil Science, Vol. 76, No. 1, 1996, pp. 23- 28. [33] E. L. Anderson, “Tillage and N Fertilization Effects on Maize Root Growth and Root: Shoot Ratio,” Plant Soil, Vol. 108, No. 2, 1988, pp. 245-251. [34] R. E. Danielson, 1967. “Root Systems in Relation to Irri- gation,” In: R. M. Hagan, H. R. Haise and T. W. Edmin- ster, Ed., Irrigation of Agricultural Lands, American So- ciety of Agronomy, Wisconsin, 1967, pp. 390-413. [35] C. J. Willmott, “On the Validation of Models,” Physical Geography, Vol. 2, No. 2, 1981, pp. 184-194. [36] T. Roberts, N. Lazarovich, A. W. Warrick and T. L. Thompson, “Modelling Salt Accumulation with Subsur- face Drip Irrigation Using HYDRUS-2D,” Soil Science Society of America Journal, Vol. 73, No. 1, 2009, pp. 233- 240. [37] R. C. Muchow, “Comparative Productivity of Maize, Sorghum and Pearl Millet in a Semi-Arid Tropical Envi- ronment. II. Effect of Water Deficits,” Field crops Re- search, Vol. 20, No. 3, 1989, pp. 207-219. [38] K. S. Fischer and F. E. Palmer, “Tropical Maize,” In: P. R. Goldsworthy and N. M. Fischer, Eds., The Physiology of Tropical Field Crops, Wiley, Chichestor, 1984, pp. 213- 248. [39] M. J. Robertson, N. G. Inman-Bamber, R. C. Muchow and A. W. Wood, “Physiology and Productivity of Sug- arcane with Early and Mid-Season Water Deficit,” Filed Crops Research, Vol. 64, No. 3, 1999, pp. 211-227. [40] R. C. Muchow and B. A. Keating, “Assessing Irrigation Requirements in the Ord Sugar Industry Using a Simula- tion Modelling Approach,” Australian Journal of Ex- perimental Agriculture, Vol. 38, No. 4, 1998, pp. 345- 354. [41] L. K. Stewart, P. B. Charlesworth, K. L. Bristow and P. J. Thorburn, “Estimating Deep Drainage and Nitrate Leach- ing from the Root Zone Under Sugarcane Using AP- SIM-SWIM,” Agricultural Water Management, Vol. 81, No. 3, 2006, pp. 315-334. [42] C. A. Hurst, P. J. Thorburn, D. Lockington and K. L. Bristow, “Sugarcane Water Use from Shallow Water Ta- bles: Implications for Improving Irrigation Water Use Ef- ficiency,” Agricultural Water Management, Vol. 65, No. 2004, 2004, pp.1-19. [43] G. Hunsigi and S. C. Srivastava, “Modulation of ET (Evapotranspiration) Values of Sugar Cane Because of High Water Table,” Proceedings of the 16th ISSCT Con- gress, Australia, 1977, pp. 1557-1564. [44] Y. S. Chauhan, “Potential Productivity and Water Re- quirements of Maize-Peanut Rotations in Australian Semi-Arid Tropical Environments: A Crop Simulation Study,” Agricultural Water Management, Vol. 97, No. 3, 2010, pp. 457-464. |

