 Journal of Behavioral and Brain Science, 2013, 3, 13-25 http://dx.doi.org/10.4236/jbbs.2013.31003 Published Online February 2013 (http://www.scirp.org/journal/jbbs) Blood Chemistry, Acid-Base, Electrolyte, Blood Lactate Metabolism and Sleep at 3480 m in Mountain Marathon Runners Ivana Gritti1*, Clara Mauri1, Stefano Defendi1, Daniele Cesana2, Federica Consonni2, Alberto Dolci3, Sabrina Luoni1 1Department of Biomedical and Clinical Science Luigi Sacco, University of Milan, Milan, Italy 2Roche Diagnostic SpA, Viale Stucchi 110, Milan, Italy 3Hospital Luigi Sacco, University of Milan, Milan, Italy Email: *Ivana.Gritti@unimi.it Received December 20, 2012; revised December 27, 2012; accepted February 19, 2013 ABSTRACT Altered blood chemistry, acid-base and electrolyte are suggested determinants of sleep disturbance, with frequent arou- sal at high altitude even in well and long-trained altitude marathon runners. In this sample of experienced altitude marathon runners with maximal aerobic power at sea level of 61.4 ± 2.7 ml/kg−1·min−1 we found that pO2 and percent of oxygen saturation (%SO2) were lower at 2050 m and 3480 m than at sea level; pO2 was higher after 38 - 41 hours than after 30 - 31 hours of acclimatization at 3480 m (P < 0.05). After ascentto 3480 m %SO2 decreased (P < 0.003). Com- pared to sea level values, pH increased at high altitude (P < 0.05) consistent with changes in pCO2 and (P < 0.05). Nocturnal %SpaO2 at a sleeping altitude of 3480 m was lower (P < 0.05) than at sea level. At high altitude, the percent of wake (W) time and delay falling asleep (DFA) increased, whereas non-rapid eye movement sleep (N-REM), REM sleep and total sleep time (TST) decreased (P < 0.05). Simple regression analysis disclosed a significant correla- tion between the changes in TST and the percent of REM sleep and the changes in %SpaO2 recorded during sleep (P < 0.05). Simple regression analysis showed a positive correlation between the changes in pO2 at higher altitude and the percent of W and of TST (P < 0.05). The changes in pO2, tCO2 and 3 HCO− 3 HCO− 3 HCO− correlated negatively and significantly with the percent of REM sleep changes at high altitude (P < 0.05). The TST changes at high altitude correlated posi- tively with the changes in pO2 and pH and correlated negatively with the changes in %SO2, pCO2, tCO2, and 3 HCO− (P < 0.05). The changes in the percent of W at high altitude correlated significantly and positively with the changes in bases excess [BE] at high altitude (P < 0.05). The changes in the percent of REM sleep correlated significantly and positively with the changes in [iCa++] and [BE] and negatively with the changes in buffered bases [BB] and [BEeffec- tive] (P < 0.05). The change in the percent of NREM + REM sleep at high altitude correlated significantly and posi- tively with the changes in [BE] and [BB] concentration (P < 0.05). The increase in DFA at high altitude correlated sig- nificantly and negatively with the changes in pCO2 and significantly and negatively with the changes in [K+] (P < 0.05). Simple regression analysis demonstrated that the changes in pH at high altitude correlated positively and significantly with the percent of W and the DFA and negatively with the percent of changes in NREM sleep, REM sleep, NREM + REM sleep (P < 0.05). The decrease in the TST at high altitude correlated significantly and negatively with the changes in pCO2, tCO2, and [K+] (P < 0.05). Our data demonstrate that the arterialized ear lobe techniques we used for evaluating most of the changes in blood chemistry, acid-base, electrolyte and blood lactate metabolism aresuitable for clinical and laboratory assessment and are important predictors of the quality and quantity of acclimatization and sleep at high altitude. Keywords: Clinical Investigation at High Altitude; Laboratory Investigation at High Altitude; Hematochemistry; Acid-Base Metabolism; Electrolyte Metabolism; Blood Lactate Metabolism; Hydration Status; Sleep Quality Indicators; EEG; Mountain Marathon Runners *Corresponding author. C opyright © 2013 SciRes. JBBS  I. GRITTI ET AL. Copyright © 2013 SciRes. JBBS 14 1. Introduction Clinical and laboratory investigations can help us to un- derstand how the body adjusts its biochemical and phy- siological cellular needs to counter health risks associ- ated with exposure and activities in hypobaric-hypoxia conditions. Research into these mechanisms is funda- mental for studying the appropriate time course of accli- matization and the quality and quantity of sleep at high altitude [1-5]. Increasingly popular as a recreational sport, endurance and marathon race events at high altitude (2500 - 5500 m) became part of the Olympic games in 1968. Mountain running competitions are generally long-distance races similar to the classic marathon race, over rough terrain at high altitude, under relatively hypoxic conditions, with different gradients between the start and the end of the race. Usually referred to as mountain marathon sky runners, some athletes possess the anthropometric characteristics typical of marathoners [6]. Experimental studies on the exercise physiology of mountain marathon runners dem- onstrated that marathon performance at high altitude is safe, demands strenuous effort, and induces transient, psy- chological, hematological and hormonal variations that fully resolve within 24 hours [6-16]. Studies of hypobaric-hypoxic high-altitude conditions have reported different degrees of high-altitude-induced altered states of consciousness [16,17]: insomnia, dizzi- ness, sleep-wake disturbances [18], paroxysm [19] in nor- mal subjects and mountain climbers and cognitive chan- ges in mountain marathon runners [16]. Fundamental for attaining maximal performance in mountain marathon running at high altitude is the degree of acclimatization and training [7-16]. Current debate centers on the use of specific metabolic markers [3-5] and sleep quality and quantity as indices of general and central nervous system health status [2], as well as the tempo of acclimatization to high altitude conditions in mountain marathon runners preparing for performance at high altitude. We studied healthy mountain marathoners native to sea level, matched for aerobic power, anthropometrical characteristics and level of athletic performance at high altitude under a controlled standard method/protocol for physical and psychological stressors. For clinical and la- boratory investigation we took repeated measurement of metabolic variations in acid-base, electrolyte and blood lactate. The nocturnal percent of peripheral arterial oxy- gen saturation was measured every 30 seconds, and poly- somnographic activity during sleep was recorded by means of electroencephalogram (EEG), electro-oculo- gram (EOG) and electromyogram (EMG) and by admini- stration of questionnaires investigating sleep quality. The aim of the study was to collect data on the degree and tempo of acclimatization after ascent to 3480 m, which might be, together with nutrition, energetics [20], and exercise level [6], a crucial step in acclimatization when mountain marathon runners need to perfect their physical work capacity and performance during races at altitudes between 2000 m and 5000 m. 2. Materials and Methods 2.1. Subjects Six healthy male mountain marathon runners (age range 37 - 44 years) were recruited for the study. The subjects were part of a group of experienced high-altitude runners that had been clinically tested since 1994. The mean body mass was 65.8 ± 4 kg; the height was 1.76 ± 0.37 cm; the mean maximal aerobic power at sea level was 61.4 ± 2.7 ml/kg−1·min−1. Maximal aerobic power was measured by using open circuit spirometry during a step- incremental treadmill run to volitional exhaustion. Diet was controlled for food and water intake at low and at high altitudes during the study period; no neuro- depresssive or neuroactive beverages were allowed. The subjects were also asked to avoid aerobic and anaerobic exercise about 12 hours before the sea level testing ses- sion and during the long testing sessions at high altitude. All experiments were carried out in accordance with the Helsinki Declaration (1975/1983) and the 86/609/EEC directive for experimental human care and designed to reduce stress and suffering to a minimal level, number of subjects used, and number of tests performed. Impor- tantly, informed consent was obtained from each subject before each experiment, in accordance with the rules of the International Federation of Sport at Altitude (FSA). Local time and barometric pressure (PB) at an altitude of 122 m (Department of Clinical Science, Luigi Sacco Hospital, University of Milan, Milan, Italy), at 2050 m (Cervinia, Aosta, Valle d’Aosta, Italy) and at 3480 m (Plateau Rosà, Cervinia, Aosta, Valle d’Aosta, Italy) were measured using a chronometer and barometer sen- sors mounted on a mobile hemogasanalyzer kindly pro- vided by OptiCCA®, Roche Diagnostics (Monza, Italy). The mountain marathon runners ascended from 122 m at 11:00 h, reaching 2050 m at 13:00 - 14:00 h by car and 3480 m at about 15:00 - 16:00 h by cable car. Metabolic measurements were taken with the subjects in a behav- ioral wakeful state, preferably supine, otherwise in a sit- ting position, after at least 3 hours of rest, and before, during and after sleep in a wooden room. 2.2. Hematochemical, Acid-Base and Electrolyte Metabolism In five mountain marathon runners, hematochemical pa- 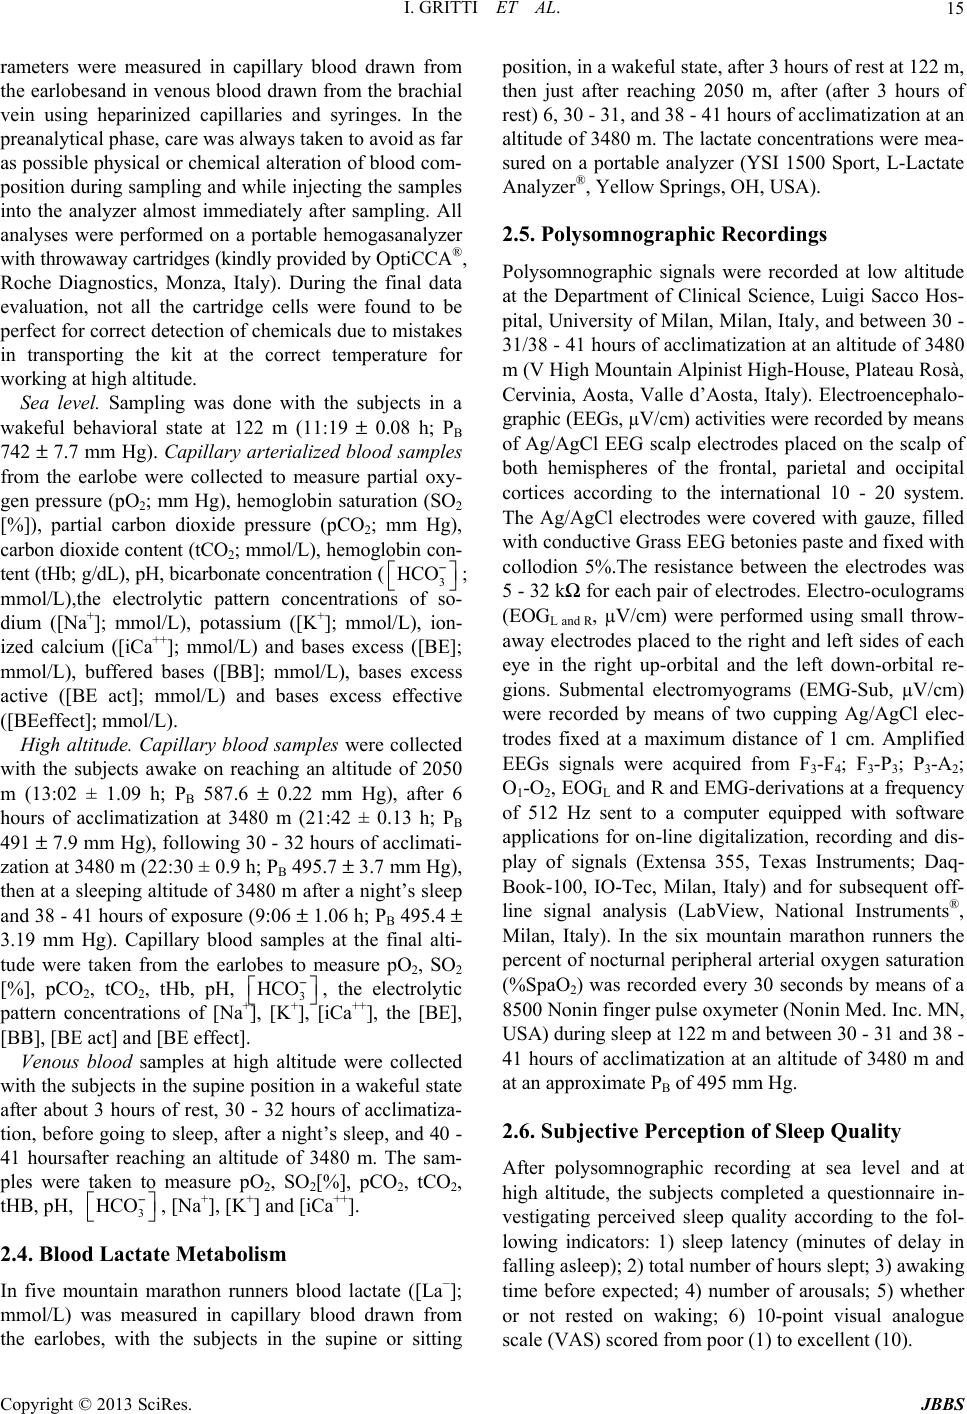 I. GRITTI ET AL. 15 rameters were measured in capillary blood drawn from the earlobesand in venous blood drawn from the brachial vein using heparinized capillaries and syringes. In the preanalytical phase, care was always taken to avoid as far as possible physical or chemical alteration of blood com- position during sampling and while injecting the samples into the analyzer almost immediately after sampling. All analyses were performed on a portable hemogasanalyzer with throwaway cartridges (kindly provided by OptiCCA®, Roche Diagnostics, Monza, Italy). During the final data evaluation, not all the cartridge cells were found to be perfect for correct detection of chemicals due to mistakes in transporting the kit at the correct temperature for working at high altitude. Sea level. Sampling was done with the subjects in a wakeful behavioral state at 122 m (11:19 ± 0.08 h; PB 742 ± 7.7 mm Hg). Capillary arterialized blood samples from the earlobe were collected to measure partial oxy- gen pressure (pO2; mm Hg), hemoglobin saturation (SO2 [%]), partial carbon dioxide pressure (pCO2; mm Hg), carbon dioxide content (tCO2; mmol/L), hemoglobin con- tent (tHb; g/dL), pH, bicarbonate concentration (3 HCO− ; mmol/L),the electrolytic pattern concentrations of so- dium ([Na+]; mmol/L), potassium ([K+]; mmol/L), ion- ized calcium ([iCa++]; mmol/L) and bases excess ([BE]; mmol/L), buffered bases ([BB]; mmol/L), bases excess active ([BE act]; mmol/L) and bases excess effective ([BEeffect]; mmol/L). High altitude. Capillary blood samples were collected with the subjects awake on reaching an altitude of 2050 m (13:02 ± 1.09 h; PB 587.6 ± 0.22 mm Hg), after 6 hours of acclimatization at 3480 m (21:42 ± 0.13 h; PB 491 ± 7.9 mm Hg), following 30 - 32 hours of acclimati- zation at 3480 m (22:30 ± 0.9 h; PB 495.7 ± 3.7 mm Hg), then at a sleeping altitude of 3480 m after a night’s sleep and 38 - 41 hours of exposure (9:06 ± 1.06 h; PB 495.4 ± 3.19 mm Hg). Capillary blood samples at the final alti- tude were taken from the earlobes to measure pO2, SO2 [%], pCO2, tCO2, tHb, pH, 3 HCO− , the electrolytic pattern concentrations of [Na+], [K+], [iCa++ ], the [BE], [BB], [BE act] and [BE effect]. Venous blood samples at high altitude were collected with the subjects in the supine position in a wakeful state after about 3 hours of rest, 30 - 32 hours of acclimatiza- tion, before going to sleep, after a night’s sleep, and 40 - 41 hoursafter reaching an altitude of 3480 m. The sam- ples were taken to measure pO2, SO2[%], pCO2, tCO2, tHB, pH, , [Na+], [K+] and [iCa++]. 3 HCO− 2.4. Blood Lactate Metabolism In five mountain marathon runners blood lactate ([La−]; mmol/L) was measured in capillary blood drawn from the earlobes, with the subjects in the supine or sitting position, in a wakeful state, after 3 hours of rest at 122 m, then just after reaching 2050 m, after (after 3 hours of rest) 6, 30 - 31, and 38 - 41 hours of acclimatization at an altitude of 3480 m. The lactate concentrations were mea- sured on a portable analyzer (YSI 1500 Sport, L-Lactate Analyzer®, Yellow Springs, OH, USA). 2.5. Polysomnographic Recordings Polysomnographic signals were recorded at low altitude at the Department of Clinical Science, Luigi Sacco Hos- pital, University of Milan, Milan, Italy, and between 30 - 31/38 - 41 hours of acclimatization at an altitude of 3480 m (V High Mountain Alpinist High-House, Plateau Rosà, Cervinia, Aosta, Valle d’Aosta, Italy). Electroencephalo- graphic (EEGs, µV/cm) activities were recorded by means of Ag/AgCl EEG scalp electrodes placed on the scalp of both hemispheres of the frontal, parietal and occipital cortices according to the international 10 - 20 system. The Ag/AgCl electrodes were covered with gauze, filled with conductive Grass EEG betonies paste and fixed with collodion 5%.The resistance between the electrodes was 5 - 32 kΩ for each pair of electrodes. Electro-oculograms (EOGL and R, µV/cm) were performed using small throw- away electrodes placed to the right and left sides of each eye in the right up-orbital and the left down-orbital re- gions. Submental electromyograms (EMG-Sub, µV/cm) were recorded by means of two cupping Ag/AgCl elec- trodes fixed at a maximum distance of 1 cm. Amplified EEGs signals were acquired from F3-F4; F3-P3; P3-A2; O1-O2, EOGL and R and EMG-derivations at a frequency of 512 Hz sent to a computer equipped with software applications for on-line digitalization, recording and dis- play of signals (Extensa 355, Texas Instruments; Daq- Book-100, IO-Tec, Milan, Italy) and for subsequent off- line signal analysis (LabView, National Instruments®, Milan, Italy). In the six mountain marathon runners the percent of nocturnal peripheral arterial oxygen saturation (%SpaO2) was recorded every 30 seconds by means of a 8500 Nonin finger pulse oxymeter (Nonin Med. Inc. MN, USA) during sleep at 122 m and between 30 - 31 and 38 - 41 hours of acclimatization at an altitude of 3480 m and at an approximate PB of 495 mm Hg. 2.6. Subjective Perception of Sleep Quality After polysomnographic recording at sea level and at high altitude, the subjects completed a questionnaire in- vestigating perceived sleep quality according to the fol- lowing indicators: 1) sleep latency (minutes of delay in falling asleep); 2) total number of hours slept; 3) awaking time before expected; 4) number of arousals; 5) whether or not rested on waking; 6) 10-point visual analogue scale (VAS) scored from poor (1) to excellent (10). Copyright © 2013 SciRes. JBBS  I. GRITTI ET AL. Copyright © 2013 SciRes. JBBS 16 2.7. Statistical Analysis 0.05 were considered statistically significant. Data are presented as the mean ± standard deviation (SD). Measurements were submitted to statistical analysis em- ploying one way analysis of variance (ANOVA) fol- lowed by post-hoc multiple comparison of the means by applying Fisher’s Protected Least Significant Difference (PLSD), Scheffé and Dunnet. Differences between paired and unpaired single or repeated measurements were also analyzed using Student’s t-test. Linear simple regression analysis was also performed. Probability levels of P < 3. Results 3.1. Hematochemical and Acid-Base Metabolism The results of capillary and venous blood analysis showed changes in respiratory alkalosis and metabolic compen- sation during 6, 30 - 31, 40 - 41 hours of acclimatization at 3480 m. Changes in hemoglobin values were observed within the normal range for this type of athletes (Tables 1-3). Table 1. Hematochemical, acid base, electrolyte, and blood lactate values at 122 m, during acclimatisation at 2050 m and after 6, 30 - 31, 38 - 41 hours of acclimatisation at an altitude of 3480 m. Data from capillary earlobe samples (1,2,3,4). Parameters 122 m 2050 m 3480 m (6 h) vs 122 m vs 122 mvs 2050 m No. (5) MeanSD No. (5)Mean SDP t-test No. (5)Mean SD P t-test P t-test PB mmHg 4 742.17.7 5 587.6 0.20.0001 5 491.3 7.89 0.0001 0.0001 pO2 mmHg 4 71.46 5 58.18 20.02 5 39.89 4.5 0.0002 0.00025 pCO2 mmHg 4 41.213.38 5 34.74 3.30.03 5 33.65 0.85 0.01811 tCO2 mmol/L 4 29.871.44 5 27.22 1.80.04 5 27.16 1.37 0.02698 SO2% 4 93.92.19 5 91.321 1.5 5 77.7 6.3 0.0028 0.00712 tHb g/L 4 15.721.45 5 16.62 1.1 5 15.64 1.95 pH 4 7.460.02 5 7.4954 00.03 5 7.5074 0.022 0.00791 3 − HCO 3 − HCO mmol/L 4 28.631.39 5 26.14 1.80.05 5 26.12 1.331 0.03183 [Na+] mmol/L 1 139 5 138.96 1.6 2 141.5 0.771 [K+] mmol/L 1 4.7 5 5.06 0.9 2 4.25 0.007 [iCa++] mmol/L 1 1.17 5 1.19 0 2 1.19 0.014 [BE] mmol/L 4 4.350.77 5 3.3 1.3 5 3.54 1.6 [BB] mmol/L n.r. n.r.n.r. 5 52.02 1.6 n.r. n.r. n.r. [BEact] mmol/L n.r. n.r.n.r. 5 3.82 1.3 n.r. n.r. n.r. [BEeffect] mmol/L n.r. n.r.n.r. 5 3.7 2.7 n.r. n.r. n.r. [La−] mmol/L 3 0.770.1 5 0.96 0.2 5 0.88 0.2419 Parameters 3480 m (30 - 31 h) 3480 m (38 - 41 h) vs 122 m vs 2050 m vs 3480 m (6 h) vs 122 m vs 2050 m vs 3480 m (6 h) vs 3480 m (30 - 31 h) No. (5) MeanSD P t-test P t-testP t-test No. (5)MeanSD P t-test P t-test P t-test P t-test PB mmHg 10 495.73.4 0.0001 0.0001 10 495.43.180.0001 0.0001 pO2 mmHg 10 45.324.22 0.00105 0.0001 0.0565 10 49.494.030.0022 0.0001 0.0045 0.0366 pCO2 mmHg 10 29.332.61 0.0021 0.01670.0004 10 28.032.330.0016 0.0066 0.0001 tCO2 mmol/L 10 83.554.82 0.00015 0.0005 10 86.453.510.0009 0.0025 0.0322 SO2% 10 24.251.81 0.00049 0.0172 0.0057 10 22.771.750.0001 0.002 tHb g/L 10 15.901.5 10 16.411.29 0.0003 pH 10 7.520.02 0.00075 10 7.5110.030.0001 mmol/L 10 23.361.73 0.00058 0.01960.0063 10 21.921.7 0.0001 0.0002 0.00036 [Na+] mmol/L 7 141.31.49 0.0337 7 139.61.36 0.0445 [K+] mmol/L 7 5.230.63 0.0057 7 5.230.67 0.0079 [iCa++] mmol/L 7 1.210.04 7 1.2040.06 [BE] mmol/L 10 1.681.42 0.00104 0.058 10 0.411.57 0.0041 0.00412 [BB] mmol/L 5 50.541.49 4 49.332.32 [BEact] mmol/L 5 2.181.4 4 1.6251.13 0.0299 [BEeffect] mmol/L 5 1.341.15 4 1.9251.44 [La−] mmol/L 5 0.920.36 5 0.6010.25 0.0498 (1) Abbreviations of haematochemical parameter and units are detailed in the method sections. (2) Measurements were submitted to statistical analyses, em- ploying one-way analyses of variance ANOVA followed by post-hoc multiple comparisons of the meansby applying Fisher’s and Scheffe’s Protected Least Significance Difference (PLSD) and Student t-test. The significant level was set at P < 0.05. (3) Measurements submitted to statistical Dunnet analysis were found not significantly different. (4) Only the detailed values regarding the Student t-test are reported. (5) No = Number of measurements performed in the five mountain runners at different altitudes. 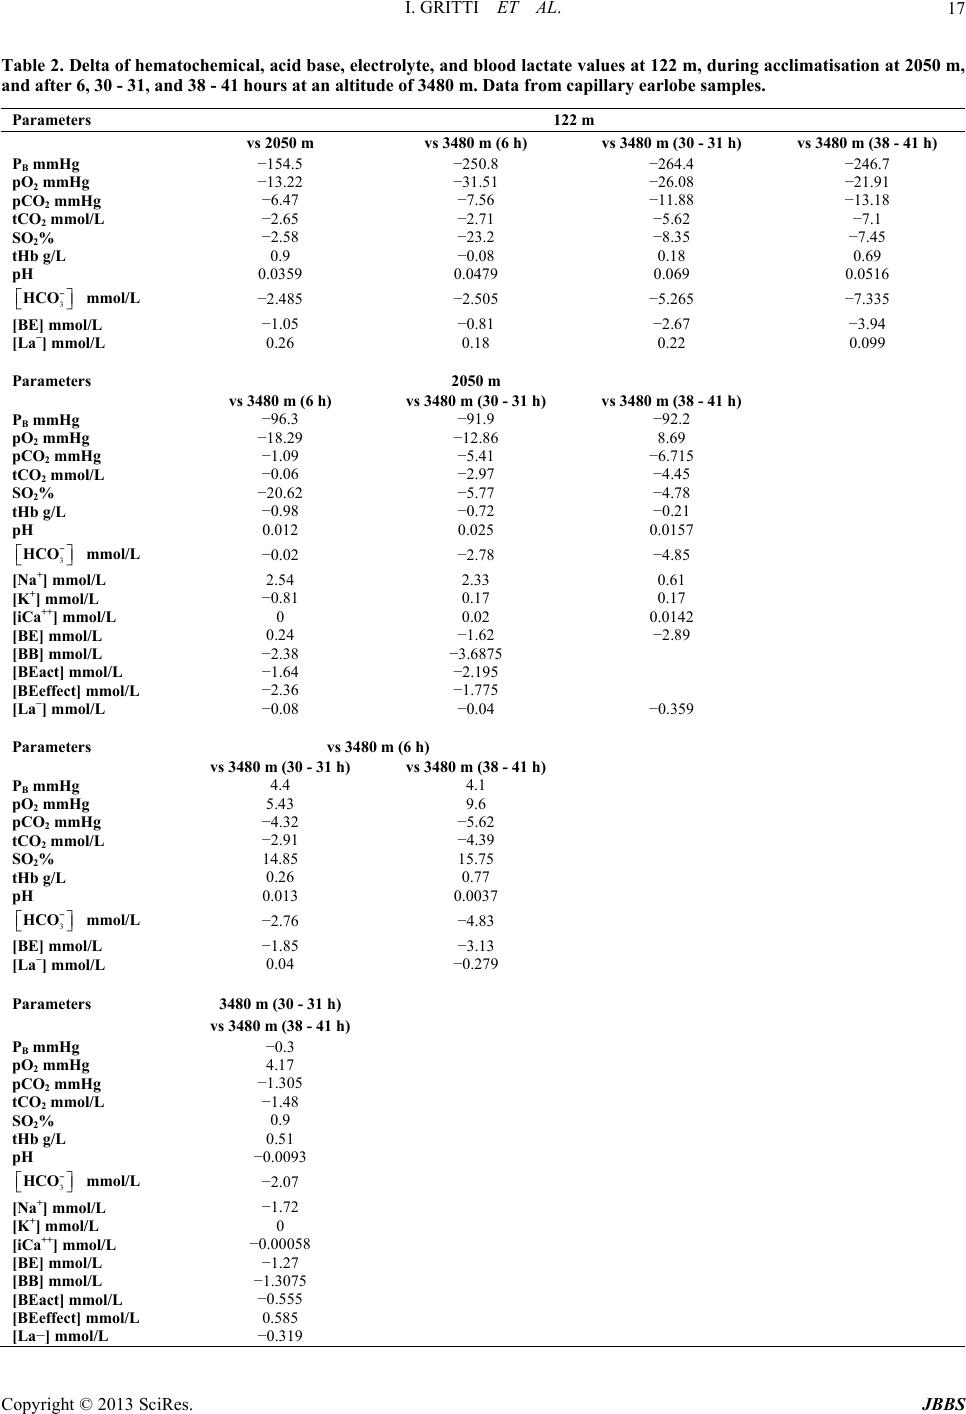 I. GRITTI ET AL. 17 Table 2. Delta of hematochemical, acid base, electrolyte, and blood lactate values at 122 m, during acclimatisation at 2050 m, and after 6, 30 - 31, and 38 - 41 hours at an altitude of 3480 m. Data from capillary earlobe samples. Parameters 122 m vs 2050 m vs 3480 m (6 h) vs 3480 m (30 - 31 h) vs 3480 m (38 - 41 h) PB mmHg −154.5 −250.8 −264.4 −246.7 pO2 mmHg −13.22 −31.51 −26.08 −21.91 pCO2 mmHg −6.47 −7.56 −11.88 −13.18 tCO2 mmol/L −2.65 −2.71 −5.62 −7.1 SO2% −2.58 −23.2 −8.35 −7.45 tHb g/L 0.9 −0.08 0.18 0.69 pH 0.0359 0.0479 0.069 0.0516 3 − HCO 3 − HCO 3 − HCO 3 − HCO mmol/L −2.485 −2.505 −5.265 −7.335 [BE] mmol/L −1.05 −0.81 −2.67 −3.94 [La−] mmol/L 0.26 0.18 0.22 0.099 Parameters 2050 m vs 3480 m (6 h) vs 3480 m (30 - 31 h) vs 3480 m (38 - 41 h) PB mmHg −96.3 −91.9 −92.2 pO2 mmHg −18.29 −12.86 8.69 pCO2 mmHg −1.09 −5.41 −6.715 tCO2 mmol/L −0.06 −2.97 −4.45 SO2% −20.62 −5.77 −4.78 tHb g/L −0.98 −0.72 −0.21 pH 0.012 0.025 0.0157 mmol/L −0.02 −2.78 −4.85 [Na+] mmol/L 2.54 2.33 0.61 [K+] mmol/L −0.81 0.17 0.17 [iCa++] mmol/L 0 0.02 0.0142 [BE] mmol/L 0.24 −1.62 −2.89 [BB] mmol/L −2.38 −3.6875 [BEact] mmol/L −1.64 −2.195 [BEeffect] mmol/L −2.36 −1.775 [La−] mmol/L −0.08 −0.04 −0.359 Parameters vs 3480 m (6 h) vs 3480 m (30 - 31 h) vs 3480 m (38 - 41 h) PB mmHg 4.4 4.1 pO2 mmHg 5.43 9.6 pCO2 mmHg −4.32 −5.62 tCO2 mmol/L −2.91 −4.39 SO2% 14.85 15.75 tHb g/L 0.26 0.77 pH 0.013 0.0037 mmol/L −2.76 −4.83 [BE] mmol/L −1.85 −3.13 [La−] mmol/L 0.04 −0.279 Parameters 3480 m (30 - 31 h) vs 3480 m (38 - 41 h) PB mmHg −0.3 pO2 mmHg 4.17 pCO2 mmHg −1.305 tCO2 mmol/L −1.48 SO2% 0.9 tHb g/L 0.51 pH −0.0093 mmol/L −2.07 [Na+] mmol/L −1.72 [K+] mmol/L 0 [iCa++] mmol/L −0.00058 [BE] mmol/L −1.27 [BB] mmol/L −1.3075 [BEact] mmol/L −0.555 [BEeffect] mmol/L 0.585 [La−] mmol/L −0.319 Copyright © 2013 SciRes. JBBS 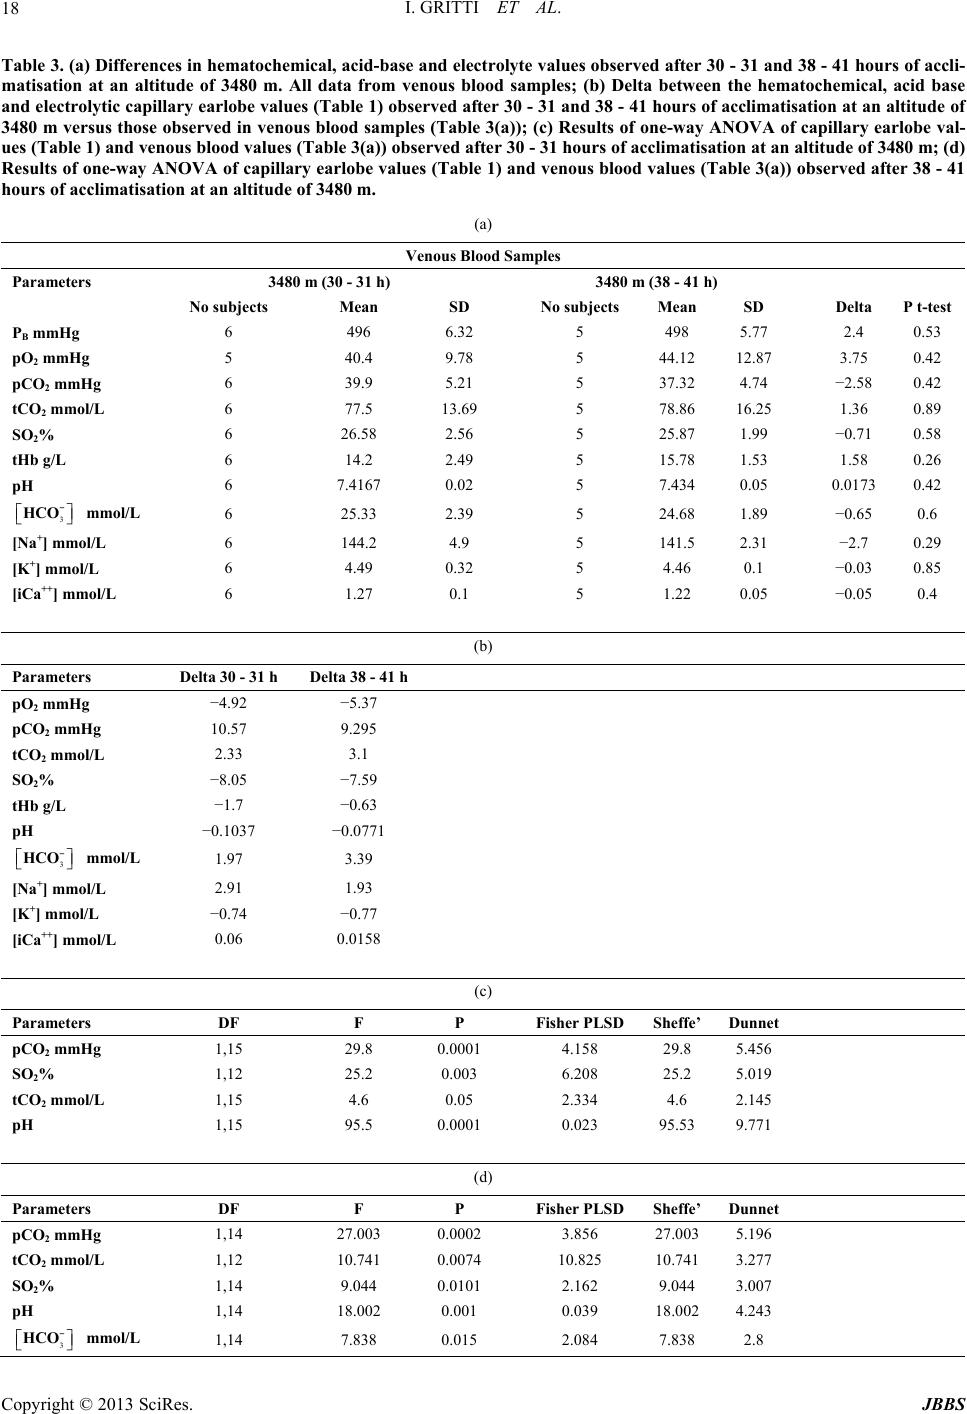 I. GRITTI ET AL. 18 Table 3. (a) Differences in hematochemical, acid-base and electrolyte values observed after 30 - 31 and 38 - 41 hours of accli- matisation at an altitude of 3480 m. All data from venous blood samples; (b) Delta between the hematochemical, acid base and electrolytic capillary earlobe values (Table 1) observed after 30 - 31 and 38 - 41 hours of acclimatisation at an altitude of 3480 m versus those observed in venous blood samples (Table 3(a)); (c) Results of one-way ANOVA of capillary earlobe val- ues (Table 1) and venous blood values (Table 3(a)) observed after 30 - 31 hours of acclimatisation at an altitude of 3480 m; (d) Results of one-way ANOVA of capillary earlobe values (Table 1) and venous blood values (Table 3(a)) observed after 38 - 41 hours of acclimatisation at an altitude of 3480 m. (a) Venous Blood Samples Parameters 3480 m (30 - 31 h) 3480 m (38 - 41 h) No subjects Mean SD No subjects Mean SD Delta P t-test PB mmHg 6 496 6.32 5 498 5.77 2.4 0.53 pO2 mmHg 5 40.4 9.78 5 44.12 12.87 3.75 0.42 pCO2 mmHg 6 39.9 5.21 5 37.32 4.74 −2.58 0.42 tCO2 mmol/L 6 77.5 13.69 5 78.86 16.25 1.36 0.89 SO2% 6 26.58 2.56 5 25.87 1.99 −0.71 0.58 tHb g/L 6 14.2 2.49 5 15.78 1.53 1.58 0.26 pH 6 7.4167 0.02 5 7.434 0.05 0.01730.42 3 − HCO mmol/L 6 25.33 2.39 5 24.68 1.89 −0.65 0.6 [Na+] mmol/L 6 144.2 4.9 5 141.5 2.31 −2.7 0.29 [K+] mmol/L 6 4.49 0.32 5 4.46 0.1 −0.03 0.85 [iCa++] mmol/L 6 1.27 0.1 5 1.22 0.05 −0.05 0.4 (b) Parameters Delta 30 - 31 h Delta 38 - 41 h pO2 mmHg −4.92 −5.37 pCO2 mmHg 10.57 9.295 tCO2 mmol/L 2.33 3.1 SO2% −8.05 −7.59 tHb g/L −1.7 −0.63 pH −0.1037 −0.0771 3 − HCO mmol/L 1.97 3.39 [Na+] mmol/L 2.91 1.93 [K+] mmol/L −0.74 −0.77 [iCa++] mmol/L 0.06 0.0158 (c) Parameters DF F P Fisher PLSDSheffe’Dunnet pCO2 mmHg 1,15 29.8 0.00014.158 29.8 5.456 SO2% 1,12 25.2 0.003 6.208 25.2 5.019 tCO2 mmol/L 1,15 4.6 0.05 2.334 4.6 2.145 pH 1,15 95.5 0.00010.023 95.53 9.771 (d) Parameters DF F P Fisher PLSDSheffe’Dunnet pCO2 mmHg 1,14 27.003 0.00023.856 27.0035.196 tCO2 mmol/L 1,12 10.741 0.007410.825 10.7413.277 SO2% 1,14 9.044 0.01012.162 9.044 3.007 pH 1,14 18.002 0.001 0.039 18.0024.243 3 − HCO mmol/L 1,14 7.838 0.015 2.084 7.838 2.8 Copyright © 2013 SciRes. JBBS  I. GRITTI ET AL. Copyright © 2013 SciRes. JBBS 19 There was a statistically significant decrease between pO 23 2 (mm Hg) values measured at 3480 m and at a PB of approximately 495 mm Hg and those observed at 122 m and at PB of approximately 742 mm Hg (Tables 1-3). pO2 values measured after 30 - 31 hours and after 38 - 41 hours of acclimatization and at a PB of approximately 495 mm Hg were both significantly higher than those after 6 hours at an altitude of 3480 m and at a PB of ap- proximately 491 mm Hg; pO2 values increased between 30 - 31 hours and 38 - 41 hours of acclimatization at 3480 m and at a PB of approximately 495 mm Hg (Ta- bles 1-3). Both pCO (mm Hg) and HCO− ltitudes ( n those fter 38 - ere determined by mea- 3.3. Blood Lactate Metabolism ing - 41 hours of accli- nographic Recordings ncreased wake- t < 0.01) and a parallel signifi- rial Oxygen leep- t-test 001) 65% of subjects took longer than their p [DFA]; SpaO2 Changes va- lues, tREM, REM, NREM + REM of the %SpaO2 SimplREM, REM of TST disclosed a sig- (mmol/L) signifi- cantly decreased at higher aTables 1-3); pCO2 and 3 HCO− values were significantly higher at 2050 m thaat 30/31 - 40/41 hours after reaching 3480 m. A decrease was also noted between measurements taken at 30 - 31 and 38 - 41 hours at 3480 m versus those after 6 h at 3480 m (Tables 1-3). The 3 HCO− concen- tration after 38 - 41 hours of acclimatization at 3480 m was lower than that measured after 30 - 31 hours at 3480 m (Tables 1-3). There was a statistically relevant increase in pH at high altitude compared to that measured at 122 m (Ta- bles 1-3). Comparison of the pH values at 2050 m with those recorded at 3480 m still showed an increase be- tween measurements taken after 6 and 30 hours of high- altitude exposure. Although other changes were not sta- tistically significant, pH values tended to decrease after 38 - 41 hours of high-altitude exposure (Tables 1 and 2). There was a significant linear decrease in all types of bases [BE], [BB], [BE active], [BE effective] (mmol/L) at high altitude (Tables 1 and 2). No significant changes were noted in the average he- matochemical values of venous blood samples collected from the brachial vein between 30 - 31 and 38 - 41 hours of acclimatization at 3480 m (Table 3). Nevertheless, there were statistical differences between SO2[%], pCO2, tCO2 (mmol/L) and pH levels in capillary and venous blood samples collected after 30 - 31 hours of acclimatization at 3480 m (Table 3). There were also statistically significant differences between the SO2[%], pCO2, tCO2, pH and 3 HCO− in capillary and venous blood samples taken a 41 hours of acclimatiza- tion at 3480 m (Table 3). 3.2. Electrolyte Metabolism Changes in electrolyte balance w suring the concentration of sodium [Na+] (mmol/L), po- tassium [K+] (mmol/L) and ionized calcium [iCa++] (mmol/L). The normal average electrolyte values barely changed at high altitude (Tables 1-3); the [Na+] and [K+] varied significantly at high altitude (Tables 1 and 2). During the waking state at low altitude, after reach 2050 m, and after 6, 30 - 31 and 38 matization at an altitude of 3480 m, the capillaryblood lac- tate values were consistently less than 2 mmol/L. None- theless, after 38 - 41 hours of acclimatization and two nights of sleep at 3480 m, the lactate values were signifi- cantly lower than those measured at 2050 m (Tables 1 and 2). 3.4. Polysom 3.4.1. EEG Recordings Sleep at 3480 m was characterized by i fulness ([W] 38.8%; Pt-tes cant decrease of 28% in non-REM sleep (NREM) (Pt-test < 0.0311) and of 11% in rapid eye movement (REM) sleep (Pt-test < 0,008). The total sleep time ([TST]; Pt-test < 0.01) decreased by 38.5% (Table 4). 3.4.2. Percentage of Peripheral Arte Saturation during Sleep The average %SpaO2 was significantly lower at a s ing altitude of 3480 m than at sea level (P < 0. (Table 4). 3.4.3. Subjective Perception of Sleep Quality We found that normal time to fall asleep (delay in falling aslee Table 4); 30% woke up 2 hours before the expected time and 60% woke up more than once. Sleep quality was per- ceived as significantly poorer at 3480 m than at 122 m (5.58 ± 1.8 vs 7.84 ± 1.47; P < 0.05); sleep duration was shorter and 60% of subjects felt poorly restored on wak- ing up. 3.4.4. ANOVA of Quantity and Quality Sleep and % ANOVA revealed significant differences in %SpaO2 he percent of W, N sleep, and in TST between measurements taken at 122 m and those at an altitude at 3480 m (Table 4(b)). 3.5. Other Statistical Analyses 3.5.1. Simple Regression Analysis Polysomnographic Data and Recorded during Sleep e regression analysis of the percent of W, N , NREM + REM sleep and nificant correlation between the changes in TST and the percent of REM sleep and the %SpaO2 changes recorded during sleep (Table 4(c)). 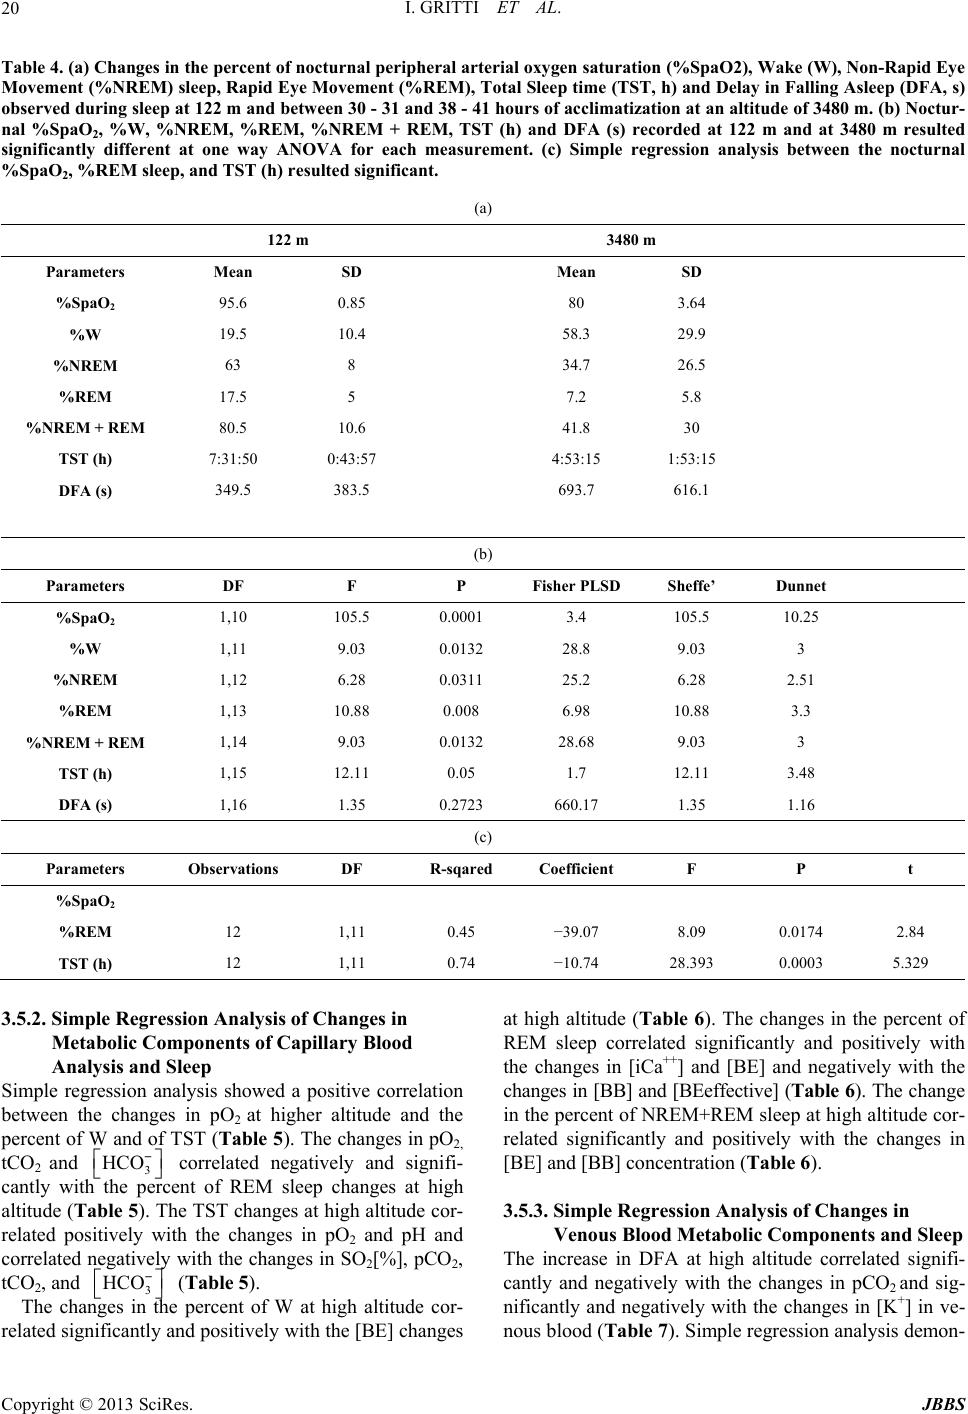 I. GRITTI ET AL. 20 Table 4. (a) Changes in the percent of nocturnal peripheral arl oxygen saturation (%SpaO2), Wake (W)ter, Non-Rapid Eye Movement (%NREM) sleep, Rapid Eye Movement (%REM), Total Sleep time (TST, h) and Delay in Falling Asleep (DFA, s) (a) 122 m 3480 m ia observed during sleep at 122 m and between 30 - 31 and 38 - 41 hours of acclimatization at an altitude of 3480 m. (b) Noctur- nal %SpaO2, %W, %NREM, %REM, %NREM + REM, TST (h) and DFA (s) recorded at 122 m and at 3480 m resulted significantly different at one way ANOVA for each measurement. (c) Simple regression analysis between the nocturnal %SpaO2, %REM sleep, and TST (h) resulted significant. Parameters Mean SD Mean SD %Spa O2 95.6 0.85 80 3.64 %W 19.5 10.4 58.3 29.9 %NREM %NM 1 7 0 4 1:53:15 (b) 63 8 34.7 26.5 %REM 17.5 5 7.2 5.8 REM + RE80.5 0.6 41.8 30 TST (h) :31:50:43:57 :53:15 DFA (s) 349.5 383.5 693.7 616.1 Parameters DF F P Fisher PLSD Sheffe’ Dunnet %Spa O2 1,10 10.1 05.5 0003.4 105.5 10.25 %W 1,11 9.03 0.0132 28.8 9.03 3 %NREM 2. %NM 3. 0 6 1,12 6.28 0.0311 25.2 6.28 51 %REM 1,13 10.88 0.008 6.98 10.88 3.3 REM + RE1,14 9.03 0.0132 28.68 9.03 3 TST (h) 1,15 12.11 0.05 1.7 12.11 48 DFA (s) 1,16 1.35 .272360.171.35 1.16 (c) Parameters Observations DF R-sqaefficient F P t red Co %Spa O2 %REM 12 1, 0. −38. 0.0174 2. 2 11 459.07 0984 TST (h) 12 1,11 0.74 −10.74 8.3930.0003 5.329 .5.2. Simple Regression Analysis of Changes in Simpl ation at high altitude (Table 6). The changes in the percent of ents and Sleep gnifi- 3 Metabolic Components of Capillary Blood Analysis and Sleep e regression analysis showed a positive correl between the changes in pO2 at higher altitude and the percent of W and of TST (Table 5). The changes in pO2, tCO2 and 3 HCO− correlated negatively and signifi- cantly with the percent of REM sleep changes at high altitude (Table 5). The TST changes at high altitude cor- related positively with the changes in pO2 and pH and correlated negatively with the changes in SO2[%], pCO2, tCO2, and 3 HCO− (Table 5). The changes in the percent of W at high altitude cor- related significantly and positively with the [BE] changes REM sleep correlated significantly and positively with the changes in [iCa++] and [BE] and negatively with the changes in [BB] and [BEeffective] (Table 6). The change in the percent of NREM+REM sleep at high altitude cor- related significantly and positively with the changes in [BE] and [BB] concentration (Table 6). 3.5.3. Simple Regression Analysis of Changes in Venous Blood Metabolic Compon The increase in DFA at high altitude correlated si cantly and negatively with the changes in pCO2 and sig- + nificantly and negatively with the changes in [K] in ve- nous blood (Table 7). Simple regression analysis demon- Copyright © 2013 SciRes. JBBS 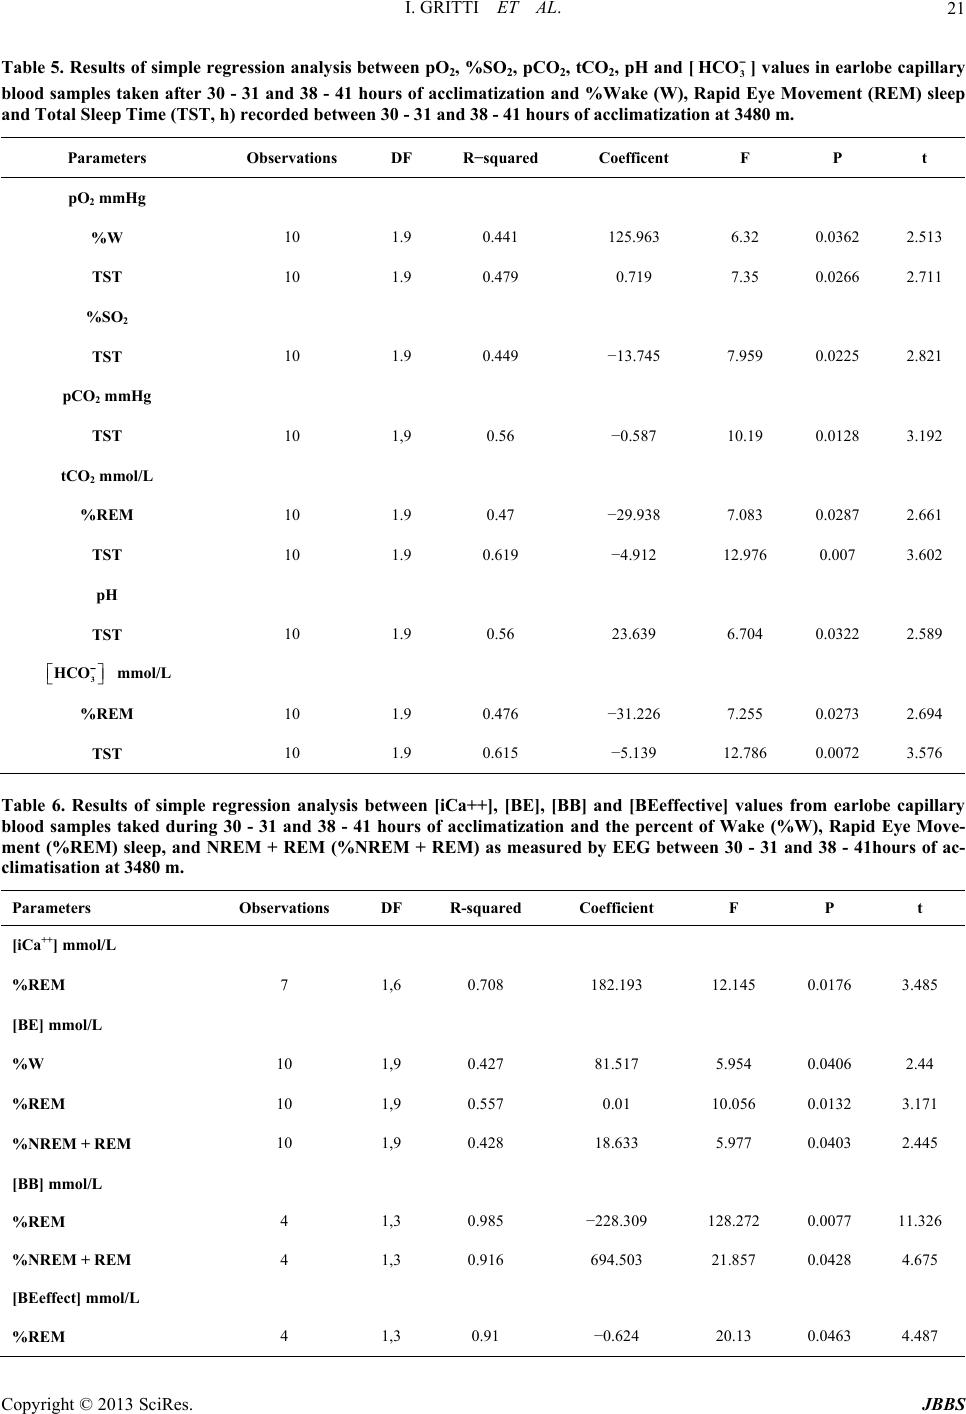 I. GRITTI ET AL. 21 Table 5. Results of simple regression analysis between pO2, %2, pCO2, tCO2, pH and [3 HCO −] values in earlobe capillary SO ation and P t blood samples taken after 30 - 31 and 38 - 41 hours of acclimatiz%Wake (W), Rapid Eye Movement (REM) sleep and Total Sleep Time (TST, h) recorded between 30 - 31 and 38 - 41 hours of acclimatization at 3480 m. Parameters Observations DF R−squared Coefficent F pO2 mmHg %W 10 1.125.3 6. 0.02 2. 0. −13. 0.0225 2. pCO Hg 0. −0.7 100.08 3. tCO 0. −29.0.0287 2. 0. 23.9 6.0.0322 2. HCO mol/L %R 0. −31.0.0273 2. 9 0.441 963236513 TST 10 1.9 0.479 0.719 7.35 0.0266 2.711 %SO2 TST 10 1.9 449 745 7.959 821 2 mm TST 10 1,9 5658.19 12192 2 mmol/L %REM 10 1.9 47938 7.083 661 TST 10 1.9 0.619 −4.912 12.976 0.007 3.602 pH TST 10 1.9 5663 704 589 3 − m EM 10 1.9 476 226 7.255 694 TST 10 1.9 0.615 −5.139 12.786 0.0072 3.576 ], [BE],Table 6. Rof simple regressionalysis bet [iCa++ [BB] anive] varome capy blood samples taked during 30 - 31 and 38 - 41 hours of acclimatization and the percent of Wake (%W), Rapid Eye Move- Observations DF R-squared Coefficient F P t esults anweend [BEeffectlues f earlobillar ment (%REM) sleep, and NREM + REM (%NREM + REM) as measured by EEG between 30 - 31 and 38 - 41hours of ac- climatisation at 3480 m. Parameters [iCa++] mmol/L %REM 7 10.182.3 12.5 0.0176 3.5 ol/L 10 1, 0.81.7 5.0.0406 2.4 + REM 1 1 0.−22 2 0.0077 11.26 + REM 10. −0.4 200.0463 4.7 ,6 708 191448 [BE] mm %W 9427 51954 4 %REM 10 1,9 0.557 0.01 10.056 0.0132 3.171 %NREM 10 1,9 0.428 8.6335.977 0.0403 2.445 [BB] mmol/L %REM 4 ,3 985 8.309 128.273 %NREM 4 1,3 0.916 694.503 21.857 0.0428 4.675 [BEeffect] mmol/L %REM 4 ,3 9162.13 48 Copyright © 2013 SciRes. JBBS 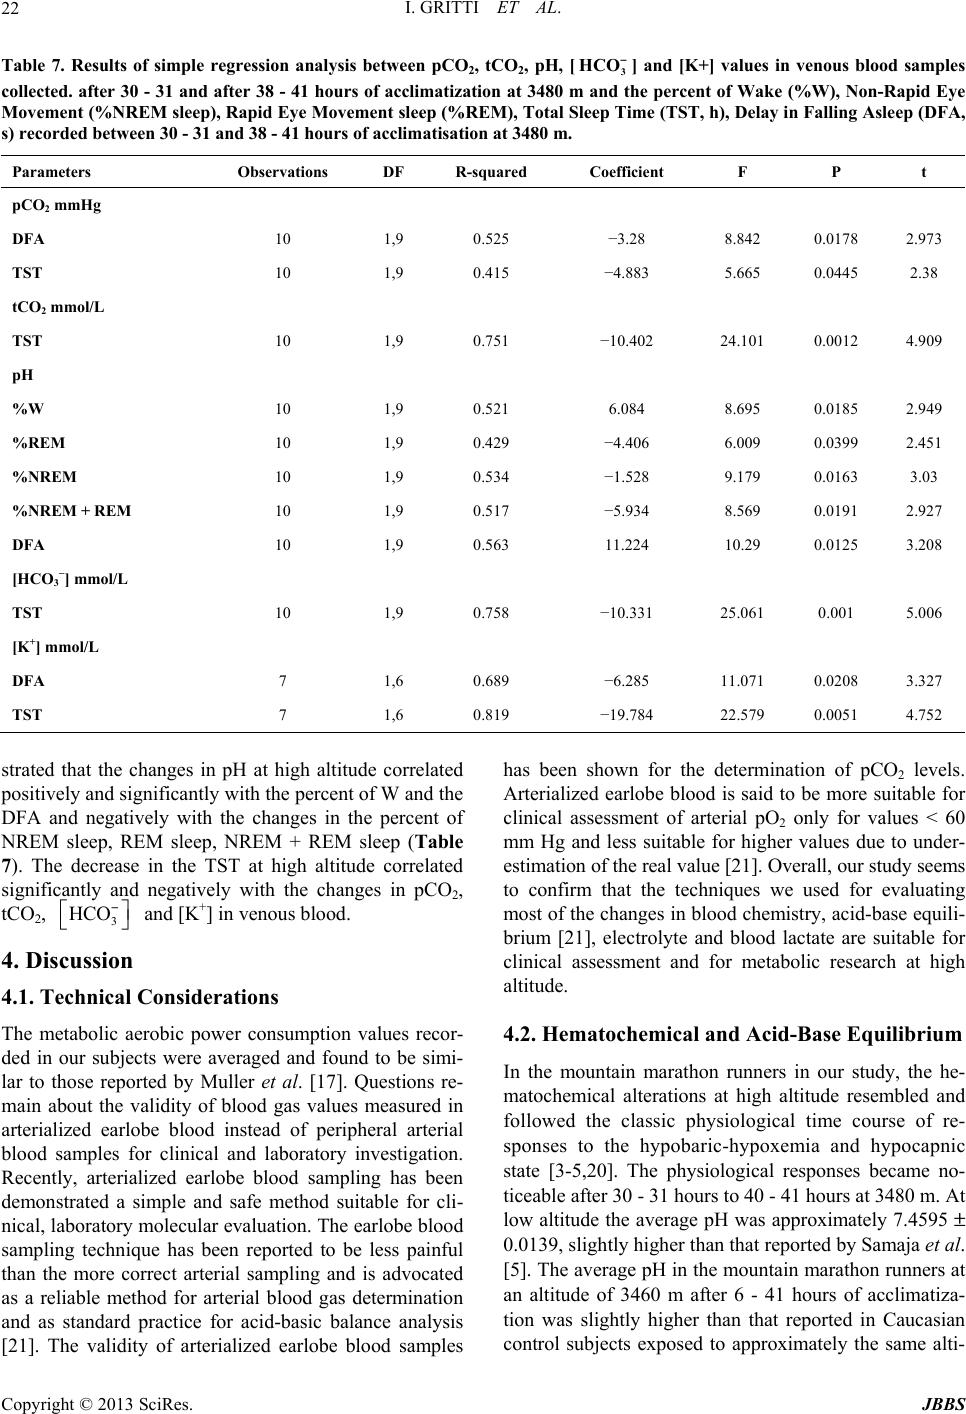 I. GRITTI ET AL. 22 Tesults of simple regressionalysis ben pC, pH, [H−nd [K+s in vlood samples nd the percent leep T Coefficient F P t able 7. Rn atweeO22, tCO3 CO] a] valueenous b collected. after 30 - 31 and after 38 - 41 hours of acclimatization at 3480 m aof Wake (%W), Non-Rapid Eye Movement (%NREM sleep), Rapid Eye Movement sleep (%REM), Total Sime (TST, h), Delay in Falling Asleep (DFA, s) recorded between 30 - 31 and 38 - 41 hours of acclimatisation at 3480 m. Parameters Observations DF R-squared pCO2 mmHg DFA 10 1, 0.−3.0.0178 2. ol/L 10 1, 0.−10.1 0.0012 4. 10 1, 0.6.8.0.0185 2. REM 3 −] mmol/L 10 1, 0.−10.1 0.5. mol/L 1 0.−6.5 111 0.08 3. 9525 28 8.842 973 TST 10 1,9 0.415 −4.883 5.665 0.0445 2.38 tCO2 mm TST 9751 402 24.10909 pH %W 9521 084 695 949 %REM 10 1,9 0.429 −4.406 6.009 0.0399 2.451 %NREM 10 1,9 0.534 −1.528 9.179 0.0163 3.03 %NREM +10 1,9 0.517 −5.934 8.569 0.0191 2.927 DFA 10 1,9 0.563 11.224 10.29 0.0125 3.208 [HCO TST 9758 331 25.06001 006 [K+] m DFA 7 ,6 689 28.0720327 TST 7 1,6 0.819 −19.784 22.579 0.0051 4.752 hat the changes in pH at high altitude correlated cussion onsiderations ption values recor- been shr the deination oO2 ntain marathon runners in our study, the he- matochemical alterations at high altitude resembled and strated t positively and significantly with the percent of W and the DFA and negatively with the changes in the percent of NREM sleep, REM sleep, NREM + REM sleep (Table 7). The decrease in the TST at high altitude correlated significantly and negatively with the changes in pCO2, tCO2, 3 HCO− and [K+] in venous blood. 4. Dis 4.1. Technical C The metabolic aerobic power consum ded in our subjects were averaged and found to be simi- lar to those reported by Muller et al. [17]. Questions re- main about the validity of blood gas values measured in arterialized earlobe blood instead of peripheral arterial blood samples for clinical and laboratory investigation. Recently, arterialized earlobe blood sampling has been demonstrated a simple and safe method suitable for cli- nical, laboratory molecular evaluation. The earlobe blood sampling technique has been reported to be less painful than the more correct arterial sampling and is advocated as a reliable method for arterial blood gas determination and as standard practice for acid-basic balance analysis [21]. The validity of arterialized earlobe blood samples Arterialized earlobe blood is said to be more suitable for clinical assessment of arterial pO2 only for values < 60 mm Hg and less suitable for higher values due to under- estimation of the real value [21]. Overall, our study seems to confirm that the techniques we used for evaluating most of the changes in blood chemistry, acid-base equili- brium [21], electrolyte and blood lactate are suitable for clinical assessment and for metabolic research at high altitude. 4.2. Hematochemical and Acid-Base Equilibrium In the mou has own fotermf pC levels. followed the classic physiological time course of re- sponses to the hypobaric-hypoxemia and hypocapnic state [3-5,20]. The physiological responses became no- ticeable after 30 - 31 hours to 40 - 41 hours at 3480 m. At low altitude the average pH was approximately 7.4595 ± 0.0139, slightly higher than that reported by Samaja et al. [5]. The average pH in the mountain marathon runners at an altitude of 3460 m after 6 - 41 hours of acclimatiza- tion was slightly higher than that reported in Caucasian control subjects exposed to approximately the same alti- Copyright © 2013 SciRes. JBBS  I. GRITTI ET AL. 23 tude [3-5]. In the mountain marathon runners, the average pCO2 at sea level was similar to that reported in by Samaja et al. [4]; after 41 hours of acclimatization and sleep at 3480 m, it was similar to that recorded in the Sherpas [4]. Th urs of acclimatization at 3480 m, a va nity and subsequently the blood pO a were reported in a st he average excess of is study demonstrates that: 1) at 122 m the average pO2 was similar to that previously reported in Table 1 by Samaja et al. [3-5]; 2) the average pO2 level observed in the mountain marathon runners after 6 hours at 3480 m was similar to that observed in the Caucasian subjects at 6450 m, and lower than that observed at 5050 m; 3) the average pO2 in the mountain marathon runners after 41 hours of acclimatization was nearly similar to that ob- served in the Caucasians and Sherpas at 3400 m after acclimatization [4]. The average %SpaO2 in the mountain marathoners af- ter 6 hours of acclimatization at 3480 m was similar to that observed at 6450 m by Samaja et al. and reached 83% after 30 - 31 ho lue similar to what Samaja et al. [3,4] reported after 5 weeks of acclimatization at 5050 m. It rose to 86% after 41 hours of acclimatization at 3480 m, which was very near the average values (88%) that Samaja et al. recorded in Caucasian subjects at 5050 m after several days of acclimatization [3,4]. In agreement with Samaja et al. [3-5], we suggest that (as in their Caucasian subjects) the metabolic response to respiratory alkalosis may have slightly but significantly improved blood O2 affi 2 level in our subjects (Table 1). The continuous decrease in pH, pCO2 and bicarbonate values collected after a night’s sleep and 41 hours of stay at 3480 m showed that compensation of respiratory alka- losis had been activated. Similar dat udy conducted many years ago [22]. In line with data reported by Weil [18], the %SpaO2 measured in our subjects during sleep, and between 30 - 31 and 38 - 41 hours of acclimatization at 3480 m, fluc- tuated between 65% and 84% [23]. T bases [BE] recorded after 40 - 41 hours of acclimati- zation to high altitude was 0.41 mmol/L and was higher than that considered necessary for reaching a physiologi- cal pH value. Of the bases excess, the average 3 HCO− closely followed the same trend as [BE], decreasing fairly consistently during acclimatization. In brief, in this study, a correct activation of compensation of respiratory alkalosis and acclimatization at 3480 m was de- ted by the linear decrease in the bases excess. The de- crease in [BE] was not sufficient to normalize the pH, even after 41 hours of acclimatization at 3480 m; none- theless, it was probably the best value that could be reached at that altitude at a PB of 490 mm Hg [3-5] and with the chosen exercise and dietary regimen [20]. 4.3. Electrolyte Metabolism While alterations were noted in acid-base metabolism, the concentration of [Na+], [K+] and [iCa++] ions re- mained within the normal range. We found that, u monstra nder creased after 6 hours of urned to the values ob- as aerobic through- o 3480 m. The de- d at sea level significantly e t of noO2 taken every 30 seconds can be used oreceptor activation of th controlled conditions, the [Na+] in exposure to high altitude but ret served at 122 m within 41 hours of exposure at 3480 m. 4.4. Blood Lactate Metabolism On average, blood lactate levels after a night’s sleep and 41 hours of acclimatization at 3480 m were lower than those observed during the wakeful state. Our data show that the peripheral metabolic pathway w out acclimatization from 2050 m t crease in blood lactate values observed after 41 hours of acclimatization and a sleeping altitude of 3480 m sug- gests that the aerobic power of mountain marathon run- ners at rest improves [20,24]. 4.5. Subjective Perception of Sleep Quality and Quantity The decrease in the nocturnal %SpaO2 values at high altitude versus those measure correlated with the significant decrease in total sleep tim (TST) and %REM sleep, indicating that the measuremen cturnal %Spa as an index of sleep quantity and quality. It is also very important for evaluating the degree of acclimatization to high altitude and for indicating the risk of altered states of consciousness, as described by Finnegan et al. [19]. Importantly, unlike these authors, we found no paroxys- mal figures on the EEG tracings. In this study, one of the factors underlying the de- crease in NREM and REM sleep was significantly corre- lated with the decrease in nocturnal %SpaO2. Altitude- induced low arterial oxygen pressure might have elicited cortical arousal via afferent chem e ascending reticular activating system located in the brain stem reticular formation. This mechanism may ex- plain the decrease in NREM and REM sleep in the mountain marathon runners. In other words, at a baro- metric pressure of 495 mm Hg in the hypoxic-hypobaric conditions of this study, the nocturnal pO2/pCO2 ratio most likely may have played, cyclically, a critical role in activating directly and/or indirectly the bulbo-pontine and hypothalamic reticular activating system involved in the behavioral and metabolic integration of autonomic, car- diovascular and respiratory functions and in cortical arousal. 5. Conclusion Overall, our results suggest that monitoring the time Copyright © 2013 SciRes. JBBS  I. GRITTI ET AL. 24 course of changes in blood chemistry, acid-base balance, electrolyte and blood lactate metabolism during the w ful state and the nocturnal %SpaO2 during sleep may help or assessing how well mountain mara- NCES doi:10.2165/00007256-199520030-00003 ake- to set new criteria f thon runners acclimatize to high-altitude exposure and for predicting the quality of their refreshed sleep. Study- ing the time course of acclimatization to high altitude is a fundamental part of the correct physiological approach to exercise training at high altitude and essential for pre- paring athletes to live and exercise at high altitude. 6. Acknowledgements We are indebted to the Federation of Sports at Altitude (Biella, Italy) for funding since 1994. We are indebted to the Roche Diagnostics S.p.A, Monza, Italy REFERE [1] J. H. Coote, “Medicine and Mechanisms in Altitude Sick- ness. Recommendations,” Sports of Medicine, Vol. 20, No. 3, 1995, pp. 148-159. [2] P. H. Hacketth-Altitude Illness,” New England l. 25, No. 17, 2001, 1046/j.1365-201X.1997.574342000.x and R. C. Roach, “Hig Journal of Medicine, Vo pp. 1279-1280. [3] M. Samaja, “Blood Gas Transport at High Altitude,” Res- piration, Vol. 64, 1997, pp. 422-428. [4] M. Samaja, C. Mariani, A. Prestini and P. Ceretelli, “Acid Base Balance and O2 Transport at High Altitude,” Acta Physiological Scandinavica, Vol. 159, No. 3, 1997, pp. 249-256. doi:10. de: Role of th [5] M. Samaja, T. Crespi, M. Guazzi and K. D. Vandergriff, “Oxygen Transport in Blood in Altitue He- moglobin-Oxygen Affinity and Impact of the Phenomena Related to Hemoglobinallosterism and Red Cell Func- tion,” European Journal Applied Physiology, Vol. 90, No. 3-4, 2003, pp. 351-359. doi:10.1007/s00421-003-0954-8 [6] G. S. Roi, M. Giacometti, G. Banfi, M. Zaccaria, I. Gritti and S. P. Von Duvillard, “Competitive Running at High Altitude, Is It Safe?” Medicine Science Sports Exercise, Vol. 3, No. 5, 1999, p. S861. [7] G. Banfi, M. Marinelli, G. S. Roi, A. Colombini, M. Pon- tillo, M. Giacometti and S. Wade “Growth Hormone and Insulin-Like Growth Factor I in Athletes Performing a Marathon at 4000 m of Altitude,” Growth Regulation, Vol. 4, No. 2, 1994, pp. 82-86. [8] G. Banfi, M. Marinelli, G. S. Roi and M. Giacometti, “Platelet Indices in Athletes Performing a Race in Alti- tude Environment,” Journal of Clinical Laboratory Ana- lysis, Vol. 9, No. 1, 1995, pp. 34-36. doi:10.1002/jcla.1860090106 [9] G. Banfi, M. Marinelli, P. Bonini, I. Gritti and G. S. Roi, “Pepsinogens and Gastrointestinal Symptoms in Moun- tain Marathon Runners,” International Journal Sports Medicine, Vol. 17, No. 8, 1996, pp. 554-558. doi:10.1055/s-2007-972894 [10] G. Banfi, M. Pontillo, M. Marinelli, A. Dolci and G. S. olci, “Erythrocytes, Haemo- atology,” The Journal of Sports Me- l Parameters in Athletes Performing Mara- Roi, “Thyrotropin and Free Thyroid Hormones in Ath- letes during and after Ultra Endurance Sport Perform- ances,” Journal Clinical Ligand Assay, Vol. 21, No. 3, 1998, pp. 331-334. [11] G. Banfi, G. S. Roi and A. D globin and Packed Cell Volume in Athletes Performing Races in Altitude Environment,” Haematologica, Vol. 85, 2000, p. E12. [12] G. Banfi and A. Dolci, “Preanalytical Phase of Sport Bio- chemistry and Haem dicine and Physical Fitness, Vol. 43, No. 2, 2003, pp. 223-230. [13] G. Banfi, G. S. Roi, A. Dolci and D. Susta, “Behaviour of Haematologica thon and Ultramarathon in Altitude (‘skyrunners’),” Cli- nical Laboratory Haematologica, Vol. 26, No. 6, 2004, pp. 1-5. doi:10.1111/j.1365-2257.2004.00642.x [14] G. Fragasso, A. Palloshi, S. Roi, E. Rossetti, G. Monaco, A. Dolci, A. Margonato and S. Chierchia, “Transient Left Ventricular Diastolic Dysfunction Following Strenuous Exercise,” Sport Science Health, Vol. 1, No. 1, 2004, pp. 31-35. doi:10.1007/s11332-004-0007-7 [15] M. Marinelli, G. S. Roi, M. Giacometti, P. Bovini and G. Banfi, “Cortisol, Testosterone and Free Testosterone in Athletes Performing a Marathon at 4000 m of Altitude,” Hormon Research, Vol. 41, No. 5-6, 1994, pp. 225-229. doi:10.1159/000183929 [16] G. Pelamatti, M. Pascotto and C. Semenza, “Verbal Free Recall in High Altitude: Proper Names vs Common Names,” Cortex, Vol. 39, No. 1, 2003, pp. 97-103. doi:10.1016/S0010-9452(08)70077-7 [17] C. Murrell, L. Wilson, J. D. Cotter, S. Lucas, S. Ogoh, G. Keith and N. Ainslie, “Alteration in Autonomic Function and Cerebral Hemodynamics to Orthostatic Challenge Following a Mountain Marathon,” Journal Applied Phy- siology, Vol. 103, No. 1, 2007, pp. 88-96. doi:10.1152/japplphysiol.01396.2006 [18] J. V. Weil, “Sleep at High Altitude,” In: M. H. Kryger, T. Roth and W. C. Dement, Eds., Principle and Practice of Sleep Medicine, W. B. Sauders Company, Toronto, 1989, pp. 269-276. [19] T. P. Finnegan, P. Abraham and T. B. Doch latory Monitoring of the Electroencep erty, “Ambu- halogram in High Altitude Mountaineers,” Electroencephalography & Cli- nical Neurophysiology, Vol. 60, No. 3, 1985, pp. 220-224. doi:10.1016/0013-4694(85)90034-3 [20] B. Kayser, “Nutrition and Energetics of Exercise at Alti- tude,” Sports Medicine, Vol. 17, No. 5, 1994, pp. 309-323. doi:10.2165/00007256-199417050-00004 [21] A. Sauty, L. F. Uldry, P. Debetaz, P. Leuenberger and J. W. Fitting, “Differences in PO2 and PCO2 between Arte- rial and Arterialized Earlobe Samples,” European Respi- ratory Journal, Vol. 9, No. 2, 1996, pp. 186-189. doi:10.1183/09031936.96.09020186 [22] J. E. Hansen, G. P. Stelter and J. A. Vogel, “Arterial Py- ruvate, Lactate, pH and pCO2 during Work at Sea Level and High Altitude,” Journal Applied Physiology, Vol. 23, Copyright © 2013 SciRes. JBBS  I. GRITTI ET AL. Copyright © 2013 SciRes. JBBS 25 and J Saturation in Rela-75, No. 4, 1967, pp. 523-530. [23] H. Normand, M. Barragan, O. Benoit, O. Bailliart Raynaud, “Periodic Breathing and O . [24 2 tion to Sleep Stages at High Altitude,” Aviation Space Environ Medicine, Vol. 61, No. 3, 1990, pp. 229-235. ] B. Kayser, G. Ferretti, B. Grassi, T. Binzoni and P. Cere- telli, “Maximal Lactic Capacity at Altitude: Effect of Bi- carbonate Loading,” Journal Ap plie d Physiology, Vol. No. 3, 1995, pp. 1070-1074.
|