Paper Menu >>
Journal Menu >>
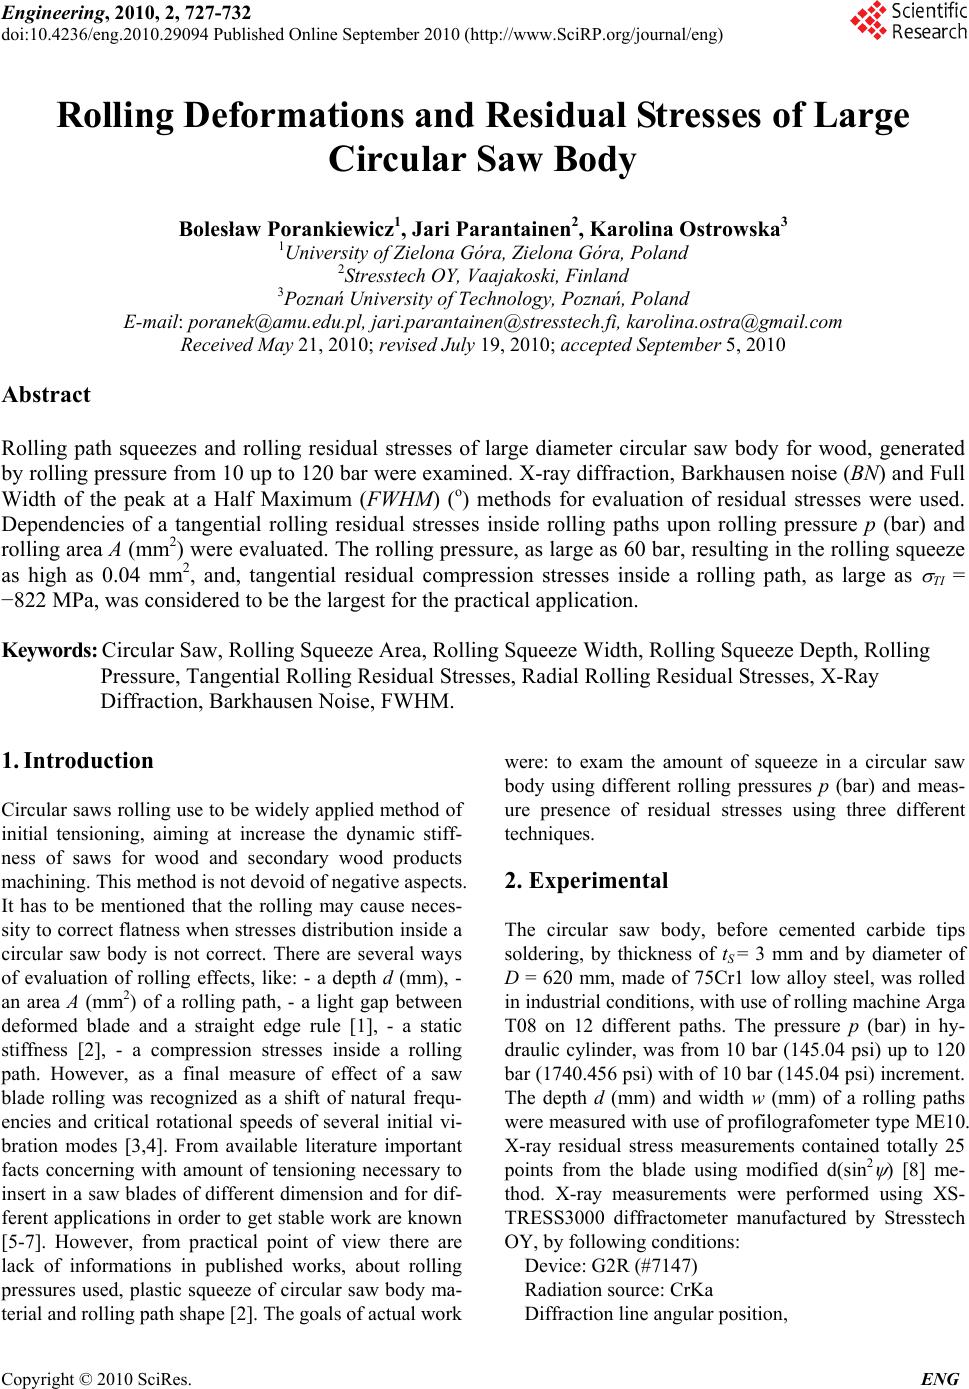 Engineering, 2010, 2, 727-732 doi:10.4236/eng.2010.29094 Published Online September 2010 (http://www.SciRP.org/journal/eng) Copyright © 2010 SciRes. ENG Rolling Deformations and Residual Stresses of Large Circular Saw Body Bolesław Porankiewicz1, Jari Parantainen2, Karolina Ostrowska3 1University of Zielona Góra, Zielona Góra, Poland 2Stresstech OY, Vaajakoski, Finland 3Poznań University of Technology, Poznań, Poland E-mail: poranek@amu.edu.pl, jari.parantainen@stresstech.fi, karolina.ostra@gmail.com Received May 21, 2010; revised July 19, 2010; accepted September 5, 2010 Abstract Rolling path squeezes and rolling residual stresses of large diameter circular saw body for wood, generated by rolling pressure from 10 up to 120 bar were examined. X-ray diffraction, Barkhausen noise (BN) and Full Width of the peak at a Half Maximum (FWHM) (o) methods for evaluation of residual stresses were used. Dependencies of a tangential rolling residual stresses inside rolling paths upon rolling pressure p (bar) and rolling area A (mm2) were evaluated. The rolling pressure, as large as 60 bar, resulting in the rolling squeeze as high as 0.04 mm2, and, tangential residual compression stresses inside a rolling path, as large as TI = −822 MPa, was considered to be the largest for the practical application. Keywords: Circular Saw, Rolling Squeeze Area, Rolling Squeeze Width, Rolling Squeeze Depth, Rolling Pressure, Tangential Rolling Residual Stresses, Radial Rolling Residual Stresses, X-Ray Diffraction, Barkhausen Noise, FWHM. 1. Introduction Circular saws rolling use to be widely applied method of initial tensioning, aiming at increase the dynamic stiff- ness of saws for wood and secondary wood products machining. This method is not devoid of negative aspects. It has to be mentioned that the rolling may cause neces- sity to correct flatness when stresses distribution inside a circular saw body is not correct. There are several ways of evaluation of rolling effects, like: - a depth d (mm), - an area A (mm2) of a rolling path, - a light gap between deformed blade and a straight edge rule [1], - a static stiffness [2], - a compression stresses inside a rolling path. However, as a final measure of effect of a saw blade rolling was recognized as a shift of natural frequ- encies and critical rotational speeds of several initial vi- bration modes [3,4]. From available literature important facts concerning with amount of tensioning necessary to insert in a saw blades of different dimension and for dif- ferent applications in order to get stable work are known [5-7]. However, from practical point of view there are lack of informations in published works, about rolling pressures used, plastic squeeze of circular saw body ma- terial and rolling path shape [2]. The goals of actual work were: to exam the amount of squeeze in a circular saw body using different rolling pressures p (bar) and meas- ure presence of residual stresses using three different techniques. 2. Experimental The circular saw body, before cemented carbide tips soldering, by thickness of tS = 3 mm and by diameter of D = 620 mm, made of 75Cr1 low alloy steel, was rolled in industrial conditions, with use of rolling machine Arga T08 on 12 different paths. The pressure p (bar) in hy- draulic cylinder, was from 10 bar (145.04 psi) up to 120 bar (1740.456 psi) with of 10 bar (145.04 psi) increment. The depth d (mm) and width w (mm) of a rolling paths were measured with use of profilografometer type ME10. X-ray residual stress measurements contained totally 25 points from the blade using modified d(sin2 ) [8] me- thod. X-ray measurements were performed using XS- TRESS3000 diffractometer manufactured by Stresstech OY, by following conditions: Device: G2R (#7147) Radiation source: CrKa Diffraction line angular position, 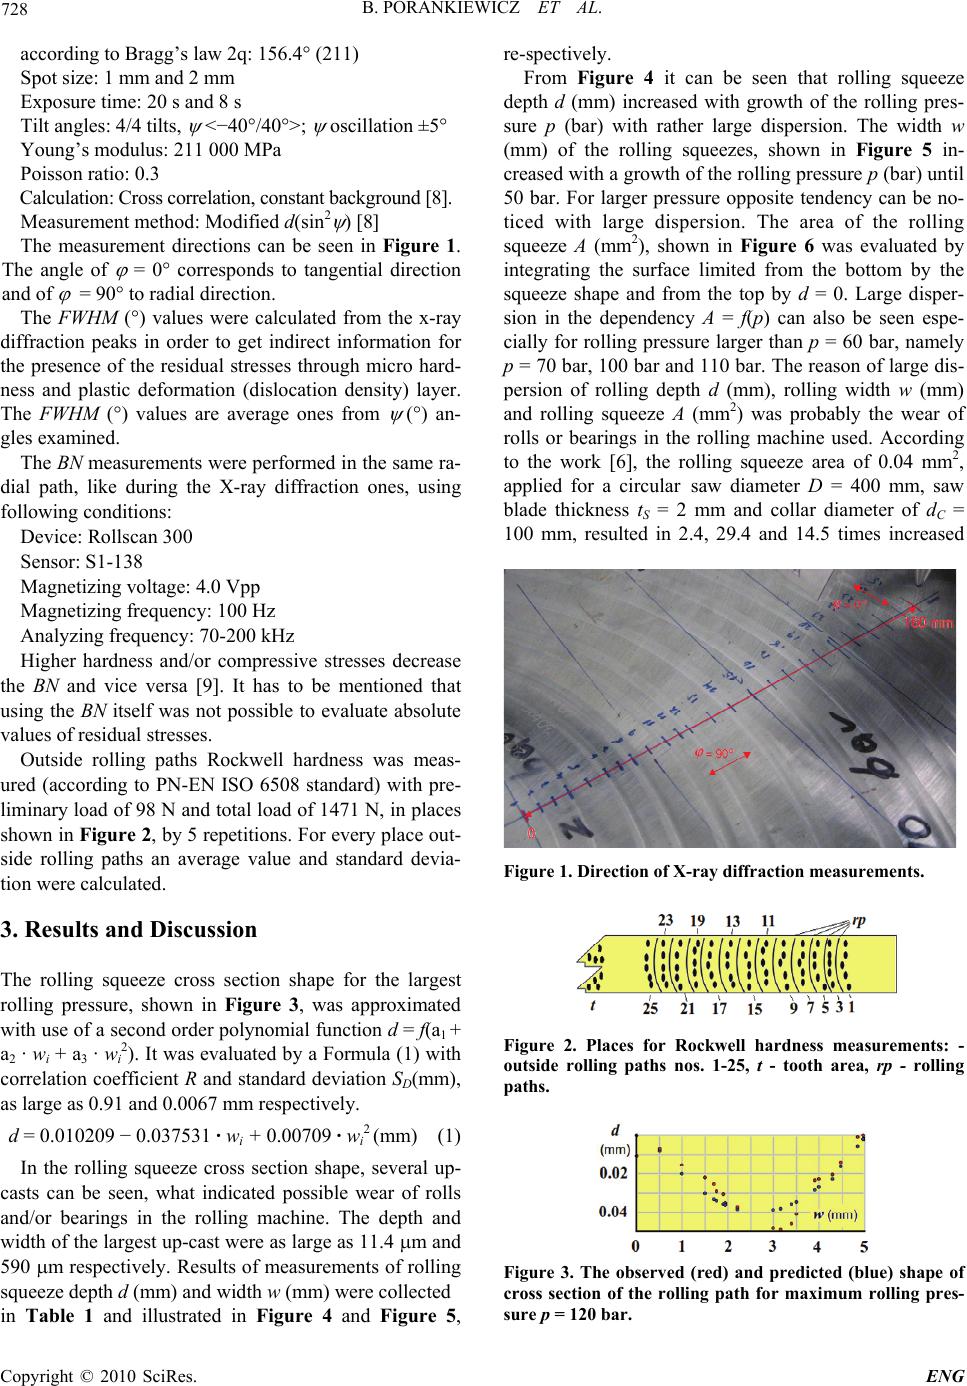 B. PORANKIEWICZ ET AL. Copyright © 2010 SciRes. ENG 728 according to Bragg’s law 2q: 156.4° (211) Spot size: 1 mm and 2 mm Exposure time: 20 s and 8 s Tilt angles: 4/4 tilts, <−40°/40°>; oscillation ±5° Young’s modulus: 211 000 MPa Poisson ratio: 0.3 Calculation: Cross correlation, constant background [8]. Measurement method: Modified d(sin2 ) [8] The measurement directions can be seen in Figure 1. The angle of = 0° corresponds to tangential direction and of = 90° to radial direction. The FWHM (°) values were calculated from the x-ray diffraction peaks in order to get indirect information for the presence of the residual stresses through micro hard- ness and plastic deformation (dislocation density) layer. The FWHM (°) values are average ones from (°) an- gles examined. The BN measurements were performed in the same ra- dial path, like during the X-ray diffraction ones, using following conditions: Device: Rollscan 300 Sensor: S1-138 Magnetizing voltage: 4.0 Vpp Magnetizing frequency: 100 Hz Analyzing frequency: 70-200 kHz Higher hardness and/or compressive stresses decrease the BN and vice versa [9]. It has to be mentioned that using the BN itself was not possible to evaluate absolute values of residual stresses. Outside rolling paths Rockwell hardness was meas- ured (according to PN-EN ISO 6508 standard) with pre- liminary load of 98 N and total load of 1471 N, in places shown in Figure 2, by 5 repetitions. For every place out- side rolling paths an average value and standard devia- tion were calculated. 3. Results and Discussion The rolling squeeze cross section shape for the largest rolling pressure, shown in Figure 3, was approximated with use of a second order polynomial function d = f(a1 + a2 · wi + a3 · wi 2). It was evaluated by a Formula (1) with correlation coefficient R and standard deviation SD(mm), as large as 0.91 and 0.0067 mm respectively. d = 0.010209 − 0.037531 · wi + 0.00709 · wi 2 (mm) (1) In the rolling squeeze cross section shape, several up- casts can be seen, what indicated possible wear of rolls and/or bearings in the rolling machine. The depth and width of the largest up-cast were as large as 11.4 m and 590 m respectively. Results of measurements of rolling squeeze depth d (mm) and width w (mm) were collected in Table 1 and illustrated in Figure 4 and Figure 5, re-spectively. From Figure 4 it can be seen that rolling squeeze depth d (mm) increased with growth of the rolling pres- sure p (bar) with rather large dispersion. The width w (mm) of the rolling squeezes, shown in Figure 5 in- creased with a growth of the rolling pressure p (bar) until 50 bar. For larger pressure opposite tendency can be no- ticed with large dispersion. The area of the rolling squeeze A (mm2), shown in Figure 6 was evaluated by integrating the surface limited from the bottom by the squeeze shape and from the top by d = 0. Large disper- sion in the dependency A = f(p) can also be seen espe- cially for rolling pressure larger than p = 60 bar, namely p = 70 bar, 100 bar and 110 bar. The reason of large dis- persion of rolling depth d (mm), rolling width w (mm) and rolling squeeze A (mm2) was probably the wear of rolls or bearings in the rolling machine used. According to the work [6], the rolling squeeze area of 0.04 mm2, applied for a circular saw diameter D = 400 mm, saw blade thickness tS = 2 mm and collar diameter of dC = 100 mm, resulted in 2.4, 29.4 and 14.5 times increased Figure 1. Direction of X-ray diffraction measurements. Figure 2. Places for Rockwell hardness measurements: - outside rolling paths nos. 1-25, t - tooth area, rp - rolling paths. Figure 3. The observed (red) and predicted (blue) shape of cross section of the rolling path for maximum rolling pres- sure p = 120 bar. 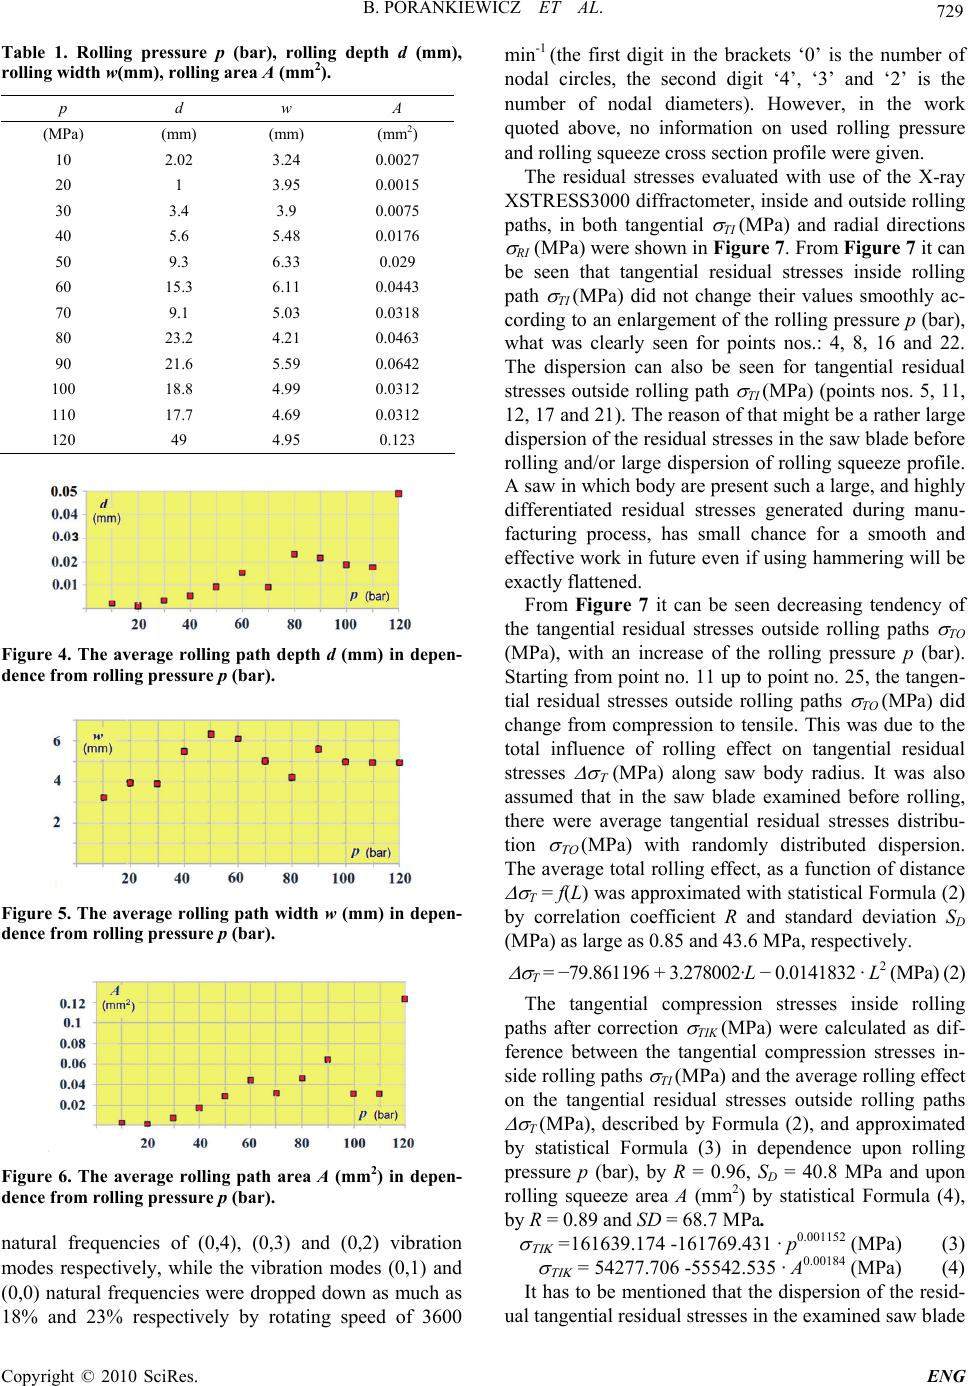 B. PORANKIEWICZ ET AL. Copyright © 2010 SciRes. ENG 729 Table 1. Rolling pressure p (bar), rolling depth d (mm), rolling width w(mm), rolling area A (mm2). p d w A (MPa) (mm) (mm) (mm2) 10 2.02 3.24 0.0027 20 1 3.95 0.0015 30 3.4 3.9 0.0075 40 5.6 5.48 0.0176 50 9.3 6.33 0.029 60 15.3 6.11 0.0443 70 9.1 5.03 0.0318 80 23.2 4.21 0.0463 90 21.6 5.59 0.0642 100 18.8 4.99 0.0312 110 17.7 4.69 0.0312 120 49 4.95 0.123 Figure 4. The average rolling path depth d (mm) in depen- dence from rolling pressure p (bar). Figure 5. The average rolling path width w (mm) in depen- dence from rolling pressure p (bar). Figure 6. The average rolling path area A (mm2) in depen- dence from rolling pressure p (bar). natural frequencies of (0,4), (0,3) and (0,2) vibration modes respectively, while the vibration modes (0,1) and (0,0) natural frequencies were dropped down as much as 18% and 23% respectively by rotating speed of 3600 min-1 (the first digit in the brackets ‘0’ is the number of nodal circles, the second digit ‘4’, ‘3’ and ‘2’ is the number of nodal diameters). However, in the work quoted above, no information on used rolling pressure and rolling squeeze cross section profile were given. The residual stresses evaluated with use of the X-ray XSTRESS3000 diffractometer, inside and outside rolling paths, in both tangential TI (MPa) and radial directions RI (MPa) were shown in Figure 7. From Figure 7 it can be seen that tangential residual stresses inside rolling path TI (MPa) did not change their values smoothly ac- cording to an enlargement of the rolling pressure p (bar), what was clearly seen for points nos.: 4, 8, 16 and 22. The dispersion can also be seen for tangential residual stresses outside rolling path TI (MPa) (points nos. 5, 11, 12, 17 and 21). The reason of that might be a rather large dispersion of the residual stresses in the saw blade before rolling and/or large dispersion of rolling squeeze profile. A saw in which body are present such a large, and highly differentiated residual stresses generated during manu- facturing process, has small chance for a smooth and effective work in future even if using hammering will be exactly flattened. From Figure 7 it can be seen decreasing tendency of the tangential residual stresses outside rolling paths TO (MPa), with an increase of the rolling pressure p (bar). Starting from point no. 11 up to point no. 25, the tangen- tial residual stresses outside rolling paths TO (MPa) did change from compression to tensile. This was due to the total influence of rolling effect on tangential residual stresses (MPa) along saw body radius. It was also assumed that in the saw blade examined before rolling, there were average tangential residual stresses distribu- tion (MPa) with randomly distributed dispersion. The average total rolling effect, as a function of distance T = f(L) was approximated with statistical Formula (2) by correlation coefficient R and standard deviation SD (MPa) as large as 0.85 and 43.6 MPa, respectively. T = −79.861196 + 3.278002·L − 0.0141832 · L2 (MPa) (2) The tangential compression stresses inside rolling paths after correction TIK (MPa) were calculated as dif- ference between the tangential compression stresses in- side rolling paths TI (MPa) and the average rolling effect on the tangential residual stresses outside rolling paths T (MPa), described by Formula (2), and approximated by statistical Formula (3) in dependence upon rolling pressure p (bar), by R = 0.96, SD = 40.8 MPa and upon rolling squeeze area A (mm2) by statistical Formula (4), by R = 0.89 and SD = 68.7 MPa. =161639.174 -161769.431 · p0.001152 (MPa) (3) = 54277.706 -55542.535 · A0.00184 (MPa) (4) It has to be mentioned that the dispersion of the resid- ual tangential residual stresses in the examined saw blade 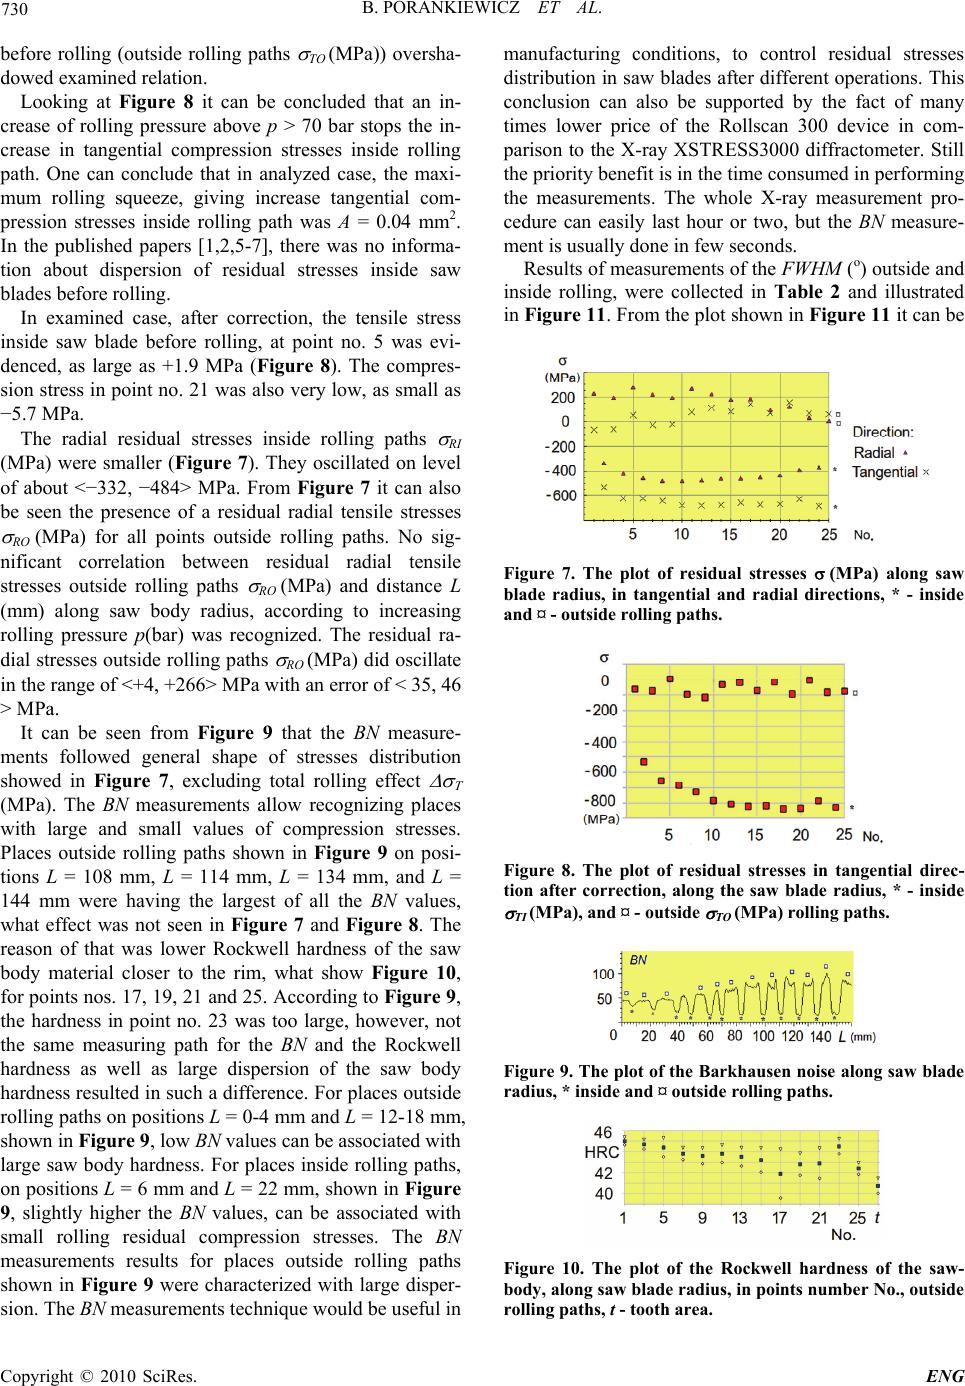 B. PORANKIEWICZ ET AL. Copyright © 2010 SciRes. ENG 730 before rolling (outside rolling paths TO (MPa)) oversha- dowed examined relation. Looking at Figure 8 it can be concluded that an in- crease of rolling pressure above p > 70 bar stops the in- crease in tangential compression stresses inside rolling path. One can conclude that in analyzed case, the maxi- mum rolling squeeze, giving increase tangential com- pression stresses inside rolling path was A = 0.04 mm2. In the published papers [1,2,5-7], there was no informa- tion about dispersion of residual stresses inside saw blades before rolling. In examined case, after correction, the tensile stress inside saw blade before rolling, at point no. 5 was evi- denced, as large as +1.9 MPa (Figure 8). The compres- sion stress in point no. 21 was also very low, as small as −5.7 MPa. The radial residual stresses inside rolling paths RI (MPa) were smaller (Figure 7). They oscillated on level of about <−332, −484> MPa. From Figure 7 it can also be seen the presence of a residual radial tensile stresses RO (MPa) for all points outside rolling paths. No sig- nificant correlation between residual radial tensile stresses outside rolling paths RO (MPa) and distance L (mm) along saw body radius, according to increasing rolling pressure p(bar) was recognized. The residual ra- dial stresses outside rolling paths RO (MPa) did oscillate in the range of <+4, +266> MPa with an error of < 35, 46 > MPa. It can be seen from Figure 9 that the BN measure- ments followed general shape of stresses distribution showed in Figure 7, excluding total rolling effect (MPa). The BN measurements allow recognizing places with large and small values of compression stresses. Places outside rolling paths shown in Figure 9 on posi- tions L = 108 mm, L = 114 mm, L = 134 mm, and L = 144 mm were having the largest of all the BN values, what effect was not seen in Figure 7 and Figure 8. The reason of that was lower Rockwell hardness of the saw body material closer to the rim, what show Figure 10, for points nos. 17, 19, 21 and 25. According to Figure 9, the hardness in point no. 23 was too large, however, not the same measuring path for the BN and the Rockwell hardness as well as large dispersion of the saw body hardness resulted in such a difference. For places outside rolling paths on positions L = 0-4 mm and L = 12-18 mm, shown in Figure 9, low BN values can be associated with large saw body hardness. For places inside rolling paths, on positions L = 6 mm and L = 22 mm, shown in Figure 9, slightly higher the BN values, can be associated with small rolling residual compression stresses. The BN measurements results for places outside rolling paths shown in Figure 9 were characterized with large disper- sion. The BN measurements technique would be useful in manufacturing conditions, to control residual stresses distribution in saw blades after different operations. This conclusion can also be supported by the fact of many times lower price of the Rollscan 300 device in com- parison to the X-ray XSTRESS3000 diffractometer. Still the priority benefit is in the time consumed in performing the measurements. The whole X-ray measurement pro- cedure can easily last hour or two, but the BN measure- ment is usually done in few seconds. Results of measurements of the FWHM (o) outside and inside rolling, were collected in Table 2 and illustrated in Figure 11. From the plot shown in Figure 11 it can be Figure 7. The plot of residual stresses (MPa) along saw blade radius, in tangential and radial directions, * - inside and ¤ - outside rolling paths. Figure 8. The plot of residual stresses in tangential direc- tion after correction, along the saw blade radius, * - inside TI (MPa), and ¤ - outside TO (MPa) rolling paths. Figure 9. The plot of the Barkhausen noise along saw blade radius, * inside and ¤ outside rolling paths. Figure 10. The plot of the Rockwell hardness of the saw- body, along saw blade radius, in points number No., outside rolling paths, t - tooth area. 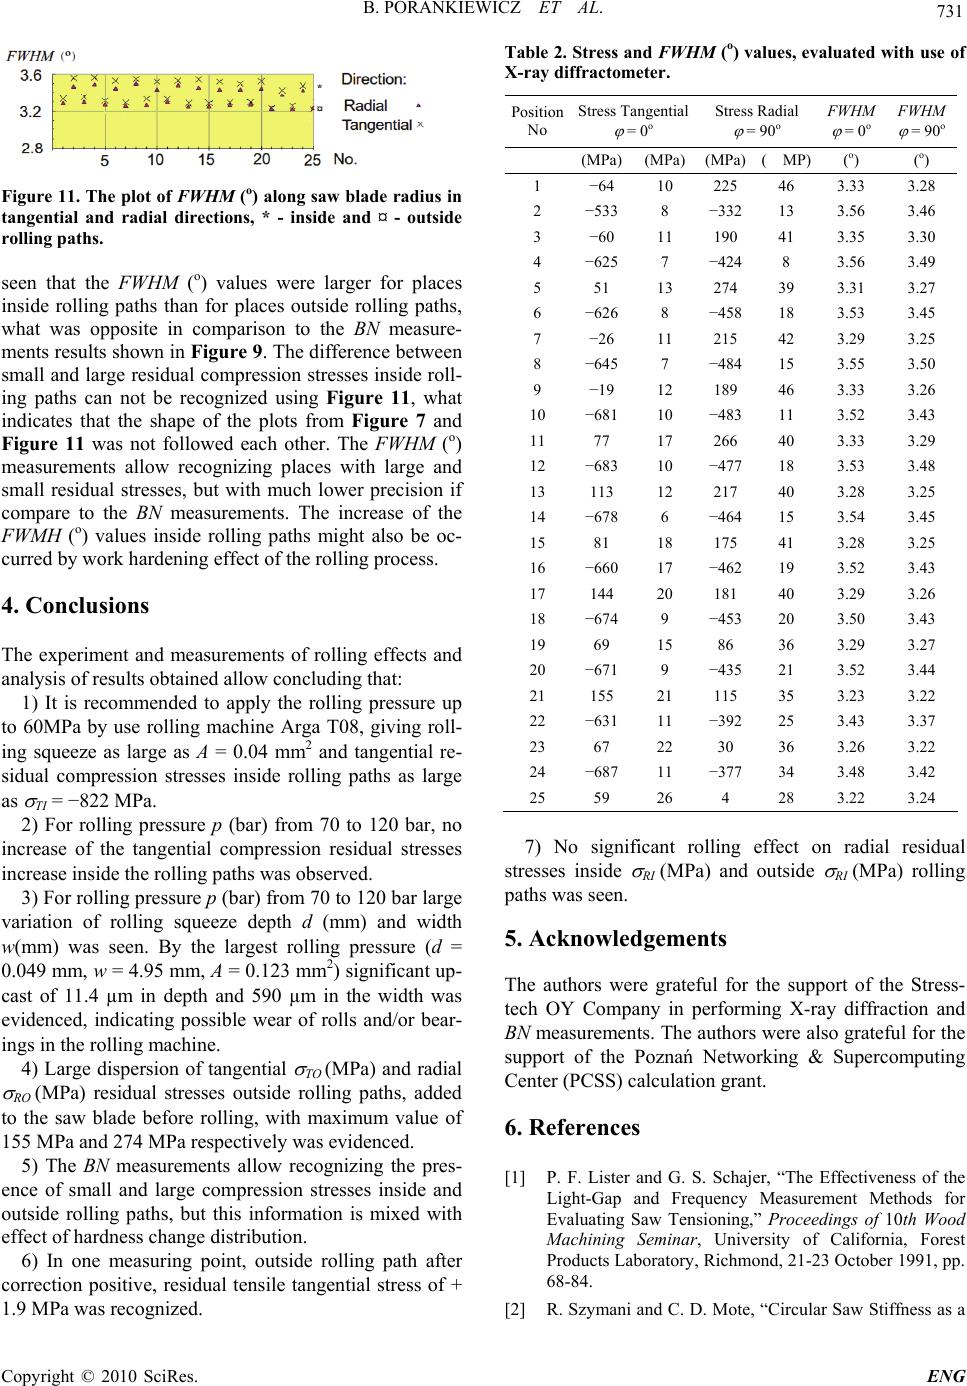 B. PORANKIEWICZ ET AL. Copyright © 2010 SciRes. ENG 731 Figure 11. The plot of FWHM (o) along saw blade radius in tangential and radial directions, * - inside and ¤ - outside rolling paths. seen that the FWHM (o) values were larger for places inside rolling paths than for places outside rolling paths, what was opposite in comparison to the BN measure- ments results shown in Figure 9. The difference between small and large residual compression stresses inside roll- ing paths can not be recognized using Figure 11, what indicates that the shape of the plots from Figure 7 and Figure 11 was not followed each other. The FWHM (o) measurements allow recognizing places with large and small residual stresses, but with much lower precision if compare to the BN measurements. The increase of the FWMH (o) values inside rolling paths might also be oc- curred by work hardening effect of the rolling process. 4. Conclusions The experiment and measurements of rolling effects and analysis of results obtained allow concluding that: 1) It is recommended to apply the rolling pressure up to 60MPa by use rolling machine Arga T08, giving roll- ing squeeze as large as A = 0.04 mm2 and tangential re- sidual compression stresses inside rolling paths as large as TI = −822 MPa. 2) For rolling pressure p (bar) from 70 to 120 bar, no increase of the tangential compression residual stresses increase inside the rolling paths was observed. 3) For rolling pressure p (bar) from 70 to 120 bar large variation of rolling squeeze depth d (mm) and width w(mm) was seen. By the largest rolling pressure (d = 0.049 mm, w = 4.95 mm, A = 0.123 mm2) significant up- cast of 11.4 µm in depth and 590 µm in the width was evidenced, indicating possible wear of rolls and/or bear- ings in the rolling machine. 4) Large dispersion of tangential TO (MPa) and radial RO (MPa) residual stresses outside rolling paths, added to the saw blade before rolling, with maximum value of 155 MPa and 274 MPa respectively was evidenced. 5) The BN measurements allow recognizing the pres- ence of small and large compression stresses inside and outside rolling paths, but this information is mixed with effect of hardness change distribution. 6) In one measuring point, outside rolling path after correction positive, residual tensile tangential stress of + 1.9 MPa was recognized. Table 2. Stress and FWHM (o) values, evaluated with use of X-ray diffractometer. Position No Stress Tangential = 0o Stress Radial = 90o FWHM = 0o FWHM = 90o (MPa)(MPa)(MPa) (MP) ( o) (o) 1 −64 10 225 46 3.33 3.28 2 −5338 −332 13 3.56 3.46 3 −60 11 190 41 3.35 3.30 4 −6257 −424 8 3.56 3.49 5 51 13 274 39 3.31 3.27 6 −6268 −458 18 3.53 3.45 7 −26 11 215 42 3.29 3.25 8 −6457 −484 15 3.55 3.50 9 −19 12 189 46 3.33 3.26 10 −68110 −483 11 3.52 3.43 11 77 17 266 40 3.33 3.29 12 −68310 −477 18 3.53 3.48 13 113 12 217 40 3.28 3.25 14 −6786 −464 15 3.54 3.45 15 81 18 175 41 3.28 3.25 16 −66017 −462 19 3.52 3.43 17 144 20 181 40 3.29 3.26 18 −6749 −453 20 3.50 3.43 19 69 15 86 36 3.29 3.27 20 −6719 −435 21 3.52 3.44 21 155 21 115 35 3.23 3.22 22 −63111 −392 25 3.43 3.37 23 67 22 30 36 3.26 3.22 24 −68711 −377 34 3.48 3.42 25 59 26 4 28 3.22 3.24 7) No significant rolling effect on radial residual stresses inside RI (MPa) and outside RI (MPa) rolling paths was seen. 5. Acknowledgements The authors were grateful for the support of the Stress- tech OY Company in performing X-ray diffraction and BN measurements. The authors were also grateful for the support of the Poznań Networking & Supercomputing Center (PCSS) calculation grant. 6. References [1] P. F. Lister and G. S. Schajer, “The Effectiveness of the Light-Gap and Frequency Measurement Methods for Evaluating Saw Tensioning,” Proceedings of 10th Wood Machining Seminar, University of California, Forest Products Laboratory, Richmond, 21-23 October 1991, pp. 68-84. [2] R. Szymani and C. D. Mote, “Circular Saw Stiffness as a 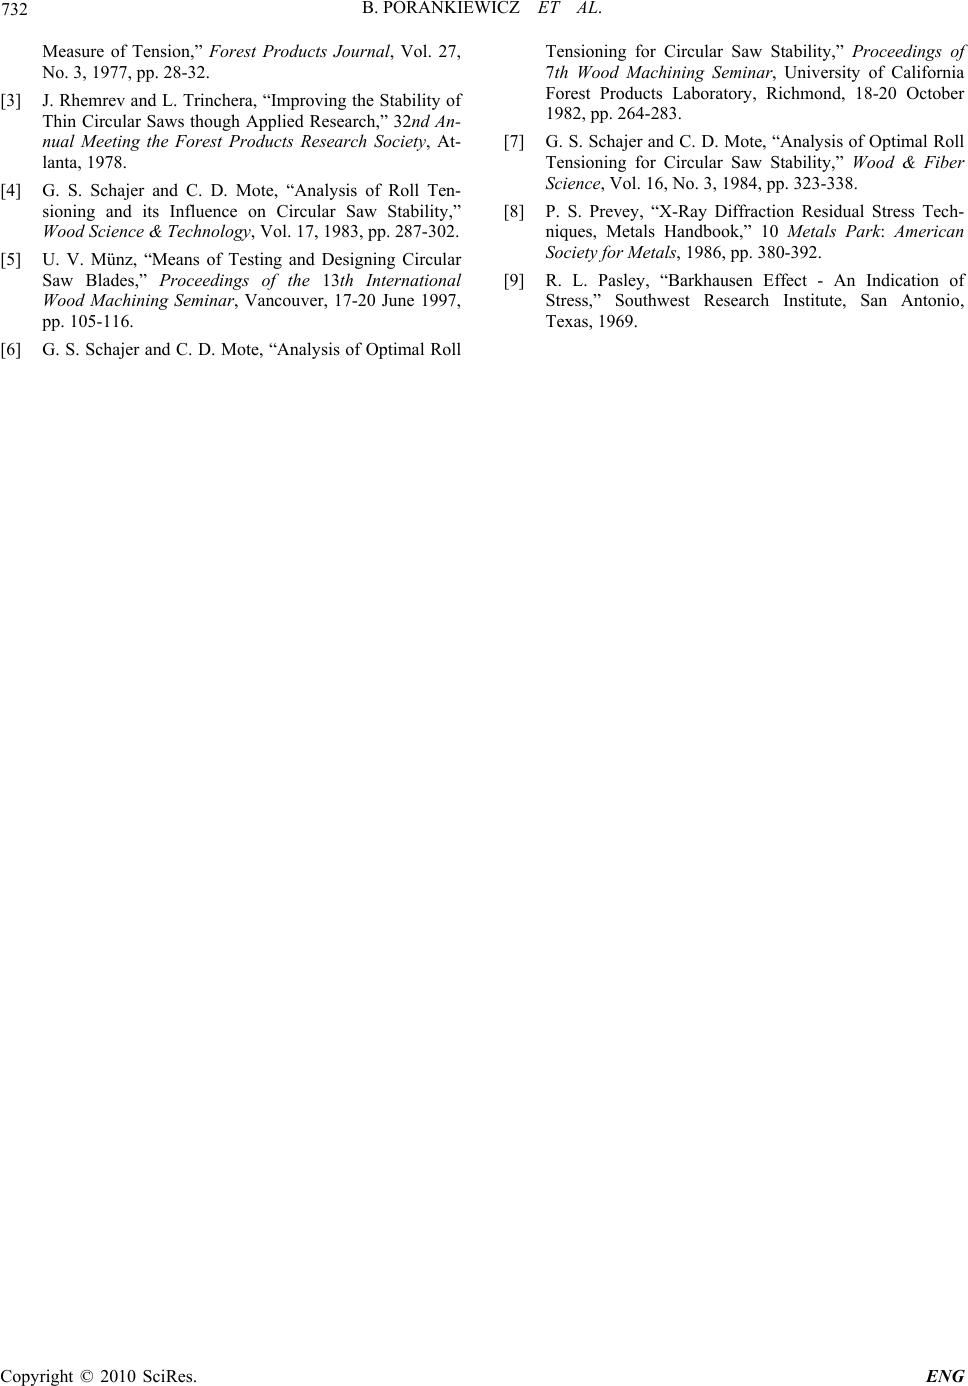 B. PORANKIEWICZ ET AL. Copyright © 2010 SciRes. ENG 732 Measure of Tension,” Forest Products Journal, Vol. 27, No. 3, 1977, pp. 28-32. [3] J. Rhemrev and L. Trinchera, “Improving the Stability of Thin Circular Saws though Applied Research,” 32nd An- nual Meeting the Forest Products Research Society, At- lanta, 1978. [4] G. S. Schajer and C. D. Mote, “Analysis of Roll Ten- sioning and its Influence on Circular Saw Stability,” Wood Science & Technology, Vol. 17, 1983, pp. 287-302. [5] U. V. Münz, “Means of Testing and Designing Circular Saw Blades,” Proceedings of the 13th International Wood Machining Seminar, Vancouver, 17-20 June 1997, pp. 105-116. [6] G. S. Schajer and C. D. Mote, “Analysis of Optimal Roll Tensioning for Circular Saw Stability,” Proceedings of 7th Wood Machining Seminar, University of California Forest Products Laboratory, Richmond, 18-20 October 1982, pp. 264-283. [7] G. S. Schajer and C. D. Mote, “Analysis of Optimal Roll Tensioning for Circular Saw Stability,” Wood & Fiber Science, Vol. 16, No. 3, 1984, pp. 323-338. [8] P. S. Prevey, “X-Ray Diffraction Residual Stress Tech- niques, Metals Handbook,” 10 Metals Park: American Society for Metals, 1986, pp. 380-392. [9] R. L. Pasley, “Barkhausen Effect - An Indication of Stress,” Southwest Research Institute, San Antonio, Texas, 1969. |