Paper Menu >>
Journal Menu >>
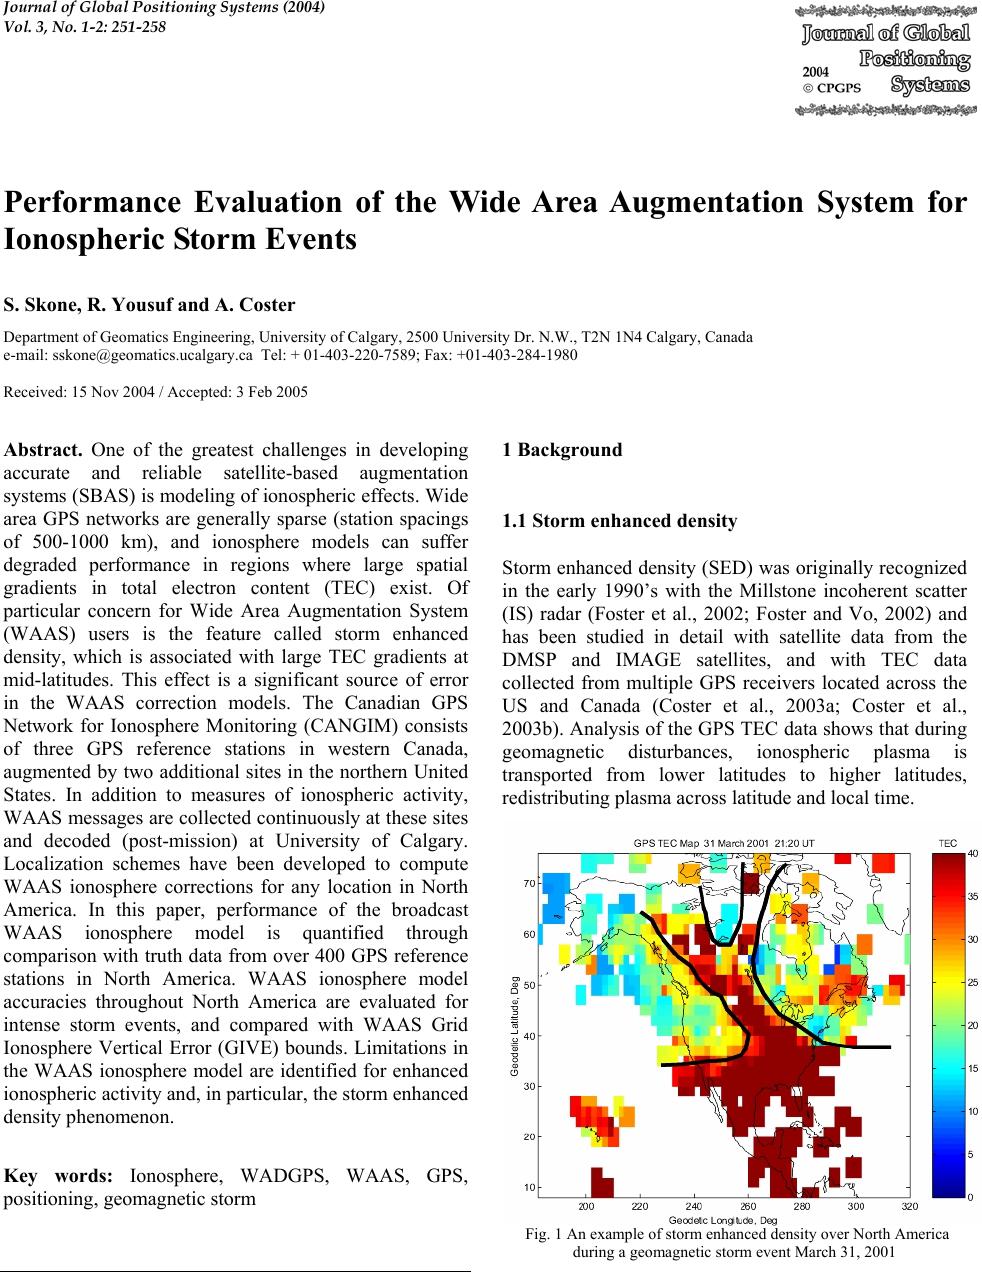 Journal of Global Positioning Systems (2004) Vol. 3, No. 1-2: 251-258 Performance Evaluation of the Wide Area Augmentation System for Ionospheric Storm Events S. Skone, R. Yousuf and A. Coster Department of Geomatics Engineering, University of Calgary, 2500 University Dr. N.W., T2N 1N4 Calgary, Canada e-mail: sskone@geomatics.ucalgary.ca Tel: + 01-403-220-7589; Fax: +01-403-284-1980 Received: 15 Nov 2004 / Accepted: 3 Feb 2005 Abstract. One of the greatest challenges in developing accurate and reliable satellite-based augmentation systems (SBAS) is modeling of ionospheric effects. Wide area GPS networks are generally sparse (station spacings of 500-1000 km), and ionosphere models can suffer degraded performance in regions where large spatial gradients in total electron content (TEC) exist. Of particular concern for Wide Area Augmentation System (WAAS) users is the feature called storm enhanced density, which is associated with large TEC gradients at mid-latitudes. This effect is a significant source of error in the WAAS correction models. The Canadian GPS Network for Ionosphere Monitoring (CANGIM) consists of three GPS reference stations in western Canada, augmented by two additional sites in the northern United States. In addition to measures of ionospheric activity, WAAS messages are collected continuously at these sites and decoded (post-mission) at University of Calgary. Localization schemes have been developed to compute WAAS ionosphere corrections for any location in North America. In this paper, performance of the broadcast WAAS ionosphere model is quantified through comparison with truth data from over 400 GPS reference stations in North America. WAAS ionosphere model accuracies throughout North America are evaluated for intense storm events, and compared with WAAS Grid Ionosphere Vertical Error (GIVE) bounds. Limitations in the WAAS ionosphere model are identified for enhanced ionospheric activity and, in particular, the storm enhanced density phenomenon. Key words: Ionosphere, WADGPS, WAAS, GPS, positioning, geomagnetic storm 1 Background 1.1 Storm enhanced density Storm enhanced density (SED) was originally recognized in the early 1990’s with the Millstone incoherent scatter (IS) radar (Foster et al., 2002; Foster and Vo, 2002) and has been studied in detail with satellite data from the DMSP and IMAGE satellites, and with TEC data collected from multiple GPS receivers located across the US and Canada (Coster et al., 2003a; Coster et al., 2003b). Analysis of the GPS TEC data shows that during geomagnetic disturbances, ionospheric plasma is transported from lower latitudes to higher latitudes, redistributing plasma across latitude and local time. Fig. 1 An example of storm enhanced density over North America during a geomagnetic storm event March 31, 2001 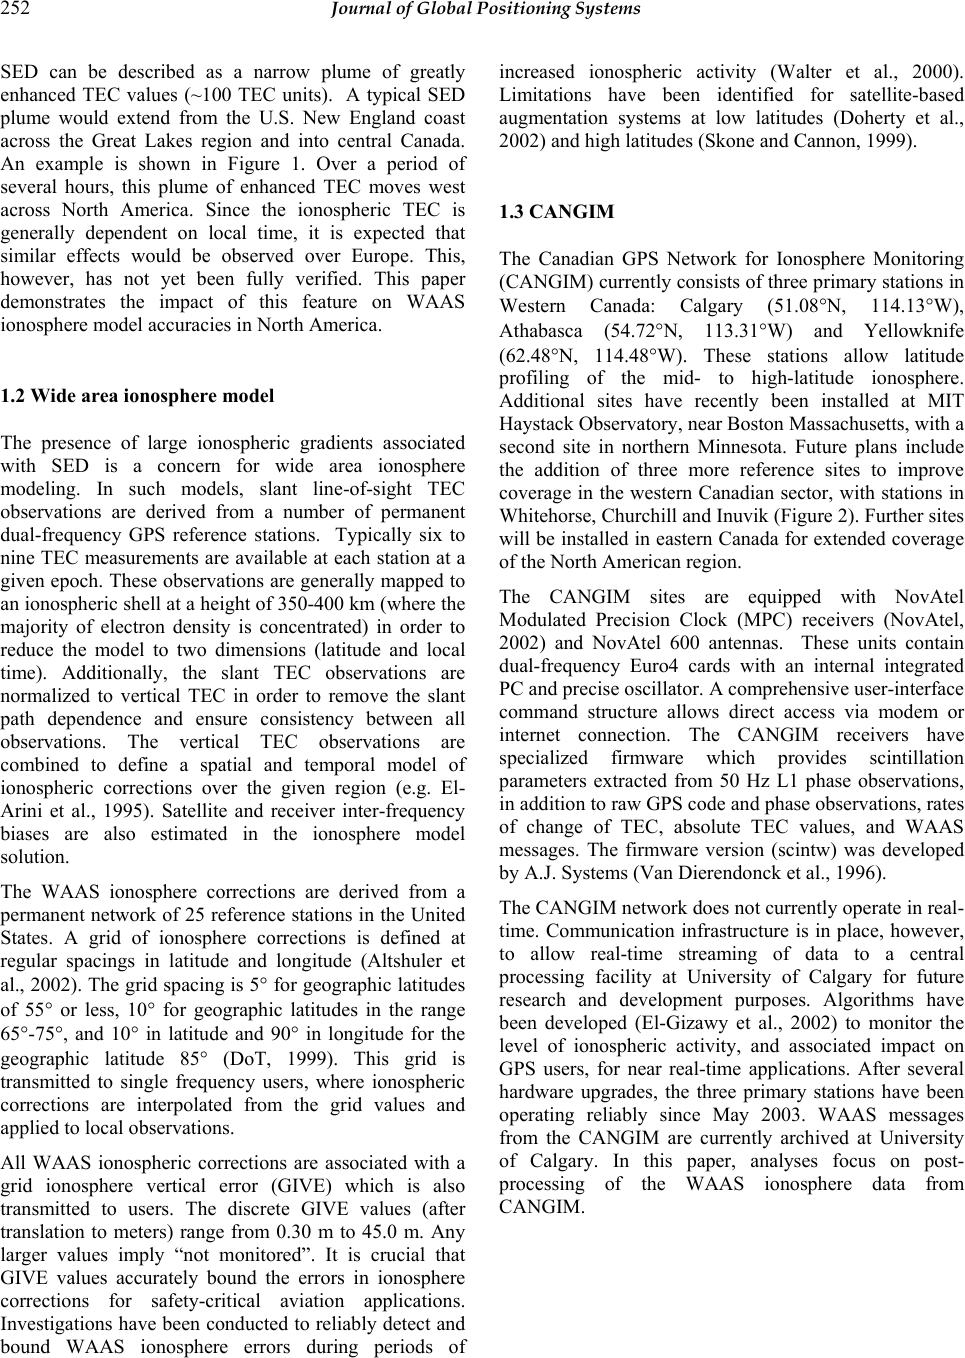 252 Journal of Global Positioning Systems SED can be described as a narrow plume of greatly enhanced TEC values (~100 TEC units). A typical SED plume would extend from the U.S. New England coast across the Great Lakes region and into central Canada. An example is shown in Figure 1. Over a period of several hours, this plume of enhanced TEC moves west across North America. Since the ionospheric TEC is generally dependent on local time, it is expected that similar effects would be observed over Europe. This, however, has not yet been fully verified. This paper demonstrates the impact of this feature on WAAS ionosphere model accuracies in North America. 1.2 Wide area ionosphere model The presence of large ionospheric gradients associated with SED is a concern for wide area ionosphere modeling. In such models, slant line-of-sight TEC observations are derived from a number of permanent dual-frequency GPS reference stations. Typically six to nine TEC measurements are available at each station at a given epoch. These observations are generally mapped to an ionospheric shell at a height of 350-400 km (where the majority of electron density is concentrated) in order to reduce the model to two dimensions (latitude and local time). Additionally, the slant TEC observations are normalized to vertical TEC in order to remove the slant path dependence and ensure consistency between all observations. The vertical TEC observations are combined to define a spatial and temporal model of ionospheric corrections over the given region (e.g. El- Arini et al., 1995). Satellite and receiver inter-frequency biases are also estimated in the ionosphere model solution. The WAAS ionosphere corrections are derived from a permanent network of 25 reference stations in the United States. A grid of ionosphere corrections is defined at regular spacings in latitude and longitude (Altshuler et al., 2002). The grid spacing is 5° for geographic latitudes of 55° or less, 10° for geographic latitudes in the range 65°-75°, and 10° in latitude and 90° in longitude for the geographic latitude 85° (DoT, 1999). This grid is transmitted to single frequency users, where ionospheric corrections are interpolated from the grid values and applied to local observations. All WAAS ionospheric corrections are associated with a grid ionosphere vertical error (GIVE) which is also transmitted to users. The discrete GIVE values (after translation to meters) range from 0.30 m to 45.0 m. Any larger values imply “not monitored”. It is crucial that GIVE values accurately bound the errors in ionosphere corrections for safety-critical aviation applications. Investigations have been conducted to reliably detect and bound WAAS ionosphere errors during periods of increased ionospheric activity (Walter et al., 2000). Limitations have been identified for satellite-based augmentation systems at low latitudes (Doherty et al., 2002) and high latitudes (Skone and Cannon, 1999). 1.3 CANGIM The Canadian GPS Network for Ionosphere Monitoring (CANGIM) currently consists of three primary stations in Western Canada: Calgary (51.08°N, 114.13°W), Athabasca (54.72°N, 113.31°W) and Yellowknife (62.48°N, 114.48°W). These stations allow latitude profiling of the mid- to high-latitude ionosphere. Additional sites have recently been installed at MIT Haystack Observatory, near Boston Massachusetts, with a second site in northern Minnesota. Future plans include the addition of three more reference sites to improve coverage in the western Canadian sector, with stations in Whitehorse, Churchill and Inuvik (Figure 2). Further sites will be installed in eastern Canada for extended coverage of the North American region. The CANGIM sites are equipped with NovAtel Modulated Precision Clock (MPC) receivers (NovAtel, 2002) and NovAtel 600 antennas. These units contain dual-frequency Euro4 cards with an internal integrated PC and precise oscillator. A comprehensive user-interface command structure allows direct access via modem or internet connection. The CANGIM receivers have specialized firmware which provides scintillation parameters extracted from 50 Hz L1 phase observations, in addition to raw GPS code and phase observations, rates of change of TEC, absolute TEC values, and WAAS messages. The firmware version (scintw) was developed by A.J. Systems (Van Dierendonck et al., 1996). The CANGIM network does not currently operate in real- time. Communication infrastructure is in place, however, to allow real-time streaming of data to a central processing facility at University of Calgary for future research and development purposes. Algorithms have been developed (El-Gizawy et al., 2002) to monitor the level of ionospheric activity, and associated impact on GPS users, for near real-time applications. After several hardware upgrades, the three primary stations have been operating reliably since May 2003. WAAS messages from the CANGIM are currently archived at University of Calgary. In this paper, analyses focus on post- processing of the WAAS ionosphere data from CANGIM. 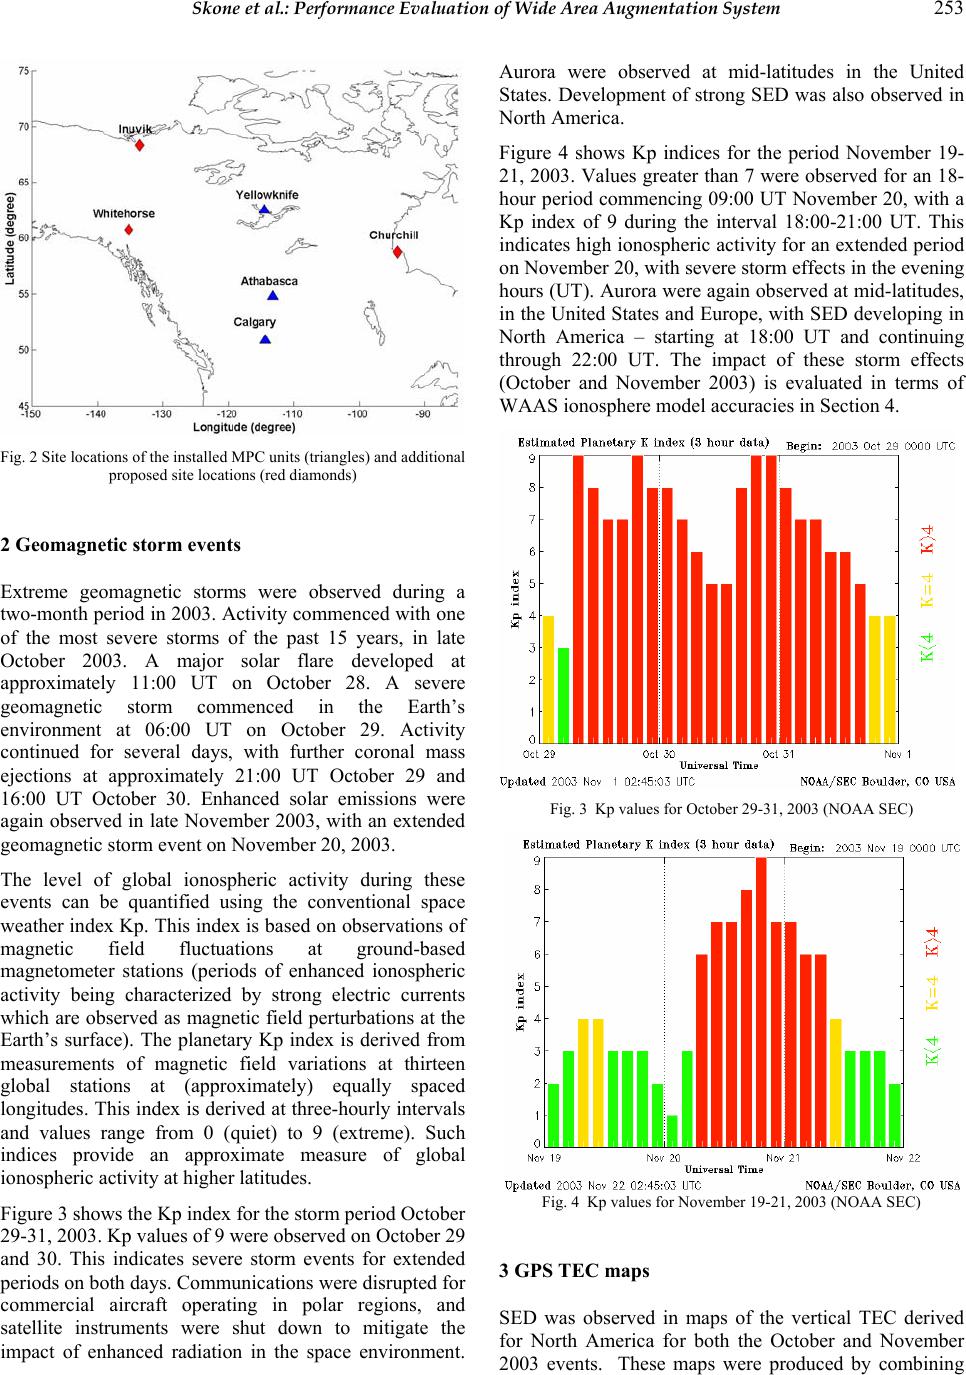 Skone et al.: Performance Evaluation of Wide Area Augmentation System 253 Fig. 2 Site locations of the installed MPC units (triangles) and additional proposed site locations (red diamonds) 2 Geomagnetic storm events Extreme geomagnetic storms were observed during a two-month period in 2003. Activity commenced with one of the most severe storms of the past 15 years, in late October 2003. A major solar flare developed at approximately 11:00 UT on October 28. A severe geomagnetic storm commenced in the Earth’s environment at 06:00 UT on October 29. Activity continued for several days, with further coronal mass ejections at approximately 21:00 UT October 29 and 16:00 UT October 30. Enhanced solar emissions were again observed in late November 2003, with an extended geomagnetic storm event on November 20, 2003. The level of global ionospheric activity during these events can be quantified using the conventional space weather index Kp. This index is based on observations of magnetic field fluctuations at ground-based magnetometer stations (periods of enhanced ionospheric activity being characterized by strong electric currents which are observed as magnetic field perturbations at the Earth’s surface). The planetary Kp index is derived from measurements of magnetic field variations at thirteen global stations at (approximately) equally spaced longitudes. This index is derived at three-hourly intervals and values range from 0 (quiet) to 9 (extreme). Such indices provide an approximate measure of global ionospheric activity at higher latitudes. Figure 3 shows the Kp index for the storm period October 29-31, 2003. Kp values of 9 were observed on October 29 and 30. This indicates severe storm events for extended periods on both days. Communications were disrupted for commercial aircraft operating in polar regions, and satellite instruments were shut down to mitigate the impact of enhanced radiation in the space environment. Aurora were observed at mid-latitudes in the United States. Development of strong SED was also observed in North America. Figure 4 shows Kp indices for the period November 19- 21, 2003. Values greater than 7 were observed for an 18- hour period commencing 09:00 UT November 20, with a Kp index of 9 during the interval 18:00-21:00 UT. This indicates high ionospheric activity for an extended period on November 20, with severe storm effects in the evening hours (UT). Aurora were again observed at mid-latitudes, in the United States and Europe, with SED developing in North America – starting at 18:00 UT and continuing through 22:00 UT. The impact of these storm effects (October and November 2003) is evaluated in terms of WAAS ionosphere model accuracies in Section 4. Fig. 3 Kp values for October 29-31, 2003 (NOAA SEC) Fig. 4 Kp values for November 19-21, 2003 (NOAA SEC) 3 GPS TEC maps SED was observed in maps of the vertical TEC derived for North America for both the October and November 2003 events. These maps were produced by combining 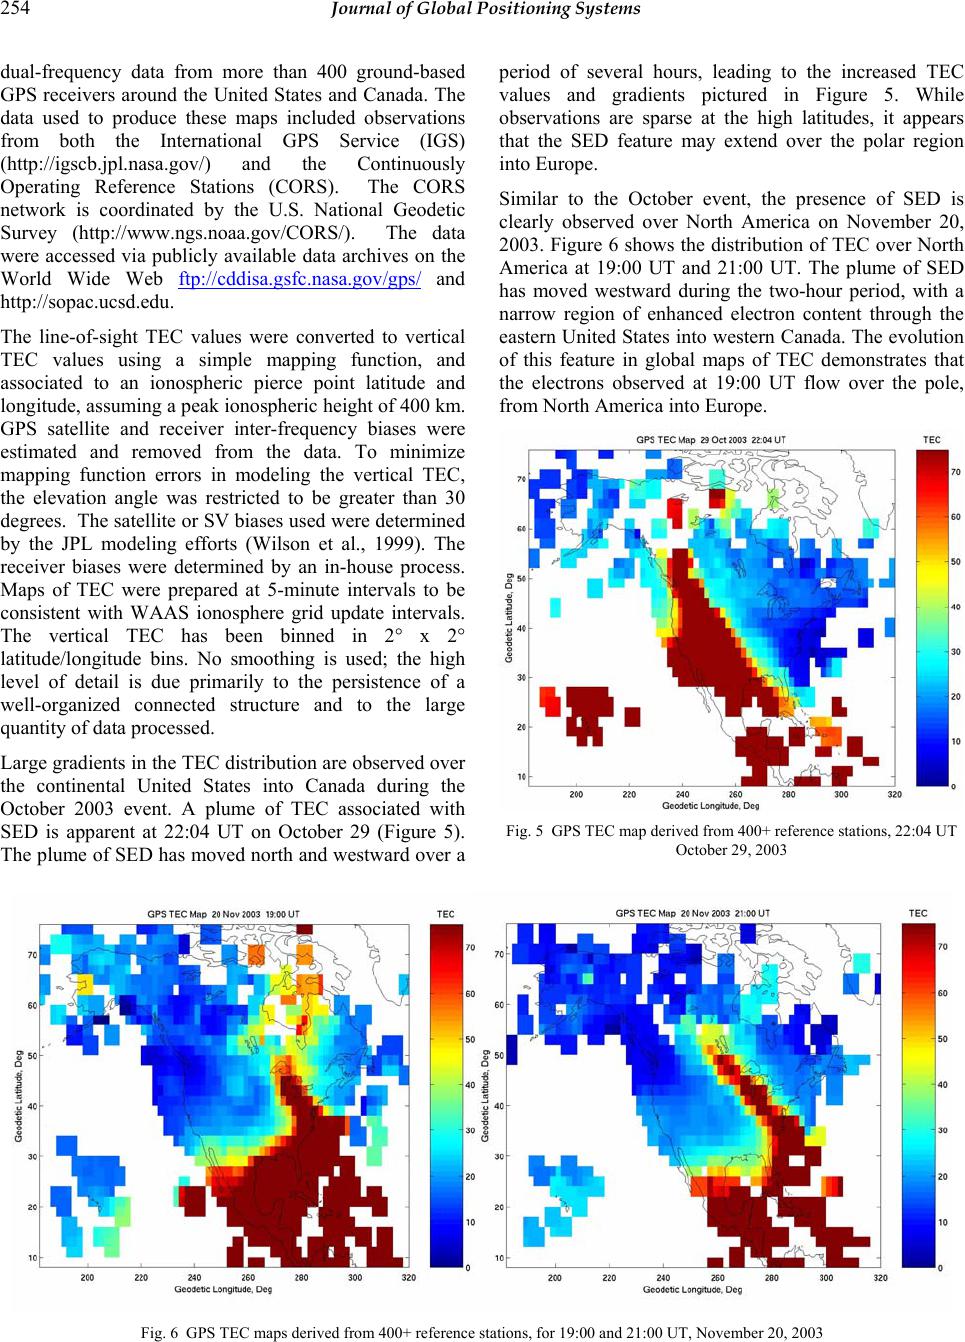 254 Journal of Global Positioning Systems dual-frequency data from more than 400 ground-based GPS receivers around the United States and Canada. The data used to produce these maps included observations from both the International GPS Service (IGS) (http://igscb.jpl.nasa.gov/) and the Continuously Operating Reference Stations (CORS). The CORS network is coordinated by the U.S. National Geodetic Survey (http://www.ngs.noaa.gov/CORS/). The data were accessed via publicly available data archives on the World Wide Web ftp://cddisa.gsfc.nasa.go v /gps/ and http://sopac.ucsd.edu. The line-of-sight TEC values were converted to vertical TEC values using a simple mapping function, and associated to an ionospheric pierce point latitude and longitude, assuming a peak ionospheric height of 400 km. GPS satellite and receiver inter-frequency biases were estimated and removed from the data. To minimize mapping function errors in modeling the vertical TEC, the elevation angle was restricted to be greater than 30 degrees. The satellite or SV biases used were determined by the JPL modeling efforts (Wilson et al., 1999). The receiver biases were determined by an in-house process. Maps of TEC were prepared at 5-minute intervals to be consistent with WAAS ionosphere grid update intervals. The vertical TEC has been binned in 2° x 2° latitude/longitude bins. No smoothing is used; the high level of detail is due primarily to the persistence of a well-organized connected structure and to the large quantity of data processed. Large gradients in the TEC distribution are observed over the continental United States into Canada during the October 2003 event. A plume of TEC associated with SED is apparent at 22:04 UT on October 29 (Figure 5). The plume of SED has moved north and westward over a period of several hours, leading to the increased TEC values and gradients pictured in Figure 5. While observations are sparse at the high latitudes, it appears that the SED feature may extend over the polar region into Europe. Similar to the October event, the presence of SED is clearly observed over North America on November 20, 2003. Figure 6 shows the distribution of TEC over North America at 19:00 UT and 21:00 UT. The plume of SED has moved westward during the two-hour period, with a narrow region of enhanced electron content through the eastern United States into western Canada. The evolution of this feature in global maps of TEC demonstrates that the electrons observed at 19:00 UT flow over the pole, from North America into Europe. Fig. 5 GPS TEC map derived from 400+ reference stations, 22:04 UT October 29, 2003 Fig. 6 GPS TEC maps derived from 400+ reference stations, for 19:00 and 21:00 UT, November 20, 2003 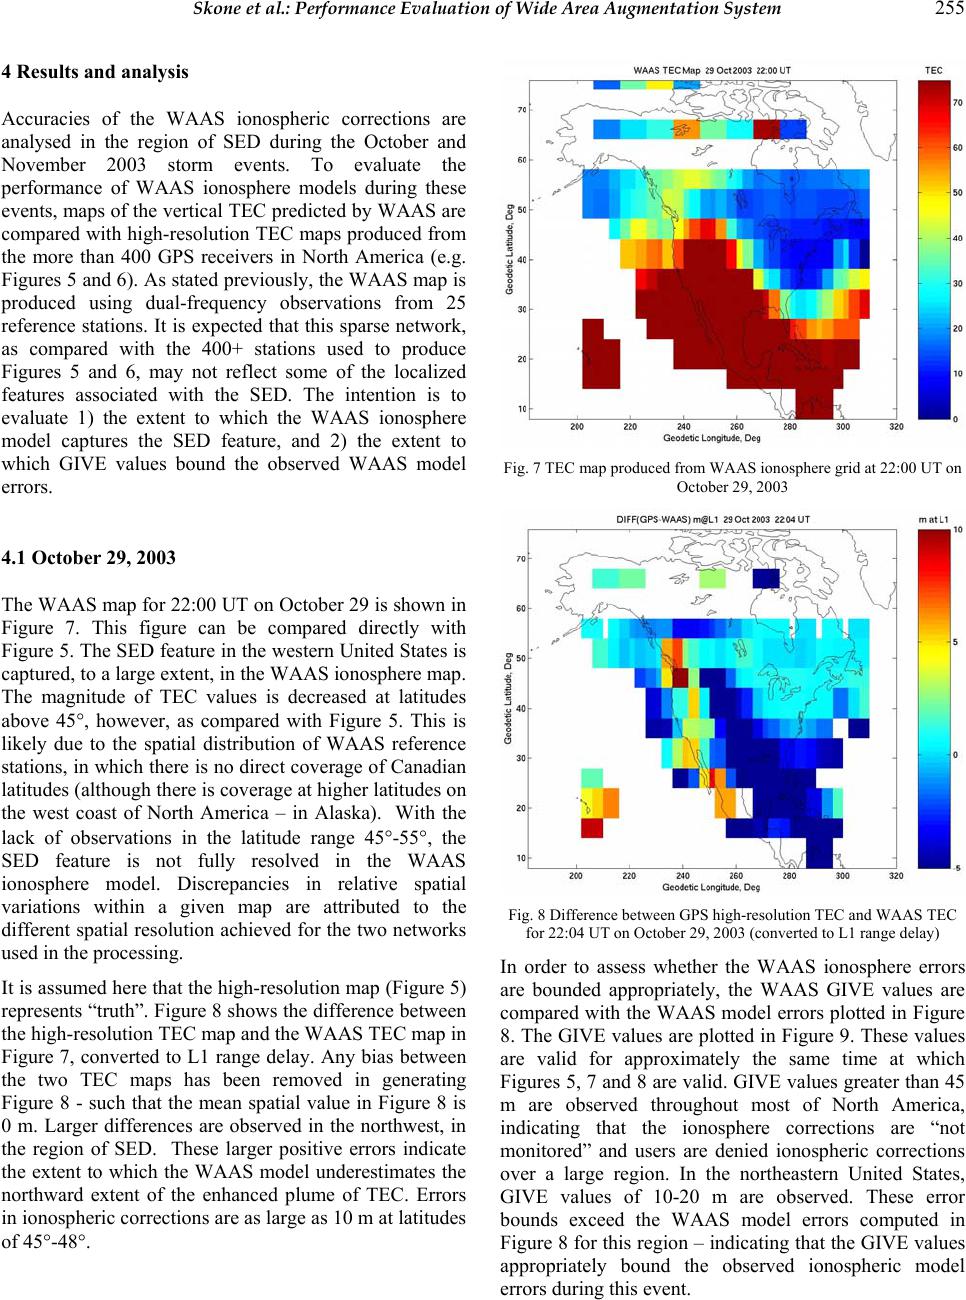 Skone et al.: Performance Evaluation of Wide Area Augmentation System 255 4 Results and analysis Accuracies of the WAAS ionospheric corrections are analysed in the region of SED during the October and November 2003 storm events. To evaluate the performance of WAAS ionosphere models during these events, maps of the vertical TEC predicted by WAAS are compared with high-resolution TEC maps produced from the more than 400 GPS receivers in North America (e.g. Figures 5 and 6). As stated previously, the WAAS map is produced using dual-frequency observations from 25 reference stations. It is expected that this sparse network, as compared with the 400+ stations used to produce Figures 5 and 6, may not reflect some of the localized features associated with the SED. The intention is to evaluate 1) the extent to which the WAAS ionosphere model captures the SED feature, and 2) the extent to which GIVE values bound the observed WAAS model errors. 4.1 October 29, 2003 The WAAS map for 22:00 UT on October 29 is shown in Figure 7. This figure can be compared directly with Figure 5. The SED feature in the western United States is captured, to a large extent, in the WAAS ionosphere map. The magnitude of TEC values is decreased at latitudes above 45°, however, as compared with Figure 5. This is likely due to the spatial distribution of WAAS reference stations, in which there is no direct coverage of Canadian latitudes (although there is coverage at higher latitudes on the west coast of North America – in Alaska). With the lack of observations in the latitude range 45°-55°, the SED feature is not fully resolved in the WAAS ionosphere model. Discrepancies in relative spatial variations within a given map are attributed to the different spatial resolution achieved for the two networks used in the processing. It is assumed here that the high-resolution map (Figure 5) represents “truth”. Figure 8 shows the difference between the high-resolution TEC map and the WAAS TEC map in Figure 7, converted to L1 range delay. Any bias between the two TEC maps has been removed in generating Figure 8 - such that the mean spatial value in Figure 8 is 0 m. Larger differences are observed in the northwest, in the region of SED. These larger positive errors indicate the extent to which the WAAS model underestimates the northward extent of the enhanced plume of TEC. Errors in ionospheric corrections are as large as 10 m at latitudes of 45°-48°. Fig. 7 TEC map produced from WAAS ionosphere grid at 22:00 UT on October 29, 2003 Fig. 8 Difference between GPS high-resolution TEC and WAAS TEC for 22:04 UT on October 29, 2003 (converted to L1 range delay) In order to assess whether the WAAS ionosphere errors are bounded appropriately, the WAAS GIVE values are compared with the WAAS model errors plotted in Figure 8. The GIVE values are plotted in Figure 9. These values are valid for approximately the same time at which Figures 5, 7 and 8 are valid. GIVE values greater than 45 m are observed throughout most of North America, indicating that the ionosphere corrections are “not monitored” and users are denied ionospheric corrections over a large region. In the northeastern United States, GIVE values of 10-20 m are observed. These error bounds exceed the WAAS model errors computed in Figure 8 for this region – indicating that the GIVE values appropriately bound the observed ionospheric model errors during this event. 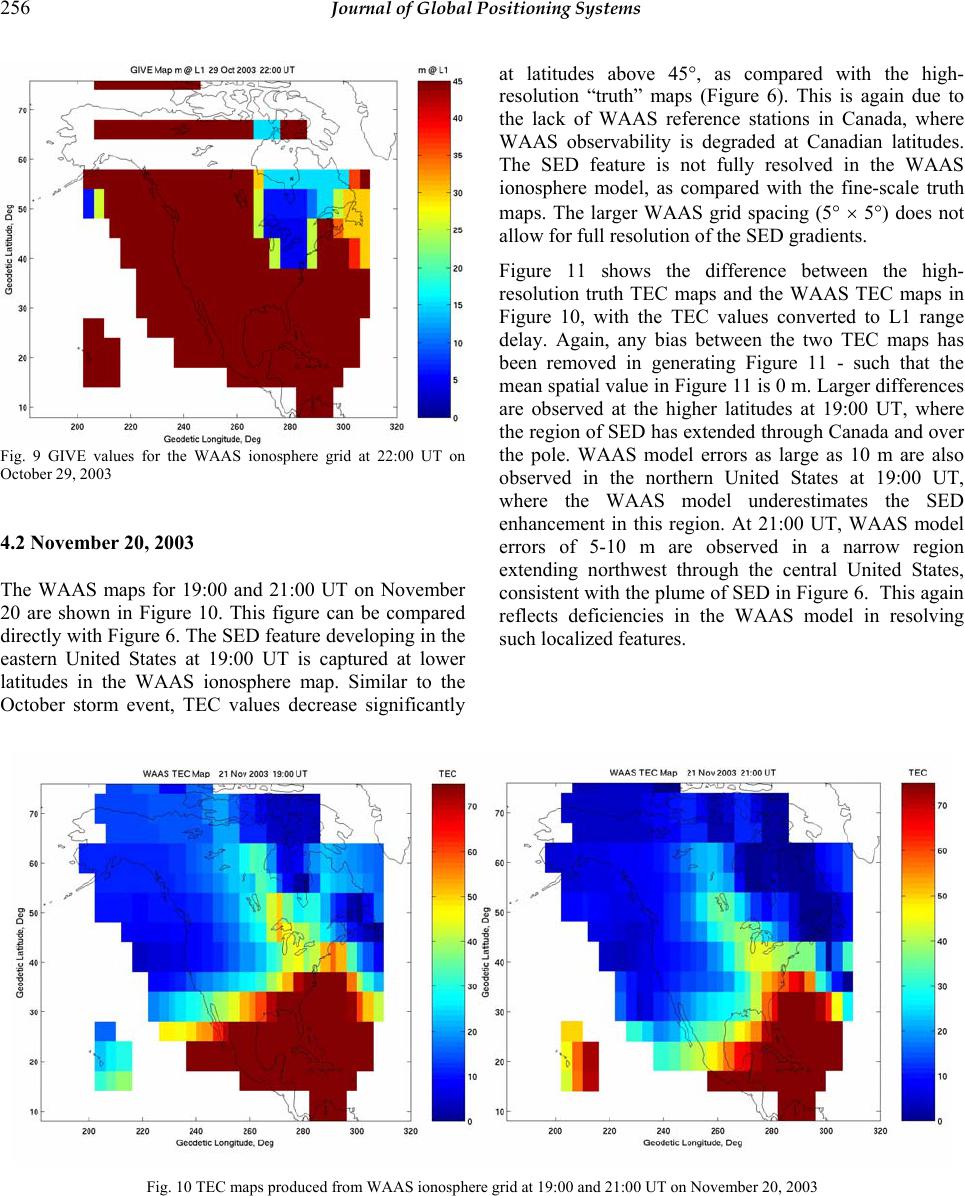 256 Journal of Global Positioning Systems Fig. 9 GIVE values for the WAAS ionosphere grid at 22:00 UT on October 29, 2003 4.2 November 20, 2003 The WAAS maps for 19:00 and 21:00 UT on November 20 are shown in Figure 10. This figure can be compared directly with Figure 6. The SED feature developing in the eastern United States at 19:00 UT is captured at lower latitudes in the WAAS ionosphere map. Similar to the October storm event, TEC values decrease significantly at latitudes above 45°, as compared with the high- resolution “truth” maps (Figure 6). This is again due to the lack of WAAS reference stations in Canada, where WAAS observability is degraded at Canadian latitudes. The SED feature is not fully resolved in the WAAS ionosphere model, as compared with the fine-scale truth maps. The larger WAAS grid spacing (5° × 5°) does not allow for full resolution of the SED gradients. Figure 11 shows the difference between the high- resolution truth TEC maps and the WAAS TEC maps in Figure 10, with the TEC values converted to L1 range delay. Again, any bias between the two TEC maps has been removed in generating Figure 11 - such that the mean spatial value in Figure 11 is 0 m. Larger differences are observed at the higher latitudes at 19:00 UT, where the region of SED has extended through Canada and over the pole. WAAS model errors as large as 10 m are also observed in the northern United States at 19:00 UT, where the WAAS model underestimates the SED enhancement in this region. At 21:00 UT, WAAS model errors of 5-10 m are observed in a narrow region extending northwest through the central United States, consistent with the plume of SED in Figure 6. This again reflects deficiencies in the WAAS model in resolving such localized features. Fig. 10 TEC maps produced from WAAS ionosphere grid at 19:00 and 21:00 UT on November 20, 2003 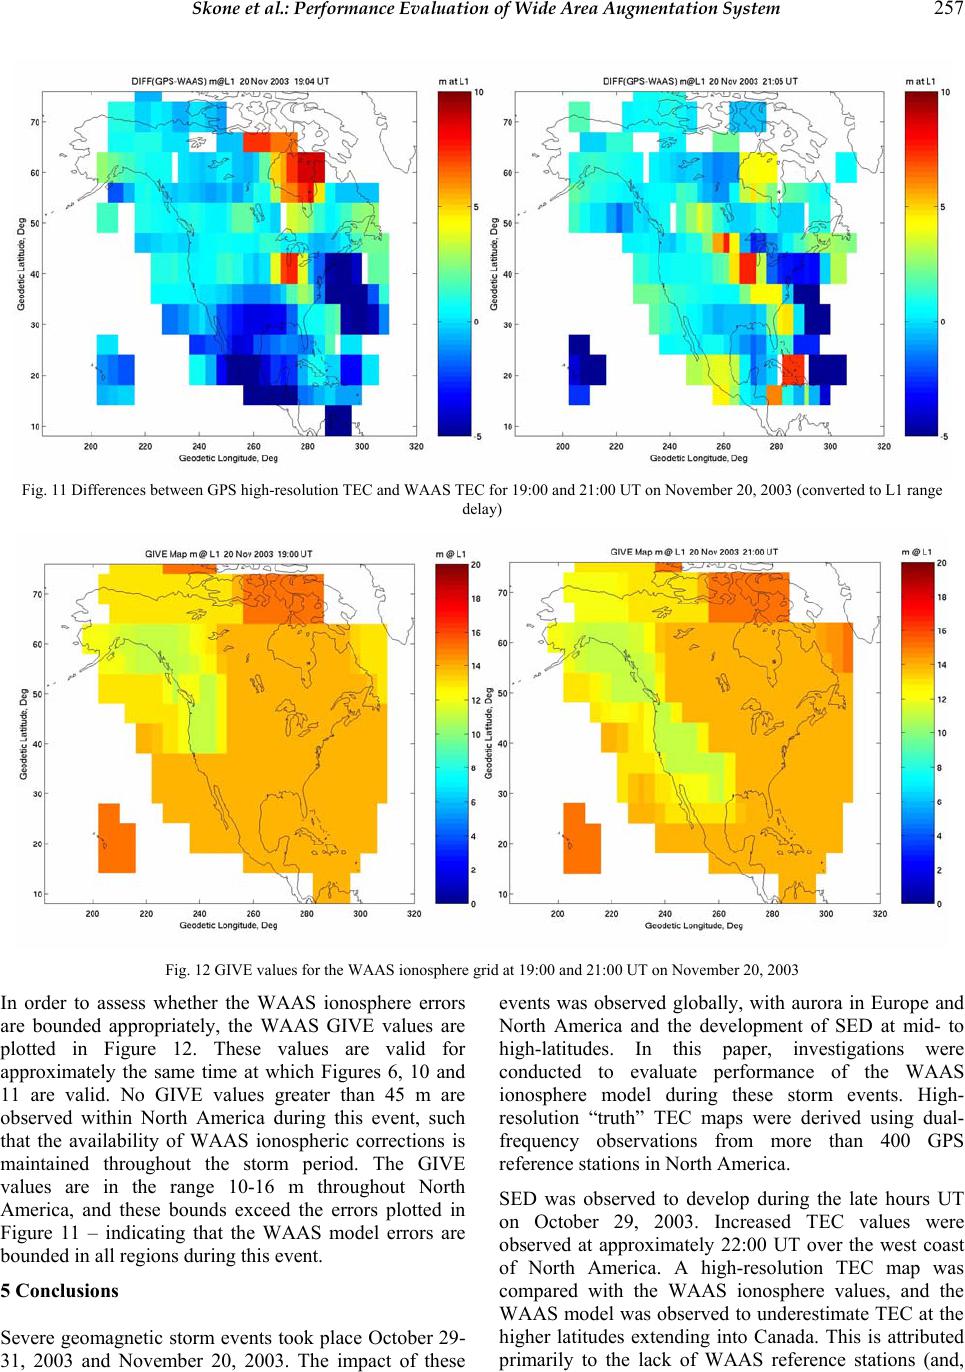 Skone et al.: Performance Evaluation of Wide Area Augmentation System 257 Fig. 11 Differences between GPS high-resolution TEC and WAAS TEC for 19:00 and 21:00 UT on November 20, 2003 (converted to L1 range delay) Fig. 12 GIVE values for the WAAS ionosphere grid at 19:00 and 21:00 UT on November 20, 2003 In order to assess whether the WAAS ionosphere errors are bounded appropriately, the WAAS GIVE values are plotted in Figure 12. These values are valid for approximately the same time at which Figures 6, 10 and 11 are valid. No GIVE values greater than 45 m are observed within North America during this event, such that the availability of WAAS ionospheric corrections is maintained throughout the storm period. The GIVE values are in the range 10-16 m throughout North America, and these bounds exceed the errors plotted in Figure 11 – indicating that the WAAS model errors are bounded in all regions during this event. 5 Conclusions Severe geomagnetic storm events took place October 29- 31, 2003 and November 20, 2003. The impact of these events was observed globally, with aurora in Europe and North America and the development of SED at mid- to high-latitudes. In this paper, investigations were conducted to evaluate performance of the WAAS ionosphere model during these storm events. High- resolution “truth” TEC maps were derived using dual- frequency observations from more than 400 GPS reference stations in North America. SED was observed to develop during the late hours UT on October 29, 2003. Increased TEC values were observed at approximately 22:00 UT over the west coast of North America. A high-resolution TEC map was compared with the WAAS ionosphere values, and the WAAS model was observed to underestimate TEC at the higher latitudes extending into Canada. This is attributed primarily to the lack of WAAS reference stations (and, 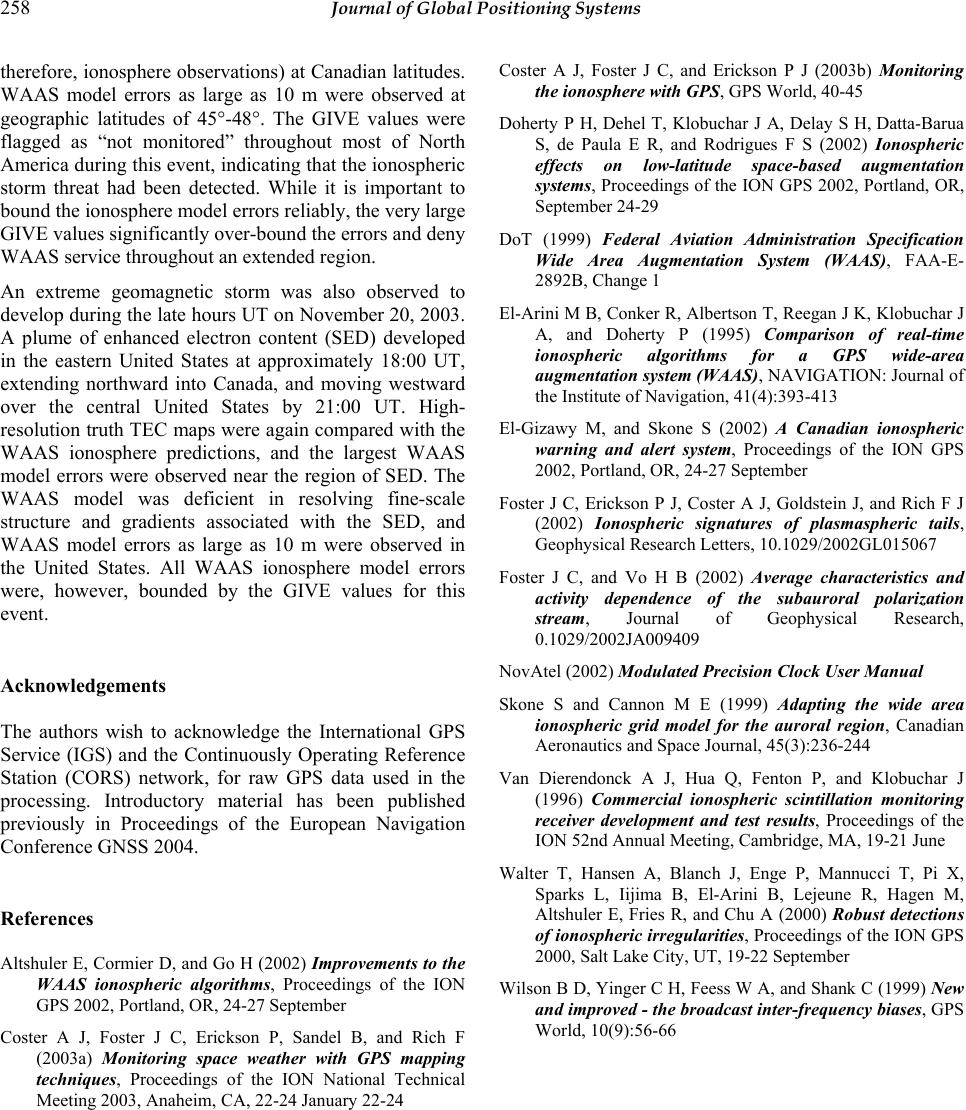 258 Journal of Global Positioning Systems therefore, ionosphere observations) at Canadian latitudes. WAAS model errors as large as 10 m were observed at geographic latitudes of 45°-48°. The GIVE values were flagged as “not monitored” throughout most of North America during this event, indicating that the ionospheric storm threat had been detected. While it is important to bound the ionosphere model errors reliably, the very large GIVE values significantly over-bound the errors and deny WAAS service throughout an extended region. An extreme geomagnetic storm was also observed to develop during the late hours UT on November 20, 2003. A plume of enhanced electron content (SED) developed in the eastern United States at approximately 18:00 UT, extending northward into Canada, and moving westward over the central United States by 21:00 UT. High- resolution truth TEC maps were again compared with the WAAS ionosphere predictions, and the largest WAAS model errors were observed near the region of SED. The WAAS model was deficient in resolving fine-scale structure and gradients associated with the SED, and WAAS model errors as large as 10 m were observed in the United States. All WAAS ionosphere model errors were, however, bounded by the GIVE values for this event. Acknowledgements The authors wish to acknowledge the International GPS Service (IGS) and the Continuously Operating Reference Station (CORS) network, for raw GPS data used in the processing. Introductory material has been published previously in Proceedings of the European Navigation Conference GNSS 2004. References Altshuler E, Cormier D, and Go H (2002) Improvements to the WAAS ionospheric algorithms, Proceedings of the ION GPS 2002, Portland, OR, 24-27 September Coster A J, Foster J C, Erickson P, Sandel B, and Rich F (2003a) Monitoring space weather with GPS mapping techniques, Proceedings of the ION National Technical Meeting 2003, Anaheim, CA, 22-24 January 22-24 Coster A J, Foster J C, and Erickson P J (2003b) Monitoring the ionosphere with GPS, GPS World, 40-45 Doherty P H, Dehel T, Klobuchar J A, Delay S H, Datta-Barua S, de Paula E R, and Rodrigues F S (2002) Ionospheric effects on low-latitude space-based augmentation systems, Proceedings of the ION GPS 2002, Portland, OR, September 24-29 DoT (1999) Federal Aviation Administration Specification Wide Area Augmentation System (WAAS), FAA-E- 2892B, Change 1 El-Arini M B, Conker R, Albertson T, Reegan J K, Klobuchar J A, and Doherty P (1995) Comparison of real-time ionospheric algorithms for a GPS wide-area augmentation system (WAAS), NAVIGATION: Journal of the Institute of Navigation, 41(4):393-413 El-Gizawy M, and Skone S (2002) A Canadian ionospheric warning and alert system, Proceedings of the ION GPS 2002, Portland, OR, 24-27 September Foster J C, Erickson P J, Coster A J, Goldstein J, and Rich F J (2002) Ionospheric signatures of plasmaspheric tails, Geophysical Research Letters, 10.1029/2002GL015067 Foster J C, and Vo H B (2002) Average characteristics and activity dependence of the subauroral polarization stream, Journal of Geophysical Research, 0.1029/2002JA009409 NovAtel (2002) Modulated Precision Clock User Manual Skone S and Cannon M E (1999) Adapting the wide area ionospheric grid model for the auroral region, Canadian Aeronautics and Space Journal, 45(3):236-244 Van Dierendonck A J, Hua Q, Fenton P, and Klobuchar J (1996) Commercial ionospheric scintillation monitoring receiver development and test results, Proceedings of the ION 52nd Annual Meeting, Cambridge, MA, 19-21 June Walter T, Hansen A, Blanch J, Enge P, Mannucci T, Pi X, Sparks L, Iijima B, El-Arini B, Lejeune R, Hagen M, Altshuler E, Fries R, and Chu A (2000) Robust detections of ionospheric irregularities, Proceedings of the ION GPS 2000, Salt Lake City, UT, 19-22 September Wilson B D, Yinger C H, Feess W A, and Shank C (1999) New and improved - the broadcast inter-frequency biases, GPS World, 10(9):56-66 |