Paper Menu >>
Journal Menu >>
 Journal of Global Positioning Systems (2004) Vol. 3, No. 1-2: 226-231 High Frequency Deflection Monitoring of Bridges by GPS Gethin W Roberts, Emily Cosser, Xia olin Me n g , A lan Dodson IESSG, The University of Nottingham, University Park, Nottingham, NG7 2RD, UK e-mail: gethin.roberts@nottingham.ac.uk Tel: + 44 115 9513933; Fax: +44 115 951 38 81 Received: 15 Nov 2004 / Accepted: 3 Feb 2005 Abstract. The use of GPS for the deflection and deformation monitoring of structures has been under investigation for a number of years. Previous work has shown that GPS not only measures the magnitude of the deflection of the structure, but also it is able to measure the frequency of the movement. Both sets of information are useful for structural engineers when assessing the condition of the structure as well as evaluating whether Finite Element (FE) models of such structures are indeed correct. GPS has the advantage of resulting in an abso lute 3-D position, with a very precise correspon ding time tag. However, until recently, the maximum data rate was typically 10-20 Hz, meaning that the maximum detectable frequency was about 5-10 Hz. GPS also has the disadvantage of multipath and cycle clips, and the height component’s accuracy is typically 2 – 3 times worse than that of plan. Previous work at the IESSG has included the integration of RTK GPS, gathering data at a rate of up to 10Hz, with that of data from an accelerometer, typically gathering data at up to 200 Hz. Accelerometers tend to drift over time, and can not detect low vibration frequencies, but the acceleration data can be double integrated resulting in changes in positions. The integration of GPS and accelerometers can help to overcome each others’ shortfalls. This paper investigates the use of high rate carrier phase GPS receivers for deflection monitoring of structures. Such receivers include the Javad JNS100, capable of gathering data at up to 100 Hz. Static trials have been conducted to investigate the precision of such a receiver, as well as the potential applications of such a high data rate. Trials were carried out in a controlled environment and actual bridge monitoring, and comparisons made with a Leica SR510 receiver. Key words: Bridge Deflection Monitoring, Data Sampling Rate, RTK GPS, Data Processing. 1 Introduction In 2001, The University of Nottingham was awarded a three year grant from the UK’s Engineering and Physical Sciences Research Council (EPSRC). The overall objective of this project is the creation of a system employing advanced computational tools coupled with GPS and accelerometer sensors able to remotely monitor the health of operational bridges without on-site inspection. For the field measurements being able to validate a compu tational model, such as a Finite Element (FE) model, number and locations of sensors, sampling rate and positioning accuracy are the indexes needed to be considered. The first factor is normally determined by the civil engineers, according to the size and d es ig n of th e monitored structure. The second and third indexes are also related to the size and design of the structure but should be decided by the surveying engineers through choosing appropriate surveying instruments. For a small bridge of several tens of metres in length, the amplitude and vibration frequency of the vertical movements can be a couple of millimetres and tens of Hz. For a large bridge, such as the Humber Bridge, the amplitude and vibration frequency in the vertical direction can be of the order of up to a meter and tenth of Hz, respectively (Meng et al. 2003). To date the highest GPS data rate used in experiments has been 10 and 20 Hz, which means that only bridge dynamics of lower than 10 Hz could be detected, taking other error budgets into account. To overcome the abovementioned shortfall, integration of GPS with triaxial accelerometers has been investigated in a post-processing way. This approach can significantly expand the valid measurable frequency to higher than 100 Hz. However, the absolute positioning fixes have to be provided by the GPS solutions and there is lack of real- time data transmission approach and relevant algorithm to integrate data from two kinds of sensors. Two JNS100 GPS OEM boards were recently purchased from Javad Navigation Systems (Javad Navigation  Roberts et al: High Frequency Deflection Monitoring of Bridges by GPS 227 Systems, 2004), which are able to output raw data and positions 100 times a second without interpolation (Figure 1). These GPS receivers can be used to measure bridge movements and also identify frequency dynamics not higher than 50 Hz, due to Nyquist theorem. Figure 1 The JNS100 OEM board GPS receiver This paper investigates the use of these high rate code/carrier phase GPS receivers for deflection monitoring of structures. Zero baseline, short baseline and kinematic trials have been conducted to assess the precision of such a receiver, as well as the potential applications of such a high data rate. These trials were carried out in a controlled environment as well as for a real bridge monitoring, and comparisons are made with Leica SR510 single frequency GPS receivers gathering data at a sampli ng ra t e o f 10 Hz. 2 Evaluation of receivers’ noise levels in static status: zero baseline (ZBL) and short baseline (SBL) tests The raw code and carrier phase data are output from the receiver to a laptop and recorded using software called PCView. The raw data is automatically converted to Rinex format for post-processing. When the receiver outputs data at 100 Hz there were data overrun problems first on the serial port and then also on the USB port. Due to this the data collected for this paper was only recorded at a 50 Hz data rate, which is still fast enough to measure much higher frequency structural dynamics than has ever been possible with GPS before. The data overrun problems are currently being investigated and using these receivers at 100 Hz data rate will be the subject of future papers. The JNS100 receivers record code and carrier phase data, only on the L1 frequency. Software for processing single frequency data in the context of bridge monitoring has been developed by the authors. This software, called Kinpos, was used to process all the GPS data for this paper. For more information about the software development please see Cosser et al. (2004) or Cosser (2004). 2.1 Zero baseline test Two separate zero baseline trials were conducted on two consecutive days with the JNS100 receivers used on the first day and the Leica SR510 single frequency receivers used on the next. The receivers recorded at the same times on the two days, but offset by 4 minutes, so that they would be recording data with the same satellite geometry. On both days the two receivers of same type were connected by a splitter to the same antenna, a Leica AT503 choke ring antenna which was located on the roof of the IESSG building. The aim was to compare the data from the Leica receivers and JNS100 receivers under similar observation cond itions. Th e Leica dual and single frequency GPS receivers had been used during many bridge trials in the past and their applicability to bridge monitoring is known. The JNS100 receivers were always set up to record at a 50 Hz data rate for all the trials outlined in this paper. In the Kinpos software the data was then processed at a 50 Hz data rate and also resampled before processing to 10 Hz so that it could be directly compared to the Leica data. The standard deviation of the JNS100 coordinates appears greater for the 10 Hz data than for the 50 Hz data. In each case the spread of the data is the same, but a lower standard deviation is recorded for the 50 Hz data as there are more sample points. The processed coordinates in WGS84 are then converted to those in a local coordinate system. The standard deviations of the east, north and vertical components for the Leica and JNS100 receivers can be seen in Table 1. For a fairer comparison the Leica data are compared only with the resampled 10 Hz JNS100 data. It can be seen that the Leica data has a lower standard deviation in every component when compared to the JNS 1 0 0 , w i th the largest difference being seen in the vertical direction. Figure 2 shows the time series of vertical coordinate error of the Leica and JNS100 data at 10 Hz, while comparing to the true coordinates. It is clear from this graph and from Table 1 that the Leica receiver has a smaller spread of coordinates in the vertical direction. This implies that there is a better resolution of the carrier phase by the Leica receivers. However, the noise levels caused by the receivers are less than 1 cm for all three directions and both types of GPS receivers, demonstrating the appropriateness of these receivers for high precision applications. Table 1. Standard Deviation s o f JNS100 and Leica Receivers from ZBL Standard Deviations (m) EastNorth Vertical JNS100 (50 Hz)0.00180.00230.0034 JNS100 (10 Hz)0.00190.00210.0041 Leica (10 Hz)0.00130.00170.0029  228 Journal of Global Positioning Systems Vertical Coordinate Error -0.015 -0.01 -0.005 0 0.005 0.01 0.015 220700.00220800.00220900.00 221000.00 221100.00221200.00 221300.00221400.00 Time (GPS Seconds) Displacement (m) JNS100 Leica Figure 2. Time Series of Vertical Error for JNS100 and Leica Receivers 2.2 Short baseline tests A short baseline test is a truer representation of survey conditions and so the performance of the receivers in practice can be better assessed. Atmospheric errors and clocks are still mitigated, but multipath is now present in the solution. A short baseline trial was conducted on The University of Nottingham campus during July 2004. Two AT503 antennas were positioned on two established points, the coordinates of which were known from previous static surveys. The two points were roughly 50 metres apart. At each end of the baseline, a JNS100 receiver and a Leica SR510 receiver were connected by a splitter to the same antenna, meaning that the baselines measured by each receiver combination were the same. The baselines for this trial were processed in Kinpos and the results can be seen in Table 2 and Figure 3. It can be seen from Table 2 that once again the standard deviations in all three components are lower for the Leica receivers, the largest difference being in the east component, at 1.2mm, demonstrating slightly higher multipath in East- West direction. Figure 3 shows the time series of vertical coordinate error for the Leica receivers and the JNS receivers at 10 Hz. The systematic bias of multipath is now visible within the data and follows the same pattern with slightly different amplitudes for b ot h r eceiver pairs. From Figure 3, it can be found that to improve the positioning precision, multipath need to be mitigated either using appropriate mitigation algorithm or through an internal filter of the receiver hardware and a choke ring antenna. Dodson et al. (2001) investigated the use of an adaptive filtering tech nique for reducing the impact of multipath for str uctural deformation mon itoring. Table 2. Standard Deviation s o f JNS100 and Leica Receivers from SBL Standard Deviation (m) EastNorth Vertical JNS100 (50 Hz)0.00370.00560.0064 JNS100 (10 Hz)0.00370.00560.0067 Leica (10 Hz)0.00250.00500.0057 Vertical Coordinate Error -0.03 -0.02 -0.01 0 0.01 0.02 0.03 121300121400121500 121600 121700121800 121900 122000122100 Time (GPS Seconds) Displacment (m) JNS100 Leica Figure 3. Time Series of Vertical Error for JNS100 and Leica Receivers 3. Evaluation of receivers’ noise level in dynamic status: platform and bridge trials 3.1 Platform test To test the potential of the JNS100 receivers in a dynamic environment, a platform was set up on The University of Nottingham campus (Figure 4). A wooden frame was suspended from a tall tripod by means of a bungee cord, which allowed free oscillation of the platform. The reference receiver was located approximately 10 metres away from the test rig, where an AT503 antenna was connected via a splitter to the Leica SR510 and JNS100 receivers. An AT502 navigation antenna was mounted on the test rig, which was then, via a splitter, conn ected to the JNS100 and Leica SR510 receivers. Using the test rig, two different trials were conducted. For the first test, the platform was in rotation either held still or disturbed from its resting position by someone forcing the platform to move up and down. For the second trial, the platform was just left to swing. The first trial was conducted over a 10 minute time period, where the bungee platform was held still for two minutes and then made to oscillate for 2 minutes and so on in rotation. The results for this trial for the JNS receiver measuring at 50 Hz and resampled at 10 Hz, and for the Leica receiver measuring at 10 Hz can be seen in Figure 5. The amplitude of oscillation of the bungee platform was measured as between 15 and 20 cm by both GPS receivers. The JNS receiver has a period within the last two minutes where there are a number of jumps within the time series, which are caused by undetected cycle slips. Apart from these jumps the measured 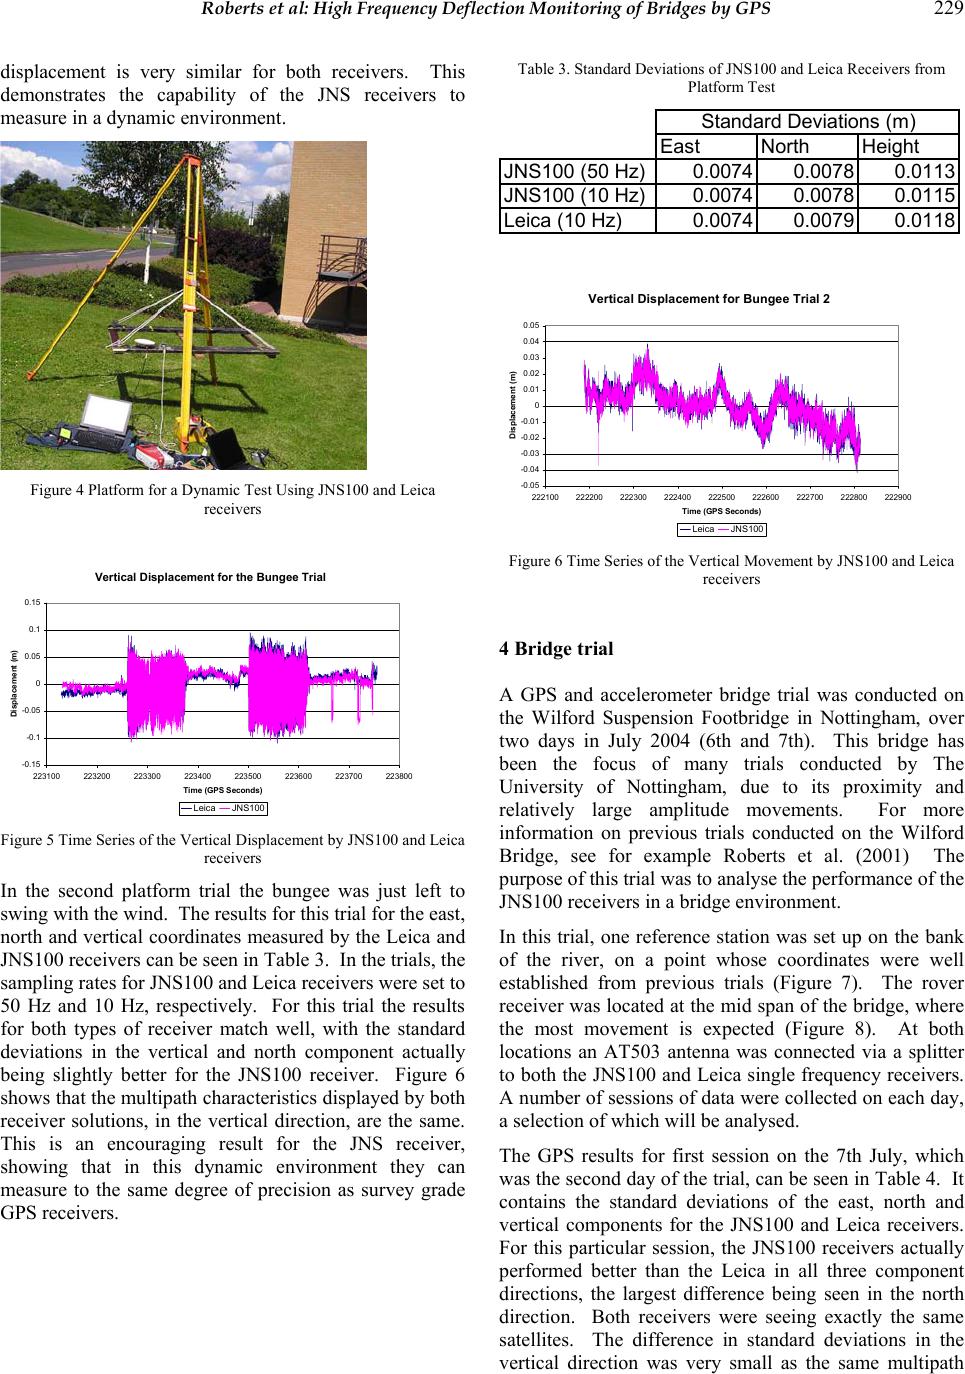 Roberts et al: High Frequency Deflection Monitoring of Bridges by GPS 229 displacement is very similar for both receivers. This demonstrates the capability of the JNS receivers to measure in a dynamic environment. Figure 4 Platform for a D ynamic Test Using JNS100 and Leica receivers Vertical Displacement for the Bungee Trial -0.15 -0.1 -0.05 0 0.05 0.1 0.15 223100 223200 223300 223400 223500 223600 223700 223800 Time (GPS Seconds) Displacement (m) Leica JNS100 Figure 5 Time Ser ies of the Vertical Displacement by JNS100 an d Leica receivers In the second platform trial the bungee was just left to swing with the wind. The results for this trial for the east, north and vertical coordinates measured by the Leica and JNS100 receivers can be seen in Table 3. In the trials, the sampling rates for JNS100 and Leica receivers were set to 50 Hz and 10 Hz, respectively. For this trial the results for both types of receiver match well, with the standard deviations in the vertical and north component actually being slightly better for the JNS100 receiver. Figure 6 shows that the multipath characteristics displayed by both receiver solutions, in the vertical direction, are the same. This is an encouraging result for the JNS receiver, showing that in this dynamic environment they can measure to the same degree of precision as survey grade GPS receivers. Table 3. Standard Deviat io n s o f JN S 10 0 an d Leica Receivers from Platform Test Standard Deviations (m) EastNorth Height JNS100 (50 Hz)0.00740.00780.0113 JNS100 (10 Hz)0.00740.00780.0115 Leica (10 Hz)0.00740.00790.0118 V ertical Displacement for Bunge e Trial 2 -0.05 -0.04 -0.03 -0.02 -0.01 0 0.01 0.02 0.03 0.04 0.05 222100222200222300 222400 222500222600 222700 222800222900 Time ( GP S S ec onds) Displacement (m) Leica JNS100 Figure 6 Time Series of the V ertical Movement by JNS100 and Leica receivers 4 Bridge trial A GPS and accelerometer bridge trial was conducted on the Wilford Suspension Footbridge in Nottingham, over two days in July 2004 (6th and 7th). This bridge has been the focus of many trials conducted by The University of Nottingham, due to its proximity and relatively large amplitude movements. For more information on previous trials conducted on the Wilford Bridge, see for example Roberts et al. (2001) The purpose of this trial was to analyse the performance of the JNS100 receiv er s in a br idge en v ironm e n t . In this trial, one reference station was set up on the bank of the river, on a point whose coordinates were well established from previous trials (Figure 7). The rover receiver was located at the mid span of the bridge, where the most movement is expected (Figure 8). At both locations an AT503 antenna was connected via a splitter to both the JNS100 and Leica single frequency receivers. A number of sessions of data were collected on each day, a selection of which will be analysed. The GPS results for first session on the 7th July, which was the second day of th e trial, can be seen in Table 4. I t contains the standard deviations of the east, north and vertical components for the JNS100 and Leica receivers. For this particular session, the JNS100 receivers actually performed better than the Leica in all three component directions, the largest difference being seen in the north direction. Both receivers were seeing exactly the same satellites. The difference in standard deviations in the vertical direction was very small as the same multipath  230 Journal of Global Positioning Systems pattern can be seen in both times series (Figure 9). For all the sessions during the bridge trial, the results from the JNS100 and Leica receivers were very similar. In some cases the JNS100 was slightly more accurate that the Leica and in some cases this was the other way around. The difference between the two receivers in all cases was very small, showing that in the bridge environment the performance of the JNS100 is comparable with the Leica receivers, even at a much higher sampling rate. Figure 7. Reference st a t io n Figure 8. Rover station Table 4. Standard Deviat io n s o f JN S 10 0 an d Leica Receivers from Bridge Trial Standard Deviation EastNorth Vertical JNS100 (50 Hz)0.00250.00290.0043 JNS100 (10 Hz)0.00250.00290.0045 Leica (10 Hz)0.00270.00360.0046 Also, in the bridge trials the GPS results are compared to a closely located triaxial accelerometer measuring at 50 Hz as well. The periods of the largest movement seen in Figure 10 correspond to times in which people on the bridge jumped up and down in unison ‘forcing’ the bridge to move and then left to oscillate at its natural frequency. In this graph the forced movement is apparent in both the accelerometer and JNS100 data. When the forced movement stops the accelerometer displays a sinusoidal decay, which is movement at the bridge’s natural frequency. This sinusoidal decay is not clear in the GPS data as it is masked by the noise. However, frequency analysis reveals that that this sinusoidal pattern is still present in the GPS data even though it cannot be discerned by the eye (Meng et al., 2004). Vertical Displacement, Session bdg7_1a -0.02 -0.015 -0.01 -0.005 0 0.00 5 0.01 0.01 5 0.02 294100 294200 294300 294400 294500 294600 294700 294800 294900 Time (GPS Seconds) Displacement (m) Leica JNS100 Figure 9. Vertical displacement by JNS100 Resampled to 10 Hz and the Leica receivers Vertical Displacement, Session bdg7_1a -0.03 -0.02 -0.01 0 0.01 0.02 0.03 294420.00 294430.00 294440.00 294450.00 294460.00294470.00 Time (G PS Secon ds) Displacement (m) JNS100 Accelerometer Figure 10. JNS100 and accelerometer displacement in the vertical direction both recorded at 50 Hz. The graph focuses on a time where there was the largest movement on the bridge. The accelerometer data is offset by 0.015m 4 Conclusion s This paper has outlined the preliminary work conducted with the JNS100 receivers. Zero baseline and static short baseline trials have been conducted to assess the precision of the receivers compared to known high quality survey grade receivers (Leica system 500 single frequency receivers). The results showed that the Leica receivers performed slightly better than the JNS100 in the static trials, but the difference was small. The JNS100 receivers do have a high precision carrier phase observables. Kinematic trials were performed on a bungee test rig and also on a bridge. In a dynamic situation the JNS100 receivers performed as well as the Leica receivers. The JNS100 results, measured at 50 Hz, were also compared  Roberts et al: High Frequency Deflection Monitoring of Bridges by GPS 231 to those from a closely located triaxial accelerometer measuring at the same data rate. JNS100 bridge trial results compared well to the accelerometer findings, when identifying the periods of largest movement. Most movement on the bridge was masked by the GPS noise, but periods where large displacements occurred could be discerned. Acknowledgements This project has been funded by the UK’s Engineering and Physical Sciences Research Council (EPSRC) in conjunction with Cranfield University (ref no GR/R28218/01). The authors would like to thank Louise Arrowsmith who took part in the field work whilst working towards her MSc. References Cosser E (2004) Bridge Deflection Monitoring and Frequency Identification with Single Frequency GPS Receivers, ION GPS 2004, The 17th Technical Meeting of the Satellite Division of the Institute of Navigation, 21-24 September, Long Beach, California. Cosser E, Roberts G W, Meng X and Dodson A H (2004) Single Frequency GPS for Bridge Deflection Monitoring: Progress and Results, 1st FIG International Symposium on Engineering Surveys for Construction Works and Structural Engineering, 28 June-1 July, Nottingham, England. Dodson A H, Meng X and Roberts G W (2001) Adaptive Methods for Multipath Mitigation and Its Applications for Structural Deflection Monitoring, International Symposium on Kinematic Systems in Geodesy, Geomatics and Navigation (KIS 2001), 5-8 June, Banff, Canada. Javad Navigation Systems (2004) OEM boards, [online]. Available at: <http://www.javad.com/> [Accessed 12 August 2004]. Langley R (1997) GPS Receiver System Noise, GPS World 8(6): 40-45. Meng X (2002) Real-time Deformation Monitoring of Bridges Using GPS/Accelerometers, PhD thesis, The University of Nottingham, Nottingham, UK. Meng X, Meo M, Roberts G W, Dodson A H, Cosser E, Iuliano E and Morris A (2003) Validating GPS Based Bridge Deformation Monitoring with Finite Element Model, GNSS 2003, 22-25 April, Graz, Austria. Meng X, Roberts G W, Dodson A H, Andreotti M, Cosser E and Meo M (2004) Development of a Prototype Remote Structural Health Monitoring System (RSHMS), 1st FIG International Symposium on Engineering Surveys for Construction Works and Structural Engineering, 28 June-1 July, Nottingham, England. Roberts G W, Meng X and Dodson A H (2001) The Use of Kinematic GPS and Triaxial Accelerometers to Monitor the Deflections of Large Bridges, 10th International Symposium on Deformation Measurement, FIG, 19-22 March, California, USA. |