 Computational Water, Energy, and Environmental Engineering, 2013, 2, 9-20 http://dx.doi.org/10.4236/cweee.2013.21002 Published Online January 2013 (http://www.scirp.org/journal/cweee) On the Short-Term Optimisation of a Hydro Basin with Social Constraints Gloria Hermida, Edgardo D. Castronuovo University Carlos III de Madrid, Madrid, Spain Email: gloriahermida@gmail.com, ecastron@ing.uc3m.es Received November 19, 2012; revised December 20, 2012; accepted January 3, 2013 ABSTRACT In this paper, an optimisation problem for calculating the best energy bids of a set of hydro power plants in a basin is proposed. The model is applied to a real Spanish basin for the short-term (24-hour) planning of the operation. The algo- rithm considers the ecological flows and social consumptions required for the actual operation. One of the hydro plants is fluent, without direct-control abilities. The results show that the fluent plant can be adequately controlled by using the storage capacities of the other plants. In the simulations, the costs related to the social consumptions are more signifi- cant than those due to the ecological requirements. An estimate of the cost of providing water for social uses is per- formed in the study. Keywords: Hydro Power Plants; Hydro Generation; Optimisation; Short-Term Planning; Social Resources 1. Introduction Nowadays, the utilisation of water for electricity produc- tion is conditioned by many constraints. In Spain, pri- marily the Kyoto Agreements and the proposals of the European Commission to 2020 must be considered. The European Commission have specified a goal of 20% of the final energy consumption delivered from renewable sources by 2020 [1]. In Spain, 38.6% of the electricity generation comes from renewable resources, mainly from hydro (17.4%) and wind (16.6%) generation [2]. Because electricity generation has to compensate for other non- renewable energy consumptions, electricity production must increase its share of renewable generation. Hydro production is a mature renewable technology that can help reach the ambitious objectives proposed by the European Commission by 2020. In addition, the exceptionally variable weather condi- tions of the past few years, most likely due to climate change, complicate the management of water for elec- tricity production. The scarcity and the high variability of water resources have recently reduced the profits in sev- eral zones [3-6]. Many studies have been performed to calculate the op- timal operation of a hydro basin. In long-term planning, Soares and Carneiro [7] consider the operation planning of a hydrothermal power system in Brazil. The paper highlights the importance on the control of the head hy- dro power plants (HPPs) in the basin. Granville et al. [8] consider the stochastic characteristics of the problem, including a representation of the market. The solution algorithm is based on stochastic dual dynamic program- ming. Cheng [9] applies particle swarm optimisation and dynamic programming for a large scale hydro system in China. Oliveira, Binato and Pereira [10] present two techniques: the extension of a binary disjunctive tech- nique and screening strategies for planning studies in Brazil and Bolivia. Fosso et al. [11] give an overview of the planning tool used in Norway for long, medium and short horizons. Kanudia and Loulou [12] propose a sto- chastic version of the extended market allocation model for a hydro system in Québec, Canada. In medium- and short-term planning, Habibollahzadeh and Bubenko [13] compare different mathematical methods: Heuristic, Benders and Lagrange methods for hydroelectric generation scheduling in the Swiss system. Castronuovo and Peças Lopez [14] describe economic profits of the coordination of wind and hydro energies. Zhao and Davison [15] analyse the inclusion of storage facilities in a hydro system, demonstrating the sensitive dependences between some of the parameters of the hy- droelectric facility, the expected prices and water inflows. Pousinho, Mendes and Catalão [16] propose a mixed- integer quadratic programming approach for the short- term hydro scheduling problem, considering discontinu- ous operating regions and discharge ramping constraints. Simopoulos, Kavatza and Vournas [17] propose a de- coupling method, dividing the hydrothermal problem into hydro and thermal sub-problems, which are solved inde- pendently. A Greek system is analysed in the study. Di- C opyright © 2013 SciRes. CWEEE 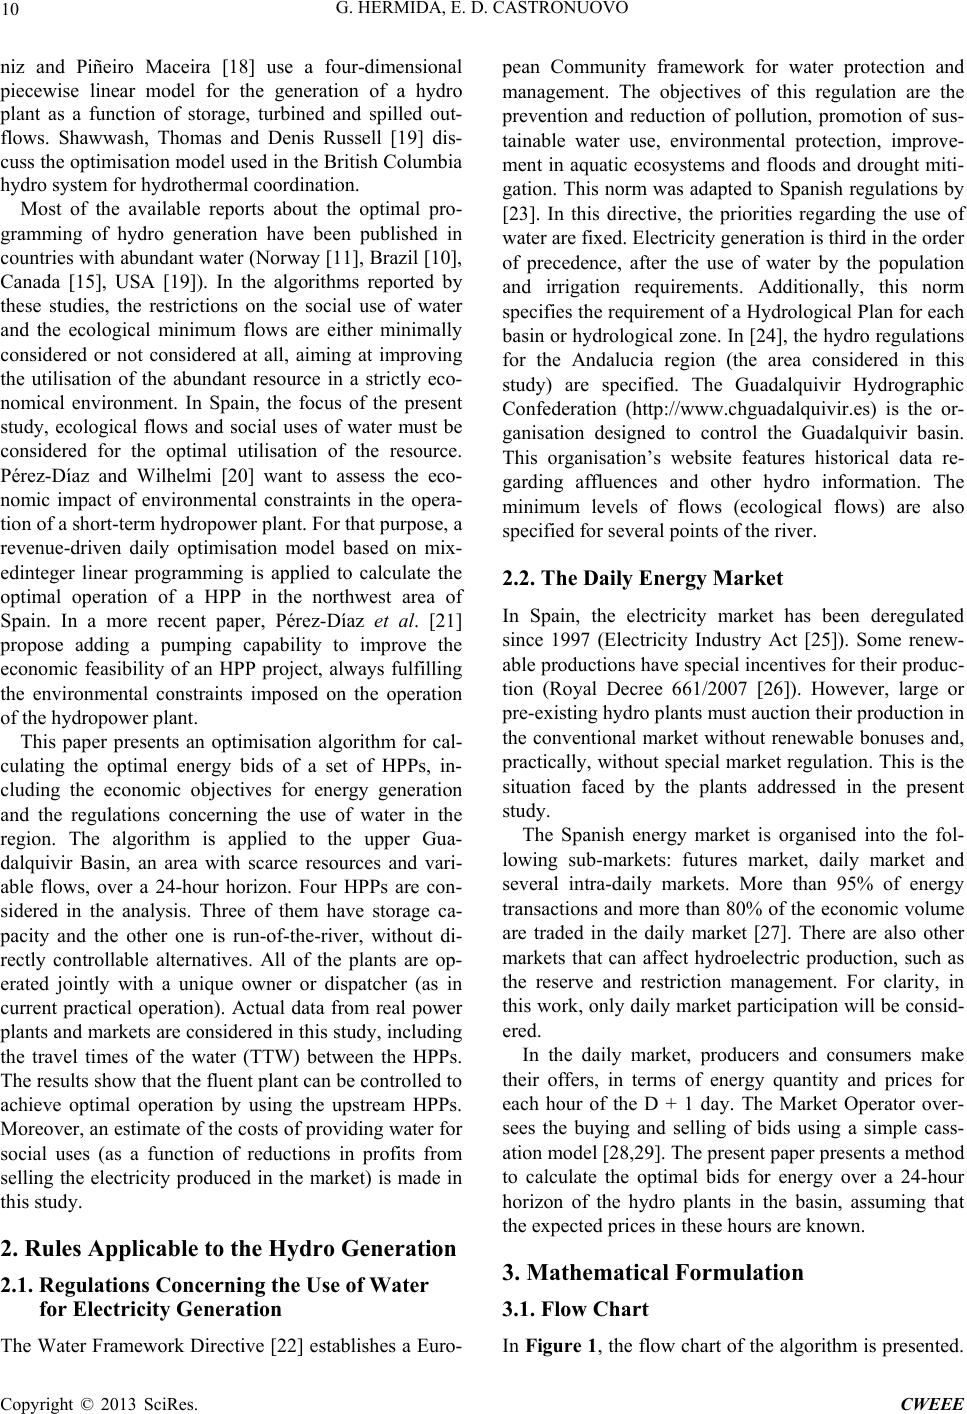 G. HERMIDA, E. D. CASTRONUOVO 10 niz and Piñeiro Maceira [18] use a four-dimensional piecewise linear model for the generation of a hydro plant as a function of storage, turbined and spilled out- flows. Shawwash, Thomas and Denis Russell [19] dis- cuss the optimisation model used in the British Columbia hydro system for hydrothermal coordination. Most of the available reports about the optimal pro- gramming of hydro generation have been published in countries with abundant water (Norway [11], Brazil [10], Canada [15], USA [19]). In the algorithms reported by these studies, the restrictions on the social use of water and the ecological minimum flows are either minimally considered or not considered at all, aiming at improving the utilisation of the abundant resource in a strictly eco- nomical environment. In Spain, the focus of the present study, ecological flows and social uses of water must be considered for the optimal utilisation of the resource. Pérez-Díaz and Wilhelmi [20] want to assess the eco- nomic impact of environmental constraints in the opera- tion of a short-term hydropower plant. For that purpose, a revenue-driven daily optimisation model based on mix- edinteger linear programming is applied to calculate the optimal operation of a HPP in the northwest area of Spain. In a more recent paper, Pérez-Díaz et al. [21] propose adding a pumping capability to improve the economic feasibility of an HPP project, always fulfilling the environmental constraints imposed on the operation of the hydropower plant. This paper presents an optimisation algorithm for cal- culating the optimal energy bids of a set of HPPs, in- cluding the economic objectives for energy generation and the regulations concerning the use of water in the region. The algorithm is applied to the upper Gua- dalquivir Basin, an area with scarce resources and vari- able flows, over a 24-hour horizon. Four HPPs are con- sidered in the analysis. Three of them have storage ca- pacity and the other one is run-of-the-river, without di- rectly controllable alternatives. All of the plants are op- erated jointly with a unique owner or dispatcher (as in current practical operation). Actual data from real power plants and markets are considered in this study, including the travel times of the water (TTW) between the HPPs. The results show that the fluent plant can be controlled to achieve optimal operation by using the upstream HPPs. Moreover, an estimate of the costs of providing water for social uses (as a function of reductions in profits from selling the electricity produced in the market) is made in this study. 2. Rules Applicable to the Hydro Generation 2.1. Regulations Concerning the Use of Water for Electricity Generation The Water Framework Directive [22] establishes a Euro- pean Community framework for water protection and management. The objectives of this regulation are the prevention and reduction of pollution, promotion of sus- tainable water use, environmental protection, improve- ment in aquatic ecosystems and floods and drought miti- gation. This norm was adapted to Spanish regulations by [23]. In this directive, the priorities regarding the use of water are fixed. Electricity generation is third in the order of precedence, after the use of water by the population and irrigation requirements. Additionally, this norm specifies the requirement of a Hydrological Plan for each basin or hydrological zone. In [24], the hydro regulations for the Andalucia region (the area considered in this study) are specified. The Guadalquivir Hydrographic Confederation (http://www.chguadalquivir.es) is the or- ganisation designed to control the Guadalquivir basin. This organisation’s website features historical data re- garding affluences and other hydro information. The minimum levels of flows (ecological flows) are also specified for several points of the river. 2.2. The Daily Energy Market In Spain, the electricity market has been deregulated since 1997 (Electricity Industry Act [25]). Some renew- able productions have special incentives for their produc- tion (Royal Decree 661/2007 [26]). However, large or pre-existing hydro plants must auction their production in the conventional market without renewable bonuses and, practically, without special market regulation. This is the situation faced by the plants addressed in the present study. The Spanish energy market is organised into the fol- lowing sub-markets: futures market, daily market and several intra-daily markets. More than 95% of energy transactions and more than 80% of the economic volume are traded in the daily market [27]. There are also other markets that can affect hydroelectric production, such as the reserve and restriction management. For clarity, in this work, only daily market participation will be consid- ered. In the daily market, producers and consumers make their offers, in terms of energy quantity and prices for each hour of the D + 1 day. The Market Operator over- sees the buying and selling of bids using a simple cass- ation model [28,29]. The present paper presents a method to calculate the optimal bids for energy over a 24-hour horizon of the hydro plants in the basin, assuming that the expected prices in these hours are known. 3. Mathematical Formulation 3.1. Flow Chart In Figure 1, the flow chart of the algorithm is presented. Copyright © 2013 SciRes. CWEEE 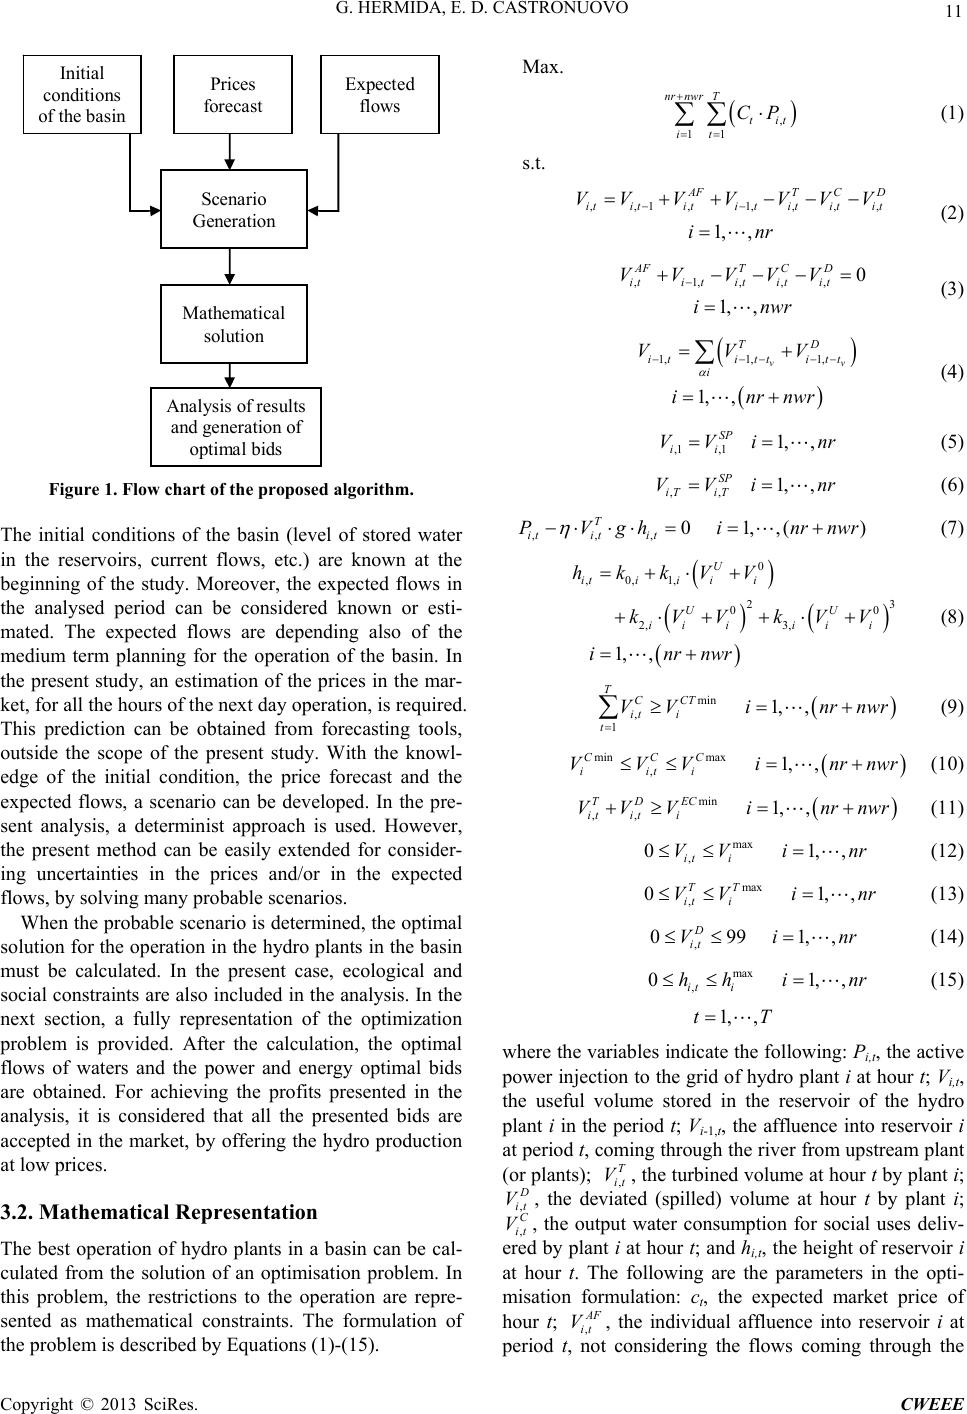 G. HERMIDA, E. D. CASTRONUOVO 11 Initial conditions of the basi Expected flows Scenario Generation Mathematical solution Analysis of results and generation of o timal bids Prices forecast Figure 1. Flow chart of the proposed algorithm. The initial conditions of the basin (level of stored water in the reservoirs, current flows, etc.) are known at the beginning of the study. Moreover, the expected flows in the analysed period can be considered known or esti- mated. The expected flows are depending also of the medium term planning for the operation of the basin. In the present study, an estimation of the prices in the mar- ket, for all the hours of the next day operation, is required. This prediction can be obtained from forecasting tools, outside the scope of the present study. With the knowl- edge of the initial condition, the price forecast and the expected flows, a scenario can be developed. In the pre- sent analysis, a determinist approach is used. However, the present method can be easily extended for consider- ing uncertainties in the prices and/or in the expected flows, by solving many probable scenarios. When the probable scenario is determined, the optimal solution for the operation in the hydro plants in the basin must be calculated. In the present case, ecological and social constraints are also included in the analysis. In the next section, a fully representation of the optimization problem is provided. After the calculation, the optimal flows of waters and the power and energy optimal bids are obtained. For achieving the profits presented in the analysis, it is considered that all the presented bids are accepted in the market, by offering the hydro production at low prices. 3.2. Mathematical Representation The best operation of hydro plants in a basin can be cal- culated from the solution of an optimisation problem. In this problem, the restrictions to the operation are repre- sented as mathematical constraints. The formulation of the problem is described by Equations (1)-(15). Max. , 11 nr nwr T tit it CP , (1) s.t. ,,1, 1,,, 1, , AFT C D itititi tititit VVV VVVV inr (2) ,1,,,, 0 1, , AFT CD iti tititit VVVVV inwr (3) 1,1, 1, 1, , v TD ititt itt i VVV inrnwr v r r r (4) ,1,1 1,, SP ii VV in (5) ,, 1,, SP iT iT VVi n (6) ,,, 0 1,,() T itit it PVghi nrnw (7) 0 ,0,1, 23 00 2, 3, 1,, U itiiii UU ii iii i hkkVV kVV kVV inrnwr r ,r ,r ,nr ,r (8) min , 1 1,, TCCT it i t VV i nrnwr (9) min max , 1,, CCC iiti VVV inrnw (10) min ,, 1,, TDEC it iti VV Vinrnwr (11) max , 0 1, it i VV in (12) max , 0 1, TT it i VVi n (13) , 099 1, D it Vi (14) max , 0 1, it i hh in (15) 1, ,tT where the variables indicate the following: Pi,t, the active power injection to the grid of hydro plant i at hour t; Vi,t, the useful volume stored in the reservoir of the hydro plant i in the period t; Vi-1,t, the affluence into reservoir i at period t, coming through the river from upstream plant (or plants); , the turbined volume at hour t by plant i; , T it V , it V , C it V peri , the deviated (spilled) volume at hour t by plant i; , the output water consumption for social uses deliv- ered by plant i at hour t; and hi,t, the height of reservoir i at hour t. The following are the parameters in the opti- misation formulation: ct, the expected market price of hour t; , the individual affluence into reservoir i at , AF it V t, od onsidering the flows coming through the not c Copyright © 2013 SciRes. CWEEE 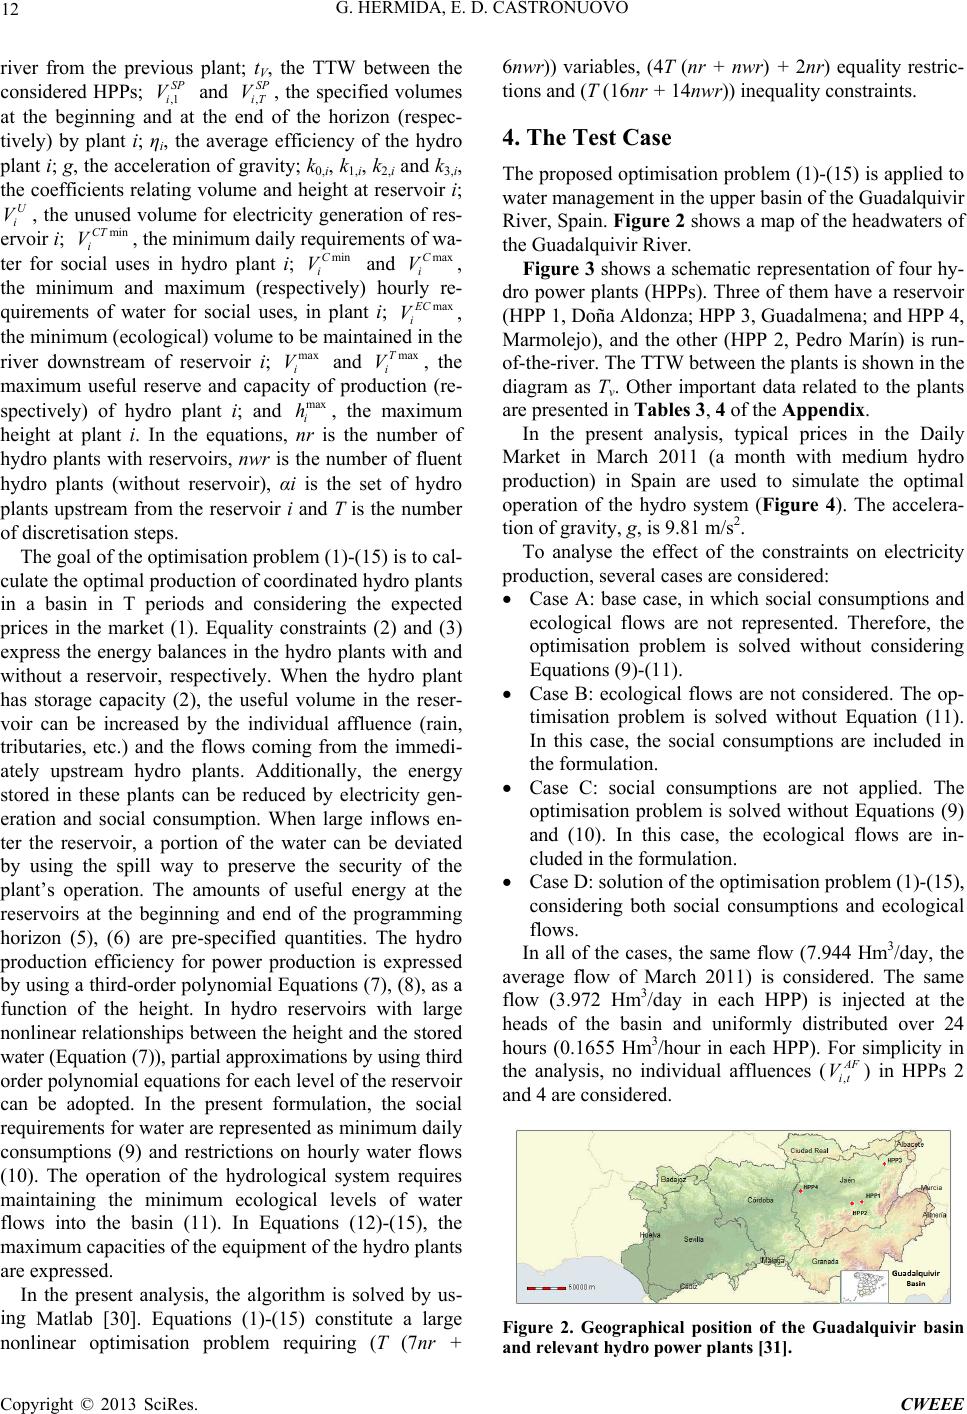 G. HERMIDA, E. D. CASTRONUOVO 12 river from the previous plant; tV, the TTW between the considered HPPs; ,1 SP i V and , SP iT V, the specified volumes at the beginning at the eof the horizon (respec- tively) by plant i; ηi, the average efficiency of the hydro plant i; g, the acceleration of gravity; k0,i, k1,i, k2,i and k3,i, the coefficients relating volume and height at reservoir i; U i V, the unused volume for electricity generation of res- ir i; minCT i V, the minimum daily requirements of wa- ter for social uses in hydro plant i; minC i V and maxC i V, the minimum and maximum (respectively) hour- quirements of water for social uses, in plant i; maxEC i V, the minimum (ecological) volume to be maintained in the river downstream of reservoir i; max i V and maxT i V, the maximum useful reserve and capaf prod (re- spectively) of hydro plant i; and max i h, the maximum height at plant i. In the equations, the number of hydro plants with reservoirs, nwr is the number of fluent hydro plants (without reservoir), αi is the set of hydro plants upstream from the reservoir i and T is the number of discretisation steps. The goal of the optim nd a analys nd ro go ervo cu ing ly re n is to cal- by us- cit b y o nr is lem (1)- rithm uctio isation p(1 is, the al 4. The Test Case tion problem (1)-(15) is applied to matic representation of four hy- dr the Daily M constraints on electricity pr nsumptions and lows are not considered. The op- onsumptions are not applied. The isation problem (1)-(15), the cases, the same flow (7.944 Hm /day, the av 5) is solved late the optimal production of coordinated hydro plants in a basin in T periods and considering the expected prices in the market (1). Equality constraints (2) and (3) express the energy balances in the hydro plants with and without a reservoir, respectively. When the hydro plant has storage capacity (2), the useful volume in the reser- voir can be increased by the individual affluence (rain, tributaries, etc.) and the flows coming from the immedi- ately upstream hydro plants. Additionally, the energy stored in these plants can be reduced by electricity gen- eration and social consumption. When large inflows en- ter the reservoir, a portion of the water can be deviated by using the spill way to preserve the security of the plant’s operation. The amounts of useful energy at the reservoirs at the beginning and end of the programming horizon (5), (6) are pre-specified quantities. The hydro production efficiency for power production is expressed by using a third-order polynomial Equations (7), (8), as a function of the height. In hydro reservoirs with large nonlinear relationships between the height and the stored water (Equation (7)), partial approximations by using third order polynomial equations for each level of the reservoir can be adopted. In the present formulation, the social requirements for water are represented as minimum daily consumptions (9) and restrictions on hourly water flows (10). The operation of the hydrological system requires maintaining the minimum ecological levels of water flows into the basin (11). In Equations (12)-(15), the maximum capacities of the equipment of the hydro plants are expressed. In the present Matlab [30]. Equations (1)-(15) constitute a large nonlinear optimisation problem requiring (T (7nr + 6nwr)) variables, (4T (nr + nwr) + 2nr) equality restric- tions and (T (16nr + 14nwr)) inequality constraints. The proposed optimisa water management in the upper basin of the Guadalquivir River, Spain. Figure 2 shows a map of the headwaters of the Guadalquivir River. Figure 3 shows a sche o power plants (HPPs). Three of them have a reservoir (HPP 1, Doña Aldonza; HPP 3, Guadalmena; and HPP 4, Marmolejo), and the other (HPP 2, Pedro Marín) is run- of-the-river. The TTW between the plants is shown in the diagram as Tv. Other important data related to the plants are presented in Tables 3, 4 of the Appendix. In the present analysis, typical prices in arket in March 2011 (a month with medium hydro production) in Spain are used to simulate the optimal operation of the hydro system (Figure 4). The accelera- tion of gravity, g, is 9.81 m/s2. To analyse the effect of the oduction, several cases are considered: Case A: base case, in which social co ecological flows are not represented. Therefore, the optimisation problem is solved without considering Equations (9)-(11). Case B: ecological f timisation problem is solved without Equation (11). In this case, the social consumptions are included in the formulation. Case C: social c optimisation problem is solved without Equations (9) and (10). In this case, the ecological flows are in- cluded in the formulation. Case D: solution of the optim considering both social consumptions and ecological flows. In all of3 erage flow of March 2011) is considered. The same flow (3.972 Hm3/day in each HPP) is injected at the heads of the basin and uniformly distributed over 24 hours (0.1655 Hm3/hour in each HPP). For simplicity in the analysis, no individual affluences (, AF it V) in HPPs 2 and 4 are considered. Figure 2. Geographical position of the Guadalquivir basin and relevant hydro power plants [31]. Copyright © 2013 SciRes. CWEEE 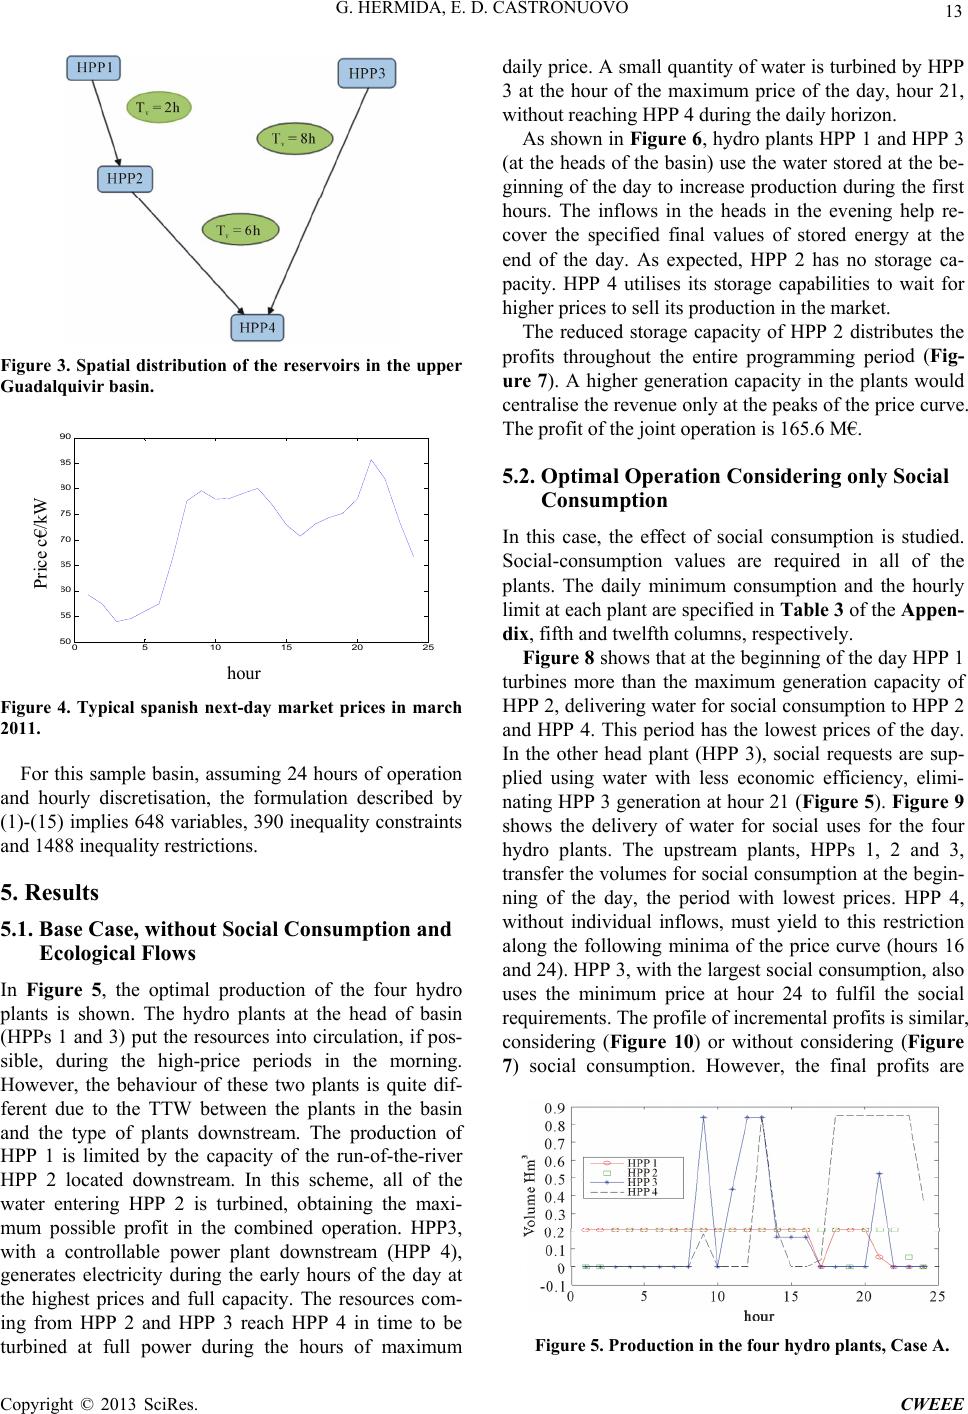 G. HERMIDA, E. D. CASTRONUOVO 13 Figure 3. Spatial distribution of the reservoirs in tpper Guadalquivir basin. he u 0510 15 20 25 50 55 60 65 70 75 80 85 90 periodo de programación precio horario Pri k hour Figure 4. Typical spanish next-day market prices in mah 2011. this sample basin, assuming 24 hours of operation n se, without Social Consumption and In Fproduction of the four hydro the be- gi d (Fig- ur y Social Consumption . Socies are required in all of the capacity of H rc For ad hourly discretisation, the formulation described by (1)-(15) implies 648 variables, 390 inequality constraints and 1488 inequality restrictions. 5. Results 5.1. Base Ca Ecological Flows igure 5, the optimal plants is shown. The hydro plants at the head of basin (HPPs 1 and 3) put the resources into circulation, if pos- sible, during the high-price periods in the morning. However, the behaviour of these two plants is quite dif- ferent due to the TTW between the plants in the basin and the type of plants downstream. The production of HPP 1 is limited by the capacity of the run-of-the-river HPP 2 located downstream. In this scheme, all of the water entering HPP 2 is turbined, obtaining the maxi- mum possible profit in the combined operation. HPP3, with a controllable power plant downstream (HPP 4), generates electricity during the early hours of the day at the highest prices and full capacity. The resources com- ing from HPP 2 and HPP 3 reach HPP 4 in time to be turbined at full power during the hours of maximum daily price. A small quantity of water is turbined by HPP 3 at the hour of the maximum price of the day, hour 21, without reaching HPP 4 during the daily horizon. As shown in Figure 6, hydro plants HPP 1 and HPP 3 (at the heads of the basin) use the water stored at nning of the day to increase production during the first hours. The inflows in the heads in the evening help re- cover the specified final values of stored energy at the end of the day. As expected, HPP 2 has no storage ca- pacity. HPP 4 utilises its storage capabilities to wait for higher prices to sell its production in the market. The reduced storage capacity of HPP 2 distributes the profits throughout the entire programming perio e 7). A higher generation capacity in the plants would centralise the revenue only at the peaks of the price curve. The profit of the joint operation is 165.6 M€. 5.2. Optimal Operation Considering onl In this case, the effect of social consumption is studied al-consumption valu plants. The daily minimum consumption and the hourly limit at each plant are specified in Table 3 of the Appen- dix, fifth and twelfth columns, respectively. Figure 8 shows that at the beginning of the day HPP 1 turbines more than the maximum generation PP 2, delivering water for social consumption to HPP 2 and HPP 4. This period has the lowest prices of the day. In the other head plant (HPP 3), social requests are sup- plied using water with less economic efficiency, elimi- nating HPP 3 generation at hour 21 (Figure 5). Figure 9 shows the delivery of water for social uses for the four hydro plants. The upstream plants, HPPs 1, 2 and 3, transfer the volumes for social consumption at the begin- ning of the day, the period with lowest prices. HPP 4, without individual inflows, must yield to this restriction along the following minima of the price curve (hours 16 and 24). HPP 3, with the largest social consumption, also uses the minimum price at hour 24 to fulfil the social requirements. The profile of incremental profits is similar, considering (Figure 10) or without considering (Figure 7) social consumption. However, the final profits are Figure 5. Production in the four hydro plants, Case A. Copyright © 2013 SciRes. CWEEE 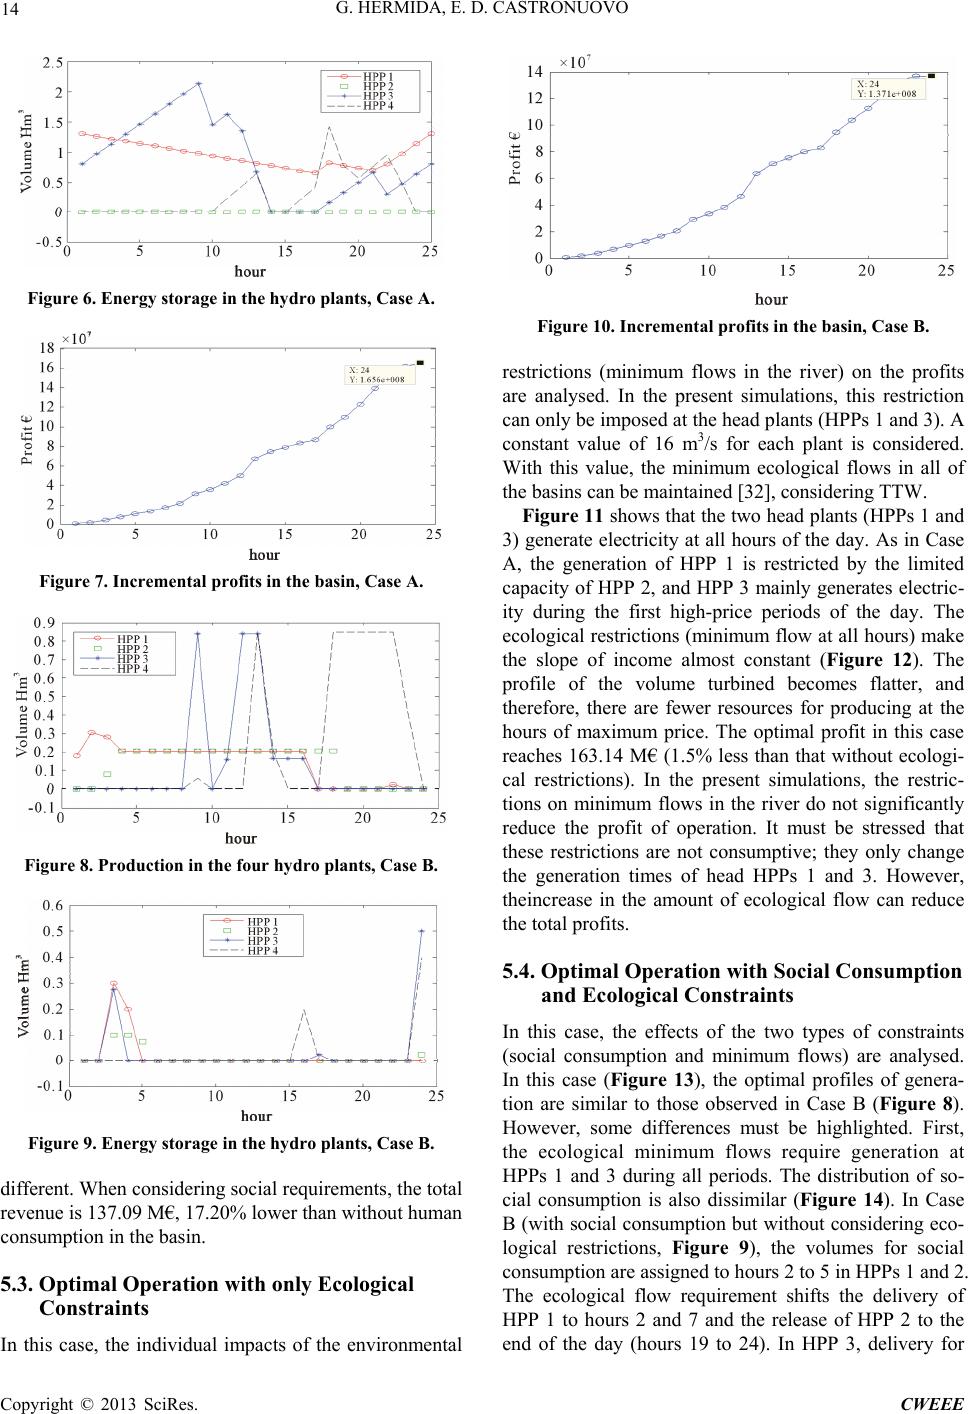 G. HERMIDA, E. D. CASTRONUOVO 14 Figure 6. Energy storage in the hydro plants, Case A. Figure 7. Incremental profits in the basin, Case A. Figure 8. Production in the four hydro plants, Case B. Figure 10. Incremental profits in the basin, Case B. restrictions (minimum flows in the river) on the profits are analysed. In the prese nt simulations, this restriction can only be imposed at the head plants (HPPs 1 and 3). A ered. With minimum ecological flows in all of 3) generate electricity at all hours of the day. As in Case A, the generation of HPP 1 is restricted by the limited capacity of HPP 2, and HPP 3 mainly generates electric- ity during the first high-price periods of the day. The ecological restrictions (minimum flow at all hours) make the slope of income almost constant (Figure 12). The profile of the volume turbined becomes flatter, and therefore, there are fewer resources for producing at the hours of maximum price. The optimal profit in this case reaches 163.14 M€ (1.5% less than that without ecologi- cal ic- ons on minimum flows in the river do not significantly 5. constant value of 16 m3/s for each plant is consid this value, the the basins can be maintained [32], considering TTW. Figure 11 shows that the two head plants (HPPs 1 and restrictions). In the present simulations, the restr ti reduce the profit of operation. It must be stressed that these restrictions are not consumptive; they only change the generation times of head HPPs 1 and 3. However, theincrease in the amount of ecological flow can reduce the total profits. 4. Optimal Operation with Social Consumption and Ecological Constraints In this case, the effects of the two types of constraints (social consumption and minimum flows) are analysed. In this case (Figure 13), the optimal profiles of genera- tion are similar to those observed in Case B (Figure 8). However, some differences must be highlighted. First, the ecological minimum flows require generation at HPPs 1 and 3 during all periods. The distribution of so- cial consumption is also dissimilar (Figure 14). In Case B (with social consumption but without considering eco- logical restrictions, Figure 9), the volumes for social consumption are assigned to hours 2 to 5 in HPPs 1 and 2. The ecological flow requirement shifts the delivery of HPP 1 to hours 2 and 7 and the release of HPP 2 to the end of the day (hours 19 to 24). In HPP 3, delivery for Figure 9. Energy storage in the hydro plants, Case B. different. When considering social requirements, the total revenue is 137.09 M€, 17.20% lower than without human consumption in the basin. 5.3. Optimal Operation with only Ecological Constraints In this case, the individual impacts of the environmental Copyright © 2013 SciRes. CWEEE 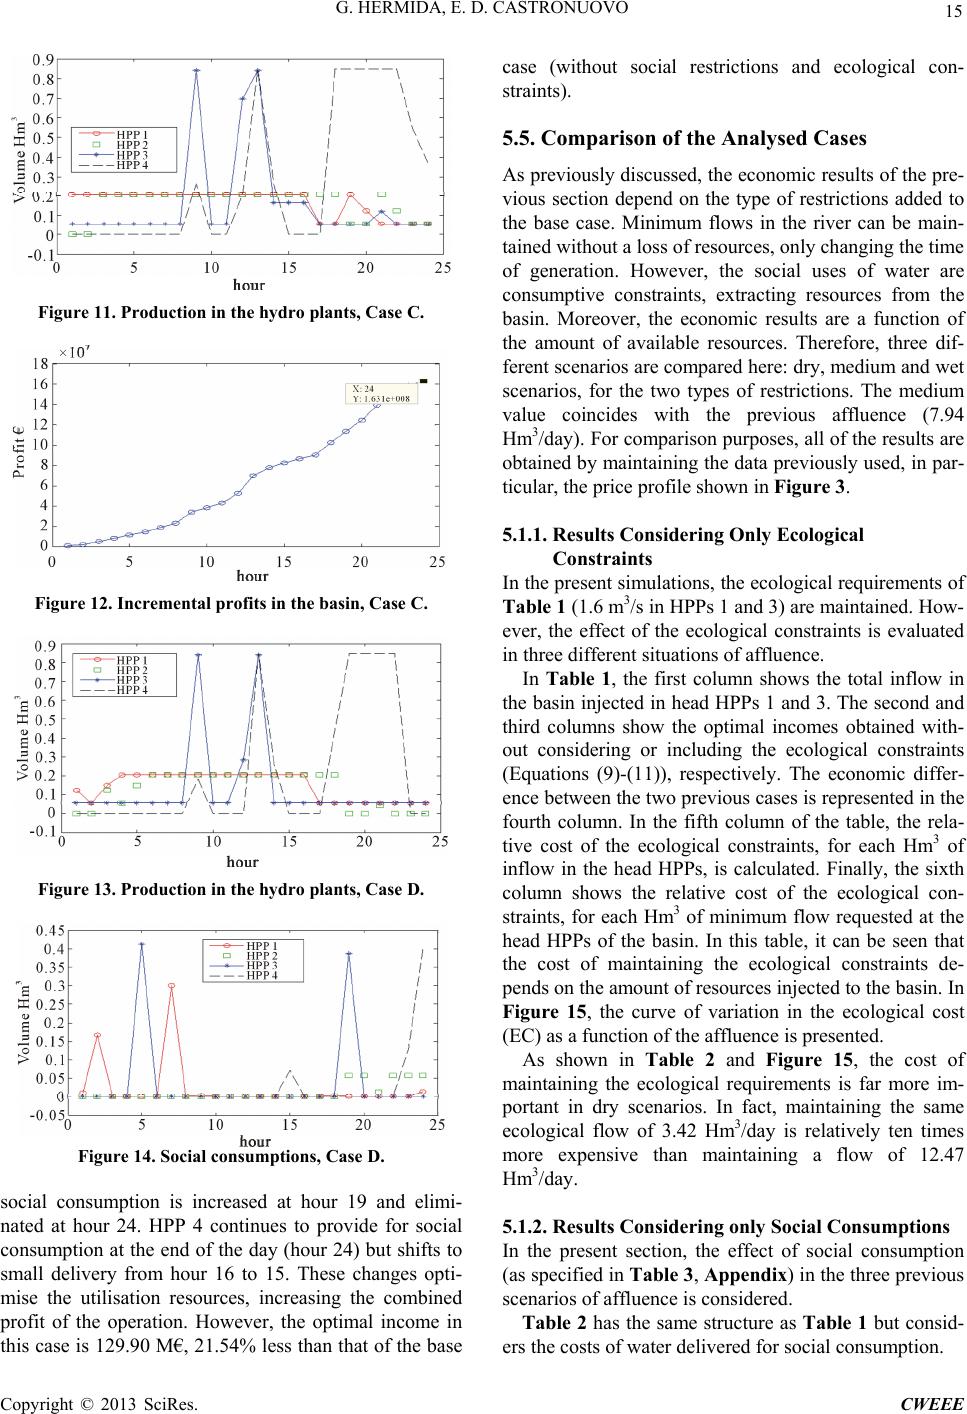 G. HERMIDA, E. D. CASTRONUOVO 15 Figure 11. Production in the hydro plants, Case C. Figure 12. Incremental profits in the basin, Case C. Figure 13. Production in the hydro plants, Case D. Figure 14. Social consumptions, Case D. social consumption is increased at hour 19 and elimi- nated at hour 24. HPP 4 continues to provide for social consumption at the end of the day (hour 24) but shifts to small delivery from hour 16 to 15. These changes opti- mise the utilisation resources, increasing the combined profit of the operation. However, the optimal income this case is 129.90 M€, 21.54% less than that of the base caseon- straints). 5.5. Comparison of the Analysed Cases As previously discussed, the economic results of the pre- vious section depend on the type of restrictions added to the base case. Minimum flows in the river can be main- tained without a loss of resources, only changing the time of generation. However, the social uses of water are consumptive constraints, extracting resources from the basin. Mction of the amouree dif- sent simulations, the ecological requirements of evaluated nstraints de- pends on the amount of resources injected to the basin. In gical cost (EC) f the affluence is presented. tively ten times m ers the costs of water delivered for social consumption. in (without social restrictions and ecological c oreover, the economic results are a fun nt of available resources. Therefore, th ferent scenarios are compared here: dry, medium and wet scenarios, for the two types of restrictions. The medium value coincides with the previous affluence (7.94 Hm3/day). For comparison purposes, all of the results are obtained by maintaining the data previously used, in par- ticular, the price profile shown in Figure 3. 5.1.1. Results Considering Only Ecological Constraints In the pre Table 1 (1.6 m3/s in HPPs 1 and 3) are maintained. How- ever, the effect of the ecological constraints is in three different situations of affluence. In Table 1, the first column shows the total inflow in the basin injected in head HPPs 1 and 3. The second and third columns show the optimal incomes obtained with- out considering or including the ecological constraints (Equations (9)-(11)), respectively. The economic differ- ence between the two previous cases is represented in the fourth column. In the fifth column of the table, the rela- tive cost of the ecological constraints, for each Hm3 of inflow in the head HPPs, is calculated. Finally, the sixth column shows the relative cost of the ecological con- straints, for each Hm3 of minimum flow requested at the head HPPs of the basin. In this table, it can be seen that the cost of maintaining the ecological co Figure 15, the curve of variation in the ecolo as a function o As shown in Table 2 and Figure 15, the cost of maintaining the ecological requirements is far more im- portant in dry scenarios. In fact, maintaining the same ecological flow of 3.42 Hm3/day is rela ore expensive than maintaining a flow of 12.47 Hm3/day. 5.1.2. Results Considering only Social Consumptions In the present section, the effect of social consumption (as specified in Table 3, Appendix) in the three previous scenarios of affluence is considered. Table 2 has the same structure as Table 1 but consid- Copyright © 2013 SciRes. CWEEE 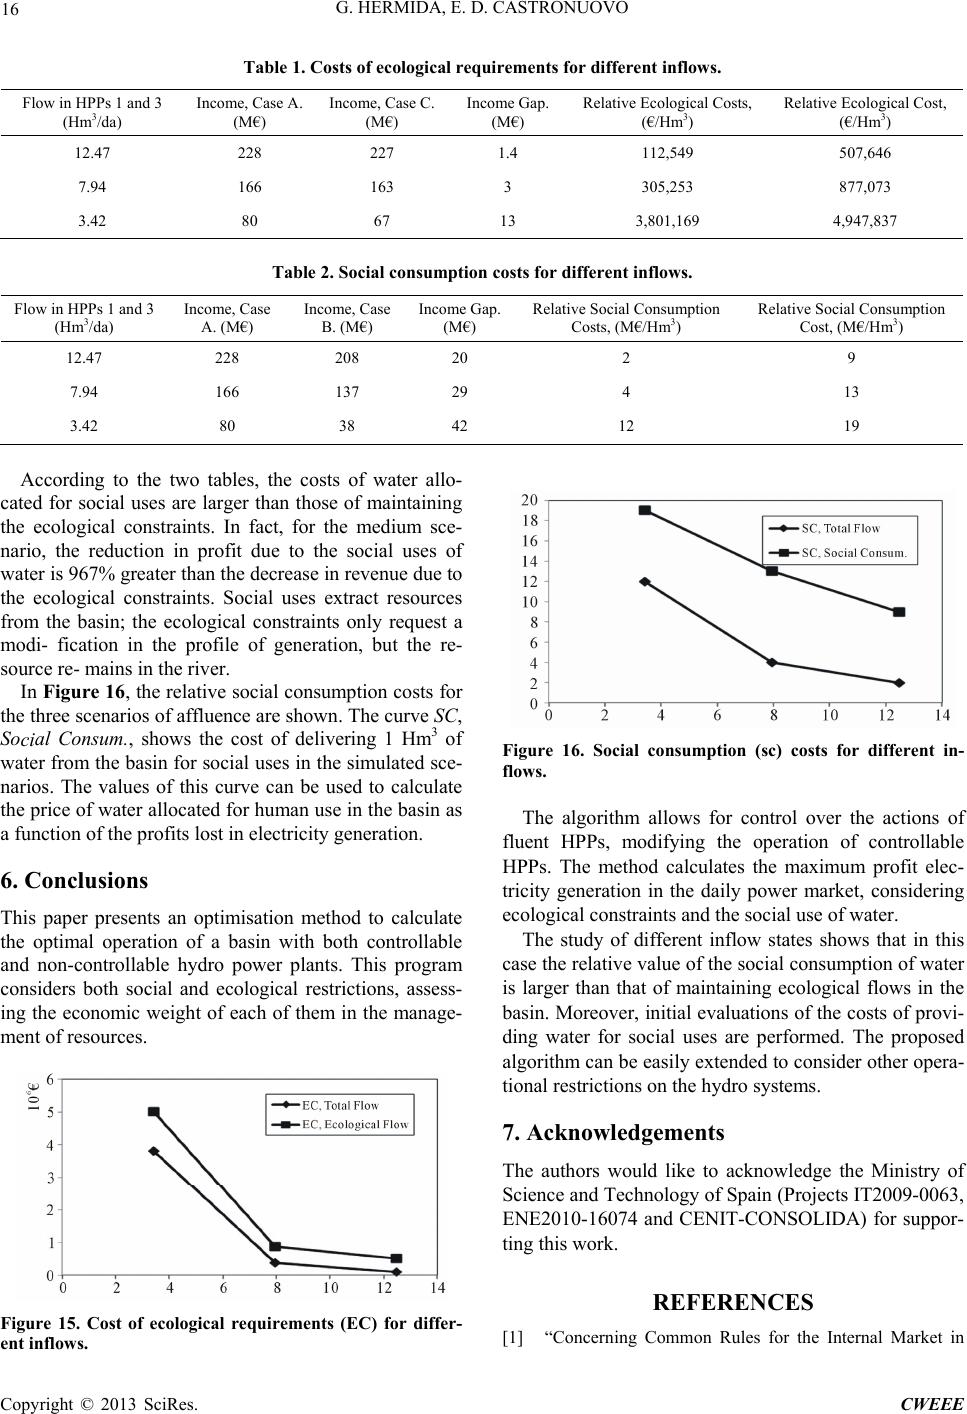 G. HERMIDA, E. D. CASTRONUOVO Copyright © 2013 SciRes. CWEEE 16 qui co ((€/Hm3) (€/Hm3) Table 1. Costs of ecological re Flow in HPPs 1 and 3 (Hm3/da) Income, Case A. (M€) Income, Case C. (M€) In rements for different inflows. me Gap. M€) Relative Ecological Costs, Relative Ecological Cost, 12.47 228 227 1.4 112,549 507,646 7.94 166 163 3.42 80 67 3 305,253 877,073 13 3,801,169 4,947,837 Table 2. Social consumptio Flow in HPPs 1 and 3 Income, Case Income, Case Income G n c (Hm3/da) A. (M ap. Relative Social Consumption Relative Social Consumption Cost, (M€/Hm3) osts for different inflows. €) B. (M€) (M€) Costs, (M€/Hm3) 12.47 228 208 20 2 9 7.94 166 137 29 4 3.38 42 12 13 42 80 19 Accordto the two tablthe costs of er allo- ated for social uses are larger than those of maintaining ological constraints. In fac nario, the reduction in profit due to the social uses of wr reae the ecconstrainl usesresourc from the basin; the ecological constraint request modi- fication in the proof generatbut the r source re- mains in the river. In Figure 16, the relativcial consumon costs f e three scenarios of affluence are shown. The curve SC, So ing es, wat c the ec t, for the medium sce- ater is 967% greate ological than the dec ts. Socia se in revenu extract due to es s only a file ion, e- e soptior th cial Consum., shows the cost of delivering 1 Hm3 of water from the basin for social uses in the simulated sce- narios. The values of this curve can be used to calculate the price of water allocated for human use in the basin as a function of the profits lost in electricity generation. 6. Conclusions This paper presents an optimisation method to calculate the Figure 16. Social consumption (sc) costs for different in- flows. The algorithm allows for control over the actions of fluent HPPs, modifying the operation of controllable HPPs. The method calculates the maximum profit elec- tricity generation in the daily power market, considering ecological constraints and the social use of water. The study of different inflow states shows that in this ver, initial evaluations of the costs of provi- g water for social uses are performed. The proposed algorithm can be easily extended to consider other opera- tional restrictions on the hydro systems. 7. Acknowledgements The authors would like to acknowledge the Ministry of Science and Technology of Spain (Projects IT2009-0063, ENE2010-16074 and CENIT-CONSOLIDA) for suppor- ting this work. ] “Concerning Common Rules for the Internal Market in optimal operation of a basin with both controllable and non-controllable hydro power plants. This program considers both social and ecological restrictions, assess- ing the economic weight of each of them in the manage- ment of resources. case the relative value of the social consumption of water is larger than that of maintaining ecological flows in the asin. Moreob din REFERENCES Figure 15. Cost of ecological ruirements (EC) for differ- ent inflows. eq [1  G. HERMIDA, E. D. CASTRONUOVO 17 Electricity and Repealing Directive 96/92/EC,” European Parliament and of the Council, 1996. http://www.cne.es/cne/doc/legislacion/Directiva96_92.pdf [2] “The Spanish Electric System 2010,” Red Eléctrica de España (REE), Madrid, 2011. [3] R. Sternberg, “Hydropower: Dimensions of Social and Environmental Coexistence,” Renewable Sustainable En- ergy Reviews, Vol. 12, No. 6, 2008, pp. 1588-1621. doi:10.1016/j.rser.2007.01.027 [4] M. Markoff and A. Cullen, “Impact of Climate Change on Pacific Northwest Hydropower,” Climate Change, Vol. 87, No. 3/4, 2008, pp. 451-469. doi:10.1007/s10584-007-9306-8 [5] I. P. Holman, D. Tascone son of Stochastic and Dete and T. M. Hess, “A Compari- rministic Downscaling Methods /s10040-009-0457-8 for Modeling Potential Groundwater Recharge under Cli- mate Change in East Anglia, UK: Implications for Ground- water Resource Management,” Hydrogeology Journal, Vol. 17, No. 7, 2009, pp. 1629-1641. doi:10.1007 [6] M. Marie, B. François, K. Stéphane and L. Robert, “Ada- ptation to Climgement of a Cana- dian Water-Re for Hydropower,” Optimal Operation ate Change in the Mana sources System Exploited Water Resources Management, Vol. 23, No. 14, 2009, pp. 2965-2986. [7] S. Soares and A. A. F. M. Carneiro, “ of Reservoirs for Electric Generation,” IEEE Transactions on Power Delivery, Vol. 6, No. 3, 1991, pp. 1101-1107. doi:10.1109/61.85854 [8] S. Granville, G. C. Oliveira, L. M. Thome, N. Campo- donico, M. L. Latorre, M. V. F. Pereira and L. A. Barroso, “Stochastic Optimization of Transmission Constrained and Large Scale Hydrothermal Systems in a Competi Framework,” Proceedings of th tive e Power Engineering So- Dynamic Programming Dispatch,” Energy Con- ciety General Meeting, 2003. [9] C. Cheng, S. Liao, Z. Tang and M. Zhao, “Comparison of Particle Swarm Optimization and for Large Scale Hydro Unit Load version and Management, Vol. 50, No. 12, 2009, pp. 3007- 3014. doi:10.1016/j.enconman.2009.07.020 [10] G. C. Oliveira, S. Binato and M. V. F. Pereira, “Value- Based Transmission Expansion Planning of Hydrothermal Systems under Uncertainty,” IEEE Transactions on Power Systems, Vol. 22, No. 4, 2007, pp. 1429-1435. 1doi:10.1109/TPWRS.2007.90716 [11] O. B. Fosso, A. Gjelsvik, A. Haugstad, B. Mo and I. Wangensteen, “Generation Scheduling in a Deregulated System. The Norwegian Case,” IEEE Transactions on Power Systems, Vol. 14, No. 1, 1999, pp. 75-81. doi:10.1109/59.744487 -30. [12] A. Kanudia and R. Loulou, “Robust Responses to Clima- te Change via Stochastic MARKAL: The Case of Qué- bec,” European Journal of Operational Research, Vol. 106, No. 1, 1998. pp. 15 doi:10.1016/S0377-2217(98)00356-7 [13] H. Habibollahzadeh and J. A. Bubenko, “Application of Decomposition Techniques to Short-Term Operation Plan- ning of Hydrothermal Power System,” IEEE Transactions on Power Systems, Vol. 1, No. 1, 1986, pp. 41-47. doi:10.1109/TPWRS.1986.4334842 [14] E. Castronuovo and J. A. P. Lopes, “Optimal Operation and Hydro Storage Sizing of a Wind-Hydro Power Plant,” International Journal of Electrical Power Energy Systems, Vol. 26, No. 10, 2004, pp. 771-778. doi:10.1016/j.ijepes.2004.08.002 [15] G. Zhao and M. Davison, “Optimal Control of Hydroe- lectric Facility Incorporating Pump Storage,” Renewable Energy, Vol. 34, No. 4, 2009, pp. 1064-1077. doi:10.1016/j.renene.2008.07.005 [16] H. M. I. Pousinho, V. M. F. Mendes and J. P. S. Catalão, “Scheduling of a Hydro Producer Considering Head-De- pendency, Price Scenarios and Risk-Aversion,” Energy Conversion and Management, Vol. 56, 2012, pp. 96-103. doi:10.1016/j.enconman.2011.11.020 D. N. Simopoulos, S. D.[17] Kavatza and C. D. Vournas, “An Enhanced Peak Shaving Method for Short Term Hydro- thermal Scheduling,” Energy Conversion and Management, Vol. 48, No. 11, 2007, pp. 3018-3024. doi:10.1016/j.enconman.2007.07.001 [18] A. L. Diniz and M. E. P. Maceira, “A Four-Dimensional Model of Hydro Generation for the Short-Term Hydro- thermal Dispatch Problem Considering Head and Spillage Effects,” IEEE Transactions on Power Systems, Vol. 23, No. 3, 2008, pp. 1298-1308. doi:10.1109/TPWRS.2008.922253 [19] Z. Shawwash, K. Thomas, K. Siu and S. O. D. Russell, “The BC Hydro Short Term Hydro Scheduling Optimiza- tion Model,” IEEE Transactions on Power Systems, Vol. 15, No. 3, 2000, pp. 1125-1131. doi:10.1109/59.871743 [20] J. I. Pérez-Díaz and J. R. Wilhelmi, “Assessment of the Economic Impact of Environmental Constraints on Short- Term Hydropower Plant Operation,” Energy Policy, Vol. 38, No. 12, 2010, pp. 7960-7970. doi:10.1016/j.enpol.2010.09.020 [21] J. I. Peréz-Díaz, R. Millán, D. García, I. Guisández and J. R. Wilhelmi, “Contribution of Regulation Reservoirs Con- sidering Pumping Capability to Environmentally Friendly Hydropower Operation,” Energy, Vol. 48, No. 1, 2011, pp. 144-152. [22] European Parliament and of the Council, “Establishing a Framework for Community Action in the Field of Water Policy,” Directive 2000/60/EC of the European Parlia- ment and of the Council, 2000. http://www.madrid.org/rlma_web/html/web/FichaNormat iva.icm?ID=296 [23] Government of Spain, Ministry of the Presidency, Royal Legislative Decree 1/2001, Water Act, 2001. http://www.boe.es/boe/dias/2001/07/24/pdfs/A26791-268 17.pdf [24] Consejeria de Medio Ambiente, Junta de Andalucia, Royal Decree Law 1/2001, 2011. http://www.juntadeandalucia.es/medioambiente/ [25] CNE, Comisión Nacional de Energía, Royal Decree Law 54/1997, Law of the Electric System. http://www.cne.es/cne/doc/legislacion/NE_LSE.pdf [26] Government of Spain, Ministry of the Presidency. Royal Decree 661/2007, Establishing the Regulation of the Ac- Copyright © 2013 SciRes. CWEEE  G. HERMIDA, E. D. CASTRONUOVO Copyright © 2013 SciRes. CWEEE 18 ion in the Special Re- , “Results of the Iberian Market,” 2011. , pp. 321-332. tivity of the Electric Power Product gime. http://www.cne.es tems [27] J. M. Y. Loyo, “The Electric Demand,” 2011. http://www.unizar.es/jmyusta/wp-content/uploads/2011/0 1/CONTRATACION-SUMINISTRO-ELECTRICO-Ener o-2011.pdf [28] OMEL-OMIL http://www.omel.es/inicio/mercados-y-productos/mercad o-electricidad/diario-e-intradiario/mercado-diario [29] J. Martínez-Crespo, J. Usola and J. L. Fernández, “Secu- rity-Constrained Optimal Generation Scheduling in Large- Scale Power Systems,” IEEE Transactions on Power Sys- , Vol. 21, No. 1, 2006 doi:10.1109/TPWRS.2005.860942 [30] MATLAB, “The Languages of Technical Computing,” Version 7.10.0.499, Math Works, 2010. [31] Government of Spain, Ministry of Environment, “Guadal- quivir’s Description,” 2011. http://www.chguadalquivir.es/opencms/portalchg/laDema rcacion/guadalquivir/breveDescripcion/ [32] Confederación Hidrográfica del Guadalquivir, “Ecological Flows,” 2011. http://www.chguadalquivir.es/opencms/portalchg/marcoL egal/planHidrologicoCuenca/  G. HERMIDA, E. D. CASTRONUOVO 19 Appendix Table 3. Hydro plants data. HPP Type Prev. HPP Tv [h] In Table 3, Prev. HPP is the number of the HPP up- stream to the current HPP (i.e., upstream HPP 4 there are the HPP’s 2 and 3). Table 4. Coefficients volume-height of the hydro plants. HPP k0 [m] k 1 [m−2] k 2 [m−5] k 3 [m−8] min 3 Hm CT i V max m i h 1 R - - 0.5 13 2 F 1 2 0.3 - 3 R - - 0.8 82 4 R 2, 3 6, 8 0.6 7 1 −3.58E + 014.94E + 00 −1.07E − 01 1.02E − 07 2 25 0 0 0 3 2.53E + 004.75E − 01 −6.85E − 04 1.03E − 07 4 9.63E − 013.71E − 01 −3.90E − 04 1.05E − 07 HPP max 3 Hm i V max 3 Hm T i V 3 ,1 Hm SP i V 3 ,Hm SP iT V 3 Hm U i V 1 23 0.513 1.3 1.3 20 2 19 0.206 0 0 11 3 347 0.839 0.8 0.8 - 4 13 0.850 0 0 10 HPP ηi max 3 Hm C i V min 3 Hm /h EC i V 1 0.3 0.7 0.0576 2 0.1 0.79 0 3 0.5 0.796 0.0576 4 0.4 0.7962 0 Copyright © 2013 SciRes. CWEEE  G. HERMIDA, E. D. CASTRONUOVO 20 Biographies Gloria Hermid), received her Bgree Inng from University of Lrhster degree in Electrical, Electronics and tomation Engineg (2011 UnersiCarlosde Mrid. Sheworking - sistant Prsor i the Deartment of Electrical Engi- neering of University Carlos III de Md. Her research interests includeoptim r resources and peration planning. Edgardo D.tronuovo received a B.S. degree () in Electrical Engineering from the National Uni- ve d performed Post-Doctorate 005) at INESC-Porto, Portugal. He worked at the Pow- er Portugal. Currently, Dr. Castronuovo is an Asso Prr ateparEngg, Unisity ine in optimization methods applied to power system prob- lemrenewabroductio storage a deregulation of the ctric soo- ior Member of IEEE. a was born in Coruña (1973 .S de a Co in uña (2007) and dustrial Engineeri er Ma Auerin) from ivty ofes III n ad p is as As adri the ization of wate o Cas 1995 rsity of La Plata, Argentina; both M.Sc. (1997) and Ph.D. (2001) degrees from the Federal University of Santa Catarina, Brazil, an (2 System areas of CEPEL, Brazil, and INESC-Porto, ciate ineerinofesso the Dtment of Electrical ver Carlos III of Madrid, Spain. His terests ar s, le pn,nd eleal energyystems. Prf. Castronuvo is Sen Copyright © 2013 SciRes. CWEEE
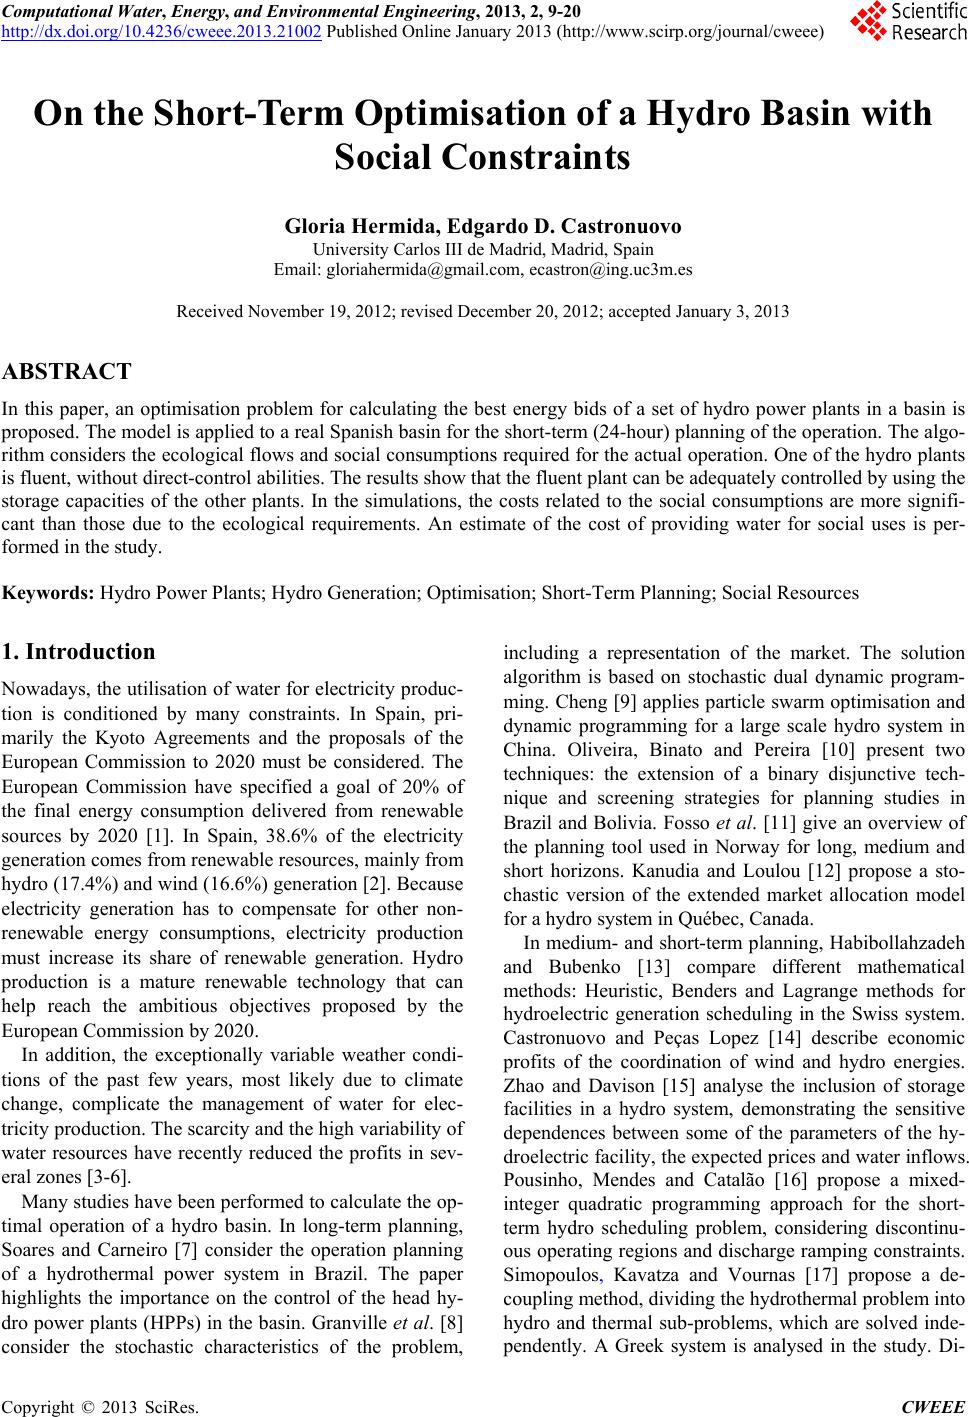
|