Paper Menu >>
Journal Menu >>
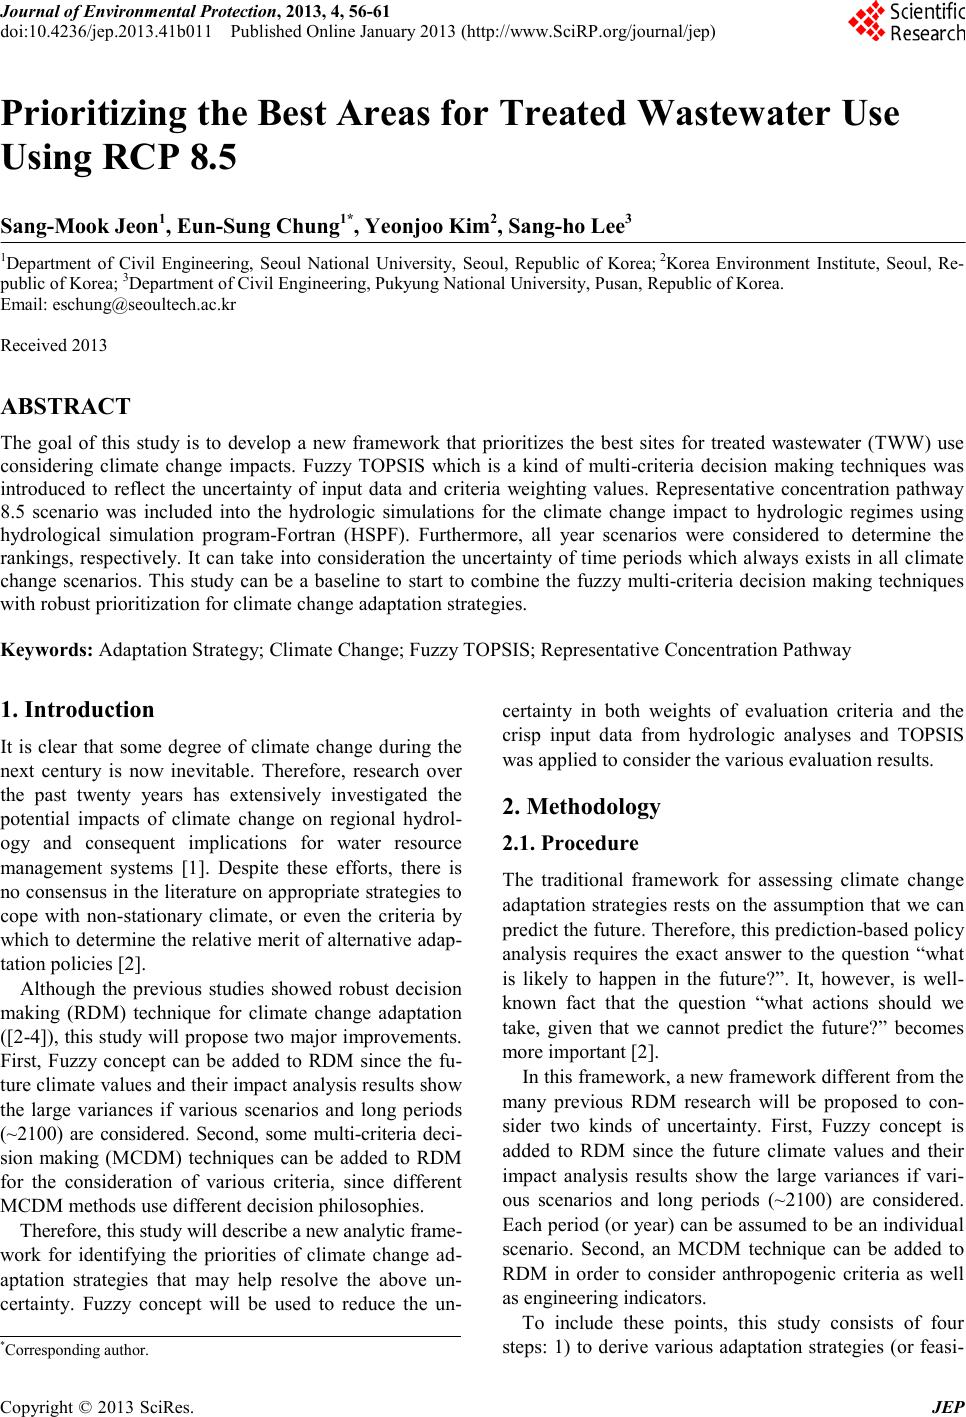 Journal of Environmental Protec tion, 2013, 4, 56-61 doi:10.4236/jep.2013.41b011 Published Online January 2013 (http://www.SciRP.org/journal/jep) Copyright © 2013 SciRes. JEP Prioritizin g t h e Best Areas for Treat ed Wastewater Use Using RCP 8.5 Sang-Mook Jeon1, Eun-Sung Chung1*, Yeonjoo Kim2, Sang-ho Lee3 1Department of Civil Engineering, Seoul National University, Seoul, Republic of Korea; 2Korea Environment Institute, Seoul, Re- public of Korea; 3Department of Civil Engineering, Pukyung National University, Pusan, Republic of Korea. Email: eschung@seoultech .ac.kr Received 2013 ABSTRACT The goal of this study is to develop a new framework that prioritizes the best sites for treated wastewater (TWW) use considering climate change impacts. Fuzzy TOPSIS which is a kind of multi-criteria decision making techniques was introduced to reflect the uncertainty of input data and criteria weighting values. Representative concentration pathway 8.5 scenario was included into the hydrologic simulations for the climate change impact to hydrologic regimes using hydrological simulation program-Fortran (HSPF). Furthermore, all year scenarios were considered to determine the rankings, respectively. It can take into consideration the uncertainty of time periods which always exists in all climate change scenarios. This study can be a baseline to start to combine the fuzzy multi-criteria decision making techniques with r obus t prioritiza tion for climate change ada ptation strat e gies. Keywords: Adaptation Strategy; Climate Change; Fuzzy TOPSIS; Representative Concentration Pathway 1. Introduction It is clear that some degree of climate change during the next century is now inevitable. Therefore, research over the past twenty years has extensively investigated the potential impacts of climate change on regional hydrol- ogy and consequent implications for water resource management systems [1]. Despite these efforts, there is no co nsensus in the literature on appropriate strategies to cope with non-stationary climate, or even the criteria by which to determine the relative merit of alternative adap- tation policies [ 2]. Although the previous studies showed robust decision making (RDM) technique for climate change adaptation ([2-4]), this study will propose two major improvements. First, Fuzzy concept can be added to RDM since the fu- ture climate val ues and the ir impac t anal ysis re sults sho w the large variances if various scenarios and long periods (~2100) are considered. Second, some multi-criteria deci- sion making (MCDM) techniques can be added to RDM for the consideration of various criteria, since different MCDM methods use different decision philosophies. Therefore, this study will describ e a ne w analytic fra me - work for identifying the priorities of climate change ad- aptation strategies that may help resolve the above un- certainty. Fuzzy concept will be used to reduce the un- certainty in both weights of evaluation criteria and the crisp input data from hydrologic analyses and TOPSIS was applied to consider the various eval uation resul ts. 2. Methodology 2.1. Procedure The traditional framework for assessing climate change adaptation strategies rests on the assumption that we can predict the future. Therefore, this prediction-based policy analysis requires the exact answer to the question “what is likely to happen in the future?”. It, however, is well- known fact that the question “what actions should we take, given that we cannot predict the future?” becomes more important [2]. In this fr a me wor k, a ne w fra m e wor k d if fer e nt fr o m t he many previous RDM research will be proposed to con- sider two kinds of uncertainty. First, Fuzzy concept is added to RDM since the future climate values and their impact analysis results show the large variances if vari- ous scenarios and long periods (~2100) are considered. Each period (or year) can be assumed to be an individual scenario. Second, an MCDM technique can be added to RDM in order to consider anthropogenic criteria as well as engineering indicators. To include these points, this study consists of four steps: 1) to derive various adaptation strategies (or feasi- *Corresponding author.  Prio r itizing the Best Areas for Treated Wastewater U se U s ing RCP 8.5 Copyright © 2013 SciRes. JEP 57 ble locatio ns for ada ptation str ategies; (2) to establish the evaluation criteria including environmental factors as well as anthropogenic issues (social and economic); 3) to derive the decision matrix using data collections and the hydrological analyses from hydrological simulation pro- gram-fortran (HSPF) model; and (4) to rank all adapta- tion strategies using Fuzzy multi-criteria approach. 2.2. Overview of RCP The representative concentration pathways (RCPs) were developed by four integrated assessment modeling teams (8.5, 6.5, 4.5 and 2.5) around the world and represent four potential different global emissions pathways that would lead to the widest possible range of radiative forcing by the end of this century [5]. More information about the RCPs and official data from the scenarios is available from IIASA. [5] summarizes global CO2 emis- sions and the resulting CO2 concentrations across the GCAM’s representation of the four RCPs provide an overview of the GCAM model. For the simple applica- tion, this study used RCP8.5 which assumed the highest CO2 emissions per year. RCP8.5W/m2 developed by the IIASA/MESSAGE modeling team in Austria [6]. This corresponds to a world where greenhouse gas emissions continue to rise resulting in atmospheric CO2 concentra- tion that exceeds 900 ppmv by 2100. 2.3. Fuzzy TOPSIS The TOPSIS method was developed to solve MCDM problem in which preference information is not articu- lated [7]. The technique is based on the concept that the ideal alternative has the best values for all attributes, whereas the negative ideal is the alternative with all of the worst attribute values. A TOPSIS solution is defined as the alternative that is simultaneously farthest from the negative ideal and closest to the ideal alternative. Ac- cording to [8], TOPSIS has four advantages: (1) a sound logic that represents rational human choices; (2) a scalar value that si multa neo usl y acc ount s for the bes t a nd wor st alternatives simultaneously; (3) a simple computation process that can be easily programmed; and (4) the per- formance measures for attributes can be visualized for all alternatives on a polyhedron for any two dimensions. Here the detailed procedure for the Fuzzy TOPSIS is presented as the procedure for the TOPSIS is the almost same exce pt fo r usi ng no F TN s . [9] proposed a multi-objective fuzzy pattern recogni- tion model to provide a global evaluation for every dis- trict with respect to all criteria. According to the maxi- mum principle of membership degree, one can select the desired alternative from n available districts. They de- fined the optimum membership degree of each district as: ( ) ( )() 2 22 * j j jj d dd µ − − =+ (1) where * j d and j d − are the synthetically weighted dis- tance of district j to the best and worst districts, respect- tively. To calculate the distances of district j A to the ideal (best) and anti-ideal (worst) districts, the fuzzy ideal weight dista nce is d e fined as f ollows: ( ) ( ) 1/ ** 1 , q mq ww jij i i ddr r = = ∑ (2) ( ) ( ) 1/ 1 , q mq ww jij i i ddr r −− = = ∑ (3) where w ij r is the weighted performance value of district j A with respect to criterion i C , a nd m is the nu mber of criteria. 3. Results and Discussions 3.1. Feasible Locations for TWW Use Give n the nece ssit y of TW W use and it s rapid ly gro wing significance, it has become necessary to establish a me- thodology for locating suitable sites for TWW use. However, no site selection problems have been applied to TWW use for instream flow. However, there is still a huge gap between the quantity of sewage generated and the available treatment capacity, and a decision support system is urgently needed to select appropriate locations and best-fit quantities within the supply [10]. TWW use has a critical disadva ntage i n t hat it lea ds to water q uality deterioration. Highly treated wastewater can be used in- stead, but requires a tremendous budget and most coun- tries cannot satisfy residents’ demand with such water. Thus, the trade-off between flow regime enrichment and water quality aggravation must be determined with cau- tion. We derived ten suitable sites, or alternatives, for TWW use in the Anyangcheon watershed by considering the streamflow quantity during the dry period and each sub-watershed area (Figure 1). To determine the appro- priate quantity of TWW use, each sub-watershed’s area was used. TWW quantity to maintain the environmental instreamflow requirement is closely related to the de- mand and supply of the study area. In this step, the ref- erence quantity, 22,000 m3/day in HU was used since it is already under operation. Therefore, the other quantities were calculated in proportion to the area of HU. The se- lected quantitie s for all alter natives are listed in Tab le 1. Also, BOD conc. for TWW use with a target BOD o f 4.7 mg/L was deter mined since it i s the hi ghly-treated efflux- ent standard of the Anyang wastewater treatment for in-  Prio r itizing the Best Areas for Treated Wastewater Use Usi ng RCP 8.5 Copyright © 2013 SciRes. JEP 58 stream flow. 3.2. Establishing Criteria Based on the concept of the sustainable development, all criteria used to quantify the model’s effectiveness were determined by expert researchers and local governmental officials because the process required discussion and refinement. The structure of the selected criteria is shown in Table 2. Population and population density were cho- sen as influencing both water quantity and quality be- cause these criteria lead to relevant environmental pres- sures. Urban area ratio, streamflow seepage, watershed slope, and groundwater withdrawal were the pressures assumed for water quantity, while untreated wastewater intrusion, and ratio of covered stream interval were the pressures assumed for water quality. These pressures affect the ratio of low flow to hydrological i nstrea m flow for water quantity and the ratio of BOD ave. conc. to the target concentration for water quality. This study selected transformation ratios based on low flow and BOD conc. due to adaptation strategy because responses to these indicators can lead to remedial measures and planning actions. Fig. 1. Map of study area. Table 1. List of TWW use quantity for each sub-wa- tershed. tlA aerA (km2) ytitnauQ (m3/d) tlA aerA (km2) ytitnauQ (m3/d) GW 3.78 2000 AS 8.07 4000 JO 4.26 3000 MS 5.39 3000 JD 5.33 3000 SS 13.18 7000 BS 10.30 5000 BS1 4.59 3000 UH 44.55 21000 RD 41.61 20000 Table 2. Weighting values of eleven evalu atio n cr iteria. Crit eria Weights Population 0.03 Populatio n density 0.13 Urban area rat io 0.04 Streamflow seepage 0.02 Ground water withdrawal 0.03 Untreated wastewater intrusion 0.04 Rati o of covered stream in terval 0.03 Rati o of low f low to hydrol ogic i nstrea m flow 0.09 Ratio of increased low flow to hydrological instreamflow 0.22 Rati o of BOD average concentrati on to target quality 0.10 Ratio of decreased BOD average con cen tration to target quality 0.25 All criteria had their internal impacts reclassified to a common scale, making it necessary to determine each criterion’s relative impact in prioritizing best sites for TWW use. Weights were assigned to the criteria to indi- cate their relative importance, and different weights di- rectly influenced the DM results for best sites selection with TWW use. Consequently, it wa s necessary to de- termine the rationalit y and veracit y of the criteria weights. We used two methods to determine the weights of all the criteria, individual interviews with 31 experts and the fuzzy concept. The respondent group consisted of local governmental officials and researchers working in river management, and the T FN s o f the we i g h ti ng val ues were derived using the survey r esul ts f rom the 31 respondents. 3.3. Evaluation of Alternatives Using HSPF model which has already verified in [11], ten simulated results for water quantity and quality were averaged and the results with and without each alterna- tive were compared. To quantify the effectiveness, the performance measure “effectiveness” was used ([4,11- 13]). In this study, it was applied to low flow and BOD concentrations. They can be calculated using the follow- ing equation: '() () () () x ixi fi xi − = (4) where f is effectiveness of alternative i, ()xi is the origi- nal value without adaptation strategy and '( ) xi is the transformed value. The calculated effectiveness is shown in Table 3. As expected, the criteria related to water quantity improved, and low flows increased in all cases. However, the crite- ria related to water quality (i.e., BOD conc.) worsened even with TWW use (BOD conc. of 4.7 mg/L). TWW BOD conc. was much highe r t han t hose in nat ura l str ea m flows, indicating TWW use had harmful effects on water quality in the urban watershed. In addition, In addition, comparing with the results of historical climate data, the positive effectiveness to lo w f low increases except WG if  Prio r itizing the Best Areas for Treated Wastewater U se U s ing RCP 8.5 Copyright © 2013 SciRes. JEP 59 climate change happens while the negative decreases. That is, complicate mixing effects can happen when cli- mate change impact is considered for water resources planning and management. Therefore, given the positive and negative effects of TWW use on the urban watershed water cycle, a best location selection must be approached with caution when TWW uses are considered due to the risk of compromised quantit y. Furthermore, the effectiveness of the alternatives to water quantity and quality varied significantly by year. Therefore, the low flows with adaptation strategies are derived as shown in Table 4 using 90-year climate data (2010-2099) from RCP8.5. As a result, the effectiveness of TWW use varied every year dramatically because the predicted climate conditions from selected general circu- lation models and climate change scenarios varies unex- pectedly. This inter-annual variability in the simulated criteria suggested that the average data over multiple years could not adequately represent the simulation re- sults, necessitati ng technique s that would b etter rep resent such variability. Therefore, the TFN concept can be adopted to derive the performance values of all the alter- natives. Table 3. Effectiveness ratios to water quantity and quality by three time scen ari os and his torical series. woL Flow 2010-2039 2040-2069 2070-2099 Historical WG 259% 250% 258% 289% OJ 68% 60% 67% 51% DJ 74% 64% 74% 66% SB 62% 52% 61% 49% HU 55% 48% 55% 44% SA 54% 46% 54% 42% SM 39% 32% 38% 31% SS 125% 114% 125% 93% SB1 131% 124% 137% 105% DR 90% 80% 90% 71% BOD Conc . 2010-2039 2040-2069 2070-2099 Historical WG -23% -21% -23% -30% OJ -79% -75% -73% -53% DJ -42% -39% -38% -31% SB -52% -48% -47% -35% HU -48% -40% -45% -33% SA -72% -67% -65% -49% SM -96% -91% -89% -65% SS -148% -136% -134% -98% SB1 -58% -69% -60% -41% DR -64% -61% -60% -44% 3.4. Fuzzy Multi-criter ia A pproac h Thi s study use d an MCD M tec hnique to de rive a r anking of all feasible alternatives. For the sustainability, it is a general fact that various criteria should be considered. Thus, this study compared the traditional decision mak- ing results with those of TOPSIS as shown in Figure 2. The traditional method generally includes just engineer- ing criteria such as low flow and BOD conc. while MCDM considers anthropogenic criteria such as popula- tion, population density, urban area ratio and so on. As a result, some watersheds such as WG, DJ, SB and SS showed large differences. Therefore, social factors should be include to select the effective adaptation strat- egies for climate change. Based on the section 3.3, this study adopted triangular fuzzy number (TFN) to reflect the variations of low flows and BOC conc according to all years of RCP8.5. The performance values of low flow and BOD conc. wer e normalized to apply Fuzzy TOPSIS. Meanwhile, performance values for basic components were assumed to be fuzzy because their distributions were not derived, and we set the upper 10% and lower 10% of the average results as the upper and lower limits of the TFNs. Table 4. Simulated ave. and key percentile low flows from RCP8.5. Low Flow Ave . Low flow Percent ile va l ues of low flow 10% 50% 90% WG 0.0003 0 .0000 0.0000 0.0000 OJ 0.0849 0.0991 0.0850 0.0680 DJ 0.0834 0.0991 0.0821 0.0651 SB 0.1551 0 .1841 0.1543 0.1218 HU 0.6935 0.8297 0.6966 0.5465 SA 0.1355 0.1642 0.1359 0.1048 SM 0.1215 0.1472 0.1218 0.0934 SS 0.1466 0.1642 0.1472 0.1246 SB1 0.0608 0.0736 0.0595 0.0510 DR 0.4918 0.5692 0.4927 0.4021 Figure 2. Comparison of rankings considering between vari- ous and e ngineering crit eria.  Prio r itizing the Best Areas for Treated Wastewater Use Usi ng RCP 8.5 Copyright © 2013 SciRes. JEP 60 The fuzzy ideal weight distances of the alternative Aj values to the ideal (best) and anti-ideal (worst) points were calculated using Eqs. 2 and 3. The separation be- tween the FPIS and FNIS. These results and Eq. 1 were used to calculate the optimum membership degree of each alternative to water quantity and quality, respec- tively. Ave. rankings of every 10-year result are listed i n Figure 3. As a result, four alternatives such as OJ, SM, HU, and DJ showed different rankings accor ding to the time scenarios. That is, to derive water resources plan, various time scenarios and climate change model should be considered for the robust prioritization. To check the efficiency of fuzzy concept, TOPSIS was applied to the same procedure. The results are shown in Figure 4. Comparing with Figure 3, the ranking varia- tions are more severe. It can be concluded that Fuzzy TOP SIS show mo re rob ust rankin g than T OPSIS si nce it consider the uncertainty of all data. 4. Conclusions This study developed a multi-criteria approach with fuzzy set theory to the problem of location selection for TWW use in a Korean urban watershed. Fuzzy TOPSIS was introduced to prioritize the best sites. Criteria in- volving social and environmental components were also Figure 3. R anking time series using Fuzzy TOPSIS. Figure 4. Ranking time series using TOPS IS. selected. T he following conclusions were made based on the results of the s tudy. 1) MCDM method can be used to include various evaluation criteria for sustainable development. Criteria were considered based on an integrated framework in- cluding social and environmental components, and their weighting values were objectively derived using indi- vidual int ervie ws. 2) Fuzzy TOPSIS can be used to derive the robust pri- oritization of adaptation strategies for climate change since it can reflect the uncertainty of input data and crite- ria wei gh tin g va lues. This study can be a baseline to start to combine the fuzzy MCDM techniques with robust prioritization for climate change adaptation strategies 5. Acknowledgements Thi s re se ar ch was s upp o r ted by a grant ( 1 1 -TI-C06) from Construction Technology Innovation Program funded by Ministry of Land, Transport and Maritime Affairs of Korean government. REFERENCES [1] B. Nijssen, G.M. O’Donnell, A.F. Hamlet and D.P. Lettenmaier, “Hydrologic sensitivity of global rivers to climate change,” Climatic Change, Vol. 50, No. 1, 2001, pp. 143-175. [2] R.J. Lempert, M.E. Schlesinger, “Robust strategies for abatin g climat e chan ge,” Climatic Change, Vol. 45, No. 3, 2000, pp . 387-401. [3] S. Dessai, X. Lu, J.S. Risbey, “On the role of climate scenarios for adaptation planning.” Global Environmental Change, Vol. 15, 2 00 5, pp. 87-97. [4] J.S. Yang, E.S. Chung, S.U. Kim, T.W. Kim, “Prioritization of water management under climate change and urbanization using multi-criteria decision making methods.” Hydrology and Earth System Sciences, Vol. 16, 20 12, pp. 80 1-814. [5] J.J. Dooley, and K.V. Calvin, “Temporal and spatial deployment of Carbon Dioxide capture and storage technologies across the Representative Concentration Pathways.” Energy Procedia, Vol. 4, 2011, pp. 5845- 5852. [6] K. Riahi, A. Gruebler, N. Nakicenovic, “Scenarios of long-term socio-economic and environmental development under climate stabilization”, Technological Forecasting and Social Change, Vol. 74, 2007, pp. 887-935. [7] C.L. Hwang, K. Yoon, “Multiple Attributes Decision Making Methods and Applications,” Springer, Hei del ber g, 1981. [8] H.S. Shih, H.J. Shyur, E.S. Lee, “An extension of TOP- SIS for grou p decision makin g,” Mathematical Computer Modeling, Vol . 45, 2007, pp. 801-813. [9] H.C. Zh o u, G.L. Wang, and Q. Yang, “A multi-objective  Prio r itizing the Best Areas for Treated Wastewater U se U s ing RCP 8.5 Copyright © 2013 SciRes. JEP 61 fuzzy pattern recognition model for assessing ground- water vulnerability based on the DRASTIC system,” Hydrological Science Journal, Vol. 44, 1999, pp. 611-618. [10] J. Ganoulis, “Evaluating alternative strategies for waste- water recycling and reuse in the Mediterranean area,” Water Science and Technology: Water Supply, Vol. 3, 2003, pp . 11-19. [11] E.S. Chung, K.S. Lee, “Prioritization of water manage- ment for sustainability using hydrologic simulation model and multi-criteria decision making techniques,” Journal of Environmental Management, Vol. 91, 2009, pp. 1502-1511. [12] E.S. Chung, W.P. Hong, K.S. Lee, S.J. Burian, “Inte- grated use of a continuous simulation model and mul- ti-attribute decision making for ranking urban watershed managemen t alternatives.” W ater Res ources management, Vol. 25, pp. 641-658. [13] Y. Kim, E.S. Chung, “Integ rated assessment of climate change and urbanization impact on adaptation strategies: A case study in two small Korean watersheds.” Climatic Change, DOI 10. 10 07/ s1058 4-012-0612-4. |