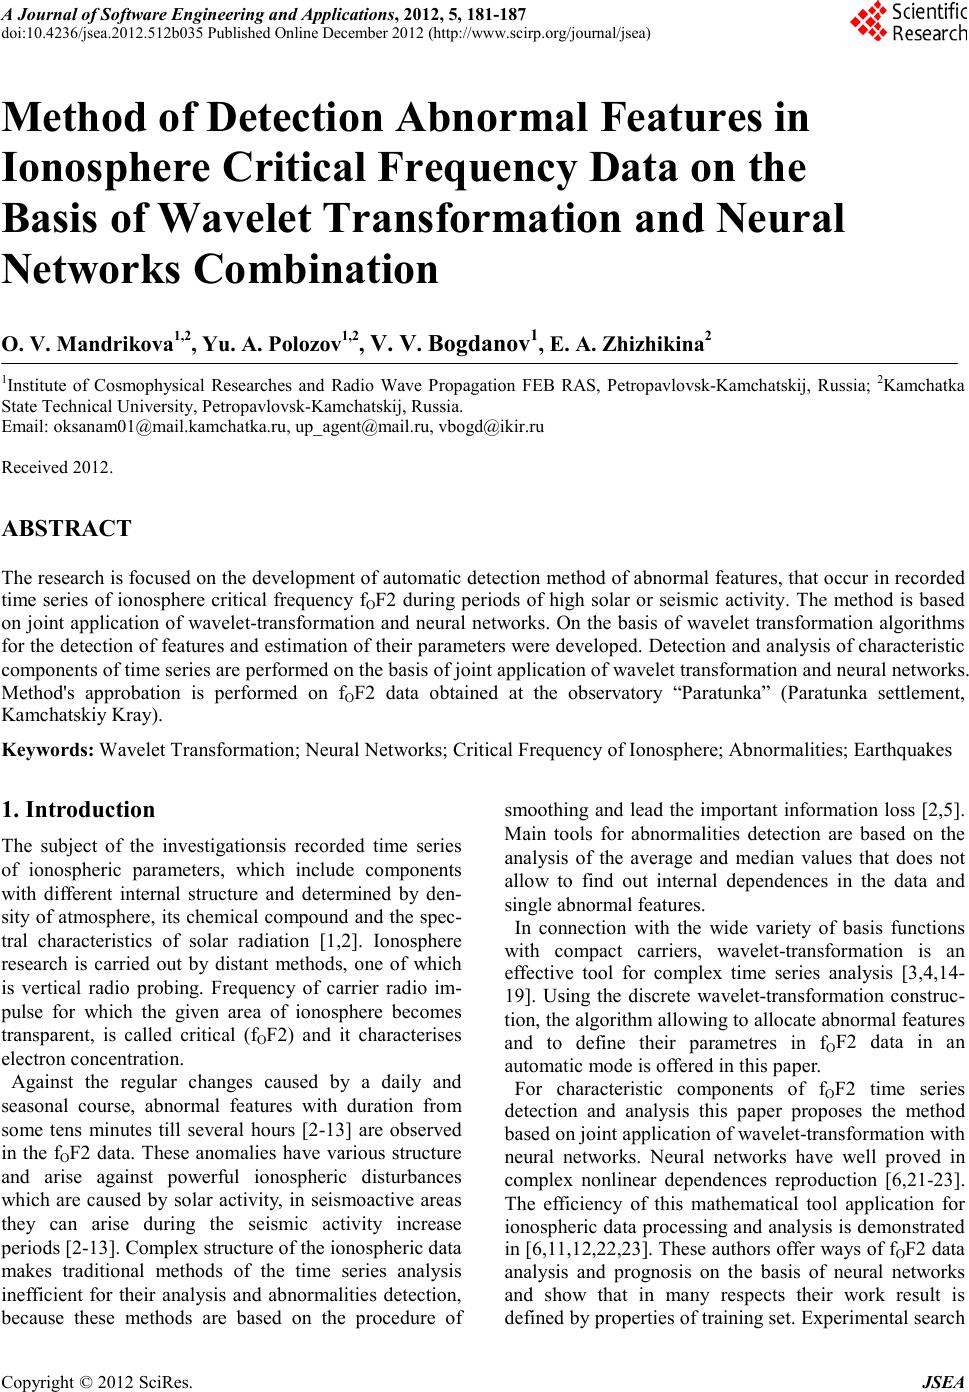
 A Journal of Software Engineering and Applications, 2012, 5, 181-187 doi:10.4236/jsea.2012.512b035 Published Online December 2012 (http://www.scirp.org/journal/jsea) Copyright © 2012 SciRes. JSEA Method of Detection Ab normal Features in Ionosp here Critica l Frequency Data o n the Basis of Wavelet Transformation and Neural Networks Combin ation O. V. Mandrikova1,2, Yu. A. Polozov1,2, V. V. Bogdanov1, E. A. Zhizhiki na2 1Institute of Cosmophysical Researches and Radio Wave Propagation FEB RAS, Petropavlovsk-Kamchatskij, Russia; 2Kamchatka State Technical Univer sity, Petropavlovsk-Kamchatskij, Russia. Email: oksanam01@mail.kamchatka.ru, up_agent@mail.ru, vbogd@ikir.ru Received 2012. ABSTRACT The research is focused on the development o f automatic detection method of abnor mal features, that occur in recorded time series of ionosphere critical frequency fOF2 during periods of high solar or seismic activity. The method is based on joint application of wavelet-transformation and neural networks. On the basis of wavelet transformation algorithms for the detection of features and estimation of their parameters were developed. Detection and analysis of characteristic components of time series are performed on the basis of joint application of wavelet transformation and neural networks. Method's approbation is performed on fOF2 data obtained at the observatory “Paratunka” (Paratunka settlement, Ka mchatskiy Kray). Keywords: Wavelet Transformation; Neural Networks; Critical Frequency of Ionosphere; Ab no rmalities; Earthquakes 1. Introduction The subject of the investigationsis recorded time series of ionospheric parameters, which include components with different internal structure and determined by den- sity of at mo sphere, its chemical compound and the sp ec- tral characteristics of solar radiation [1,2]. Ionosphere research is carried out by distant methods, one of which is vertical radio probing. Frequency of carrier radio im- pulse for which the given area of ionosphere becomes transparent, is called critical (fOF2) and it characterises electron concentration. Against the regular changes caused by a daily and seasonal course, abnormal features with duration from some tens minutes till several hours [2-13] are observed in the fOF2 data. These anomalies have various structure and arise against powerful ionospheric disturbances which are caused by solar activity, in seismoactive areas they can arise during the seismic activity increase periods [2-13]. Complex structure of the ionospheric data makes traditional methods of the time series analysis inefficient for their analysis and abnormalities detection, because these methods are based on the procedure of smoothing and lead the important information loss [2,5]. Main tools for abnormalities detection are based on the analysis of the average and median values that does not allow to find out internal dependences in the data and single abnormal features. In connection with the wide variety of basis functions with compact carriers, wavele t-transformation is an effective tool for complex time series analysis [3,4,14- 19]. Using the discrete wavelet-transformation construc- tion, the algorithm allo wing to allo cate abnor mal feature s and to define their parametres in fOF2 data in an automatic mode is offered in this paper. For characteristic components of fOF2 time series detection and analysis this paper proposes the method based on joint application of wavelet-transfor mation with neural networks. Neural networks have well proved in complex nonlinear dependences reproduction [6,21-23]. The efficiency of this mathematical tool application for ionospheric d ata processing and analysis is demonstrated in [6,11,12,22,23]. These authors offer ways o f fOF2 data analysis and prognosis on the basis of neural networks and show that in many respects their work result is defined b y properties of training set. Experimental search 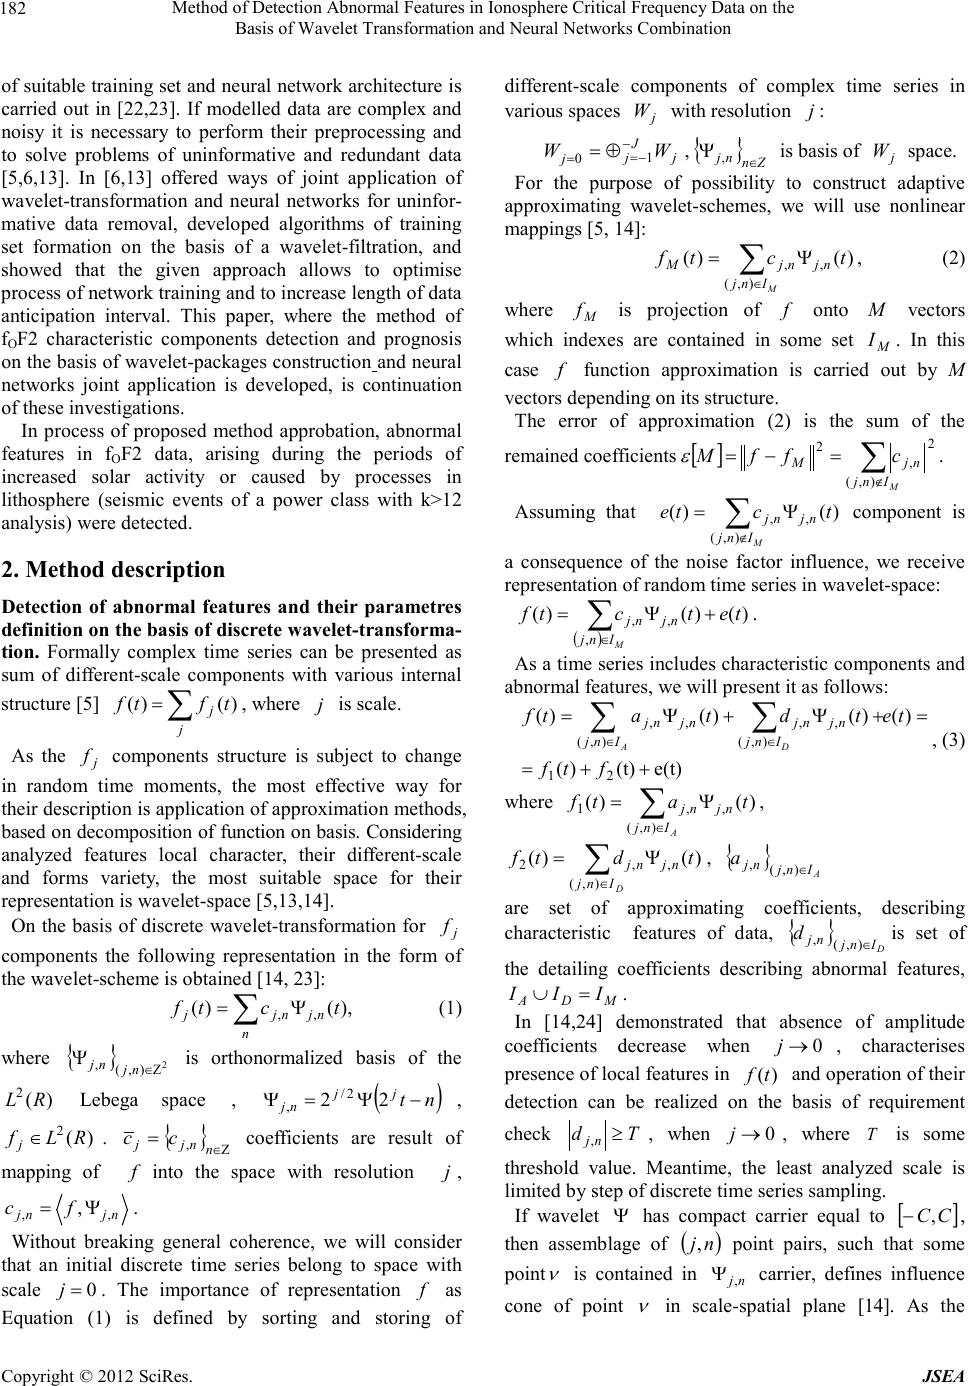 Method of Detection Abnormal Features in Ionosphere Critical Frequency Data on the Basis of Wavelet Trans fo rmation and Neural Networks Combination Copyright © 2012 SciRes. JSEA 182 of suitable training set and neural network architecture is carried out in [22,23 ]. If modelled data are complex and noisy it is necessary to perform their preprocessing and to solve problems of uninformative and redundant data [5,6,13]. In [6,13] offered ways of joint application of wavelet-transformation and neural networks for uninfor- mative data removal, developed algorithms of training set formation on the basis of a wavelet-filtration, and showed that the given approach allows to optimise process of network training and to increase length of data anticipation interval. This paper, where the method of fOF2 characteristic components detection and prognosis on the basis of wavelet-packages constructio n and neura l networks joint application is developed, is continuation of these investigations. In process of proposed method approbation, abnormal features in fOF2 data, arising during the periods of increased solar activity or caused by processes in lithosphere (seismic events of a power class with k>12 analysis) were detected. 2. Method description Detection of abnormal features and their parametres definitio n on t he basis o f discrete wavelet-transforma- tion. Formally complex time series can be presented as sum of different-scale components with various internal structure [5] , where is scale. As the components structure is subject to change in random time moments, the most effective way for their description is application of approximation methods, based on deco mposition of function on basis. Considering analyzed features local character, their different-scale and forms variety, the most suitable space for their representation is wavelet-space [5,13,14]. On the basis of discrete wavelet-transformation for components the following representation in the form of the wavelet-scheme is obtained [14, 23]: Ψ= n njnjj tctf ),()( ,, (1) where is orthonormalized basis of the Lebega space, , . coefficients are result of mapping of into the space with resolution , njnj fc,, ,Ψ= . Without breaking general coherence, we will consider that an initial discrete time series belong to space with scale . The importance of representation f as Equation (1) is defined by sorting and storing of different-scale components of complex time series in various spaces with resolution : , is basis of space. For the purpose of possibility to construct adaptive approximating wavelet-schemes, we will use nonlinear mappings [5, 14]: )()( , ),( ,tсtf nj Inj njM M Ψ= ∑ ∈ , (2) where is projection of f onto vectors which indexes are contained in some set M I. In this case f function approximation is carried out by M vectors depend ing on it s structure. The error of approximation (2) is the sum of the remained coefficients [ ] 2 ),( , 2∑ ∉ =−= M Inj njM cffM ε . Assuming that )()( , ),( , tcte nj Inj nj M Ψ= ∑ ∉ component is a consequence of the noise factor influence, we receive representation of random time series in wavelet-space: ( ) ∑ ∈ +Ψ= M Inj njnj tetctf , ,, )()()( . As a time series includes characteristic components and abnormal features, we will present it as follows: e(t)(t))( )()()()( 21 ),( ), ( ,,,, ++= =+Ψ+Ψ= ∑∑ ∈ ∈ ftf tet dtatf A D Inj Inj njnjnjnj , (3) where ∑ ∈ Ψ= A Inj njnj tatf ),( ,,1 )()( , ∈ Ψ= D Inj njnj tdtf ),( ,,2 )()( , are set of approximating coefficients, describing characteristic features of data, is set of the detailing coefficients describing abnormal features, MDA III =∪ . In [14,24] demonstrated that absence of amplitude coefficients decrease when , characterises presence of local features in and operation of their detection can be realized on the basis of requirement check , when , where is some threshold value. Meantime, the least analyzed scale is limited by step of discrete tim e series sampling. If wavelet has compact carrier equal to , then assemblage of nj, point pairs, such that some point is contained in carrier, defines influence cone of point in scale-spatial plane [14]. As the  Method of Detection Abnormal Features in Ionosphere Critical Frequency Data on the Basis of Wavelet Transformation and Neural Networks Combination Copyright © 2012 SciRes. JSEA carrier on the scale is equal to , then influence cone of point on the scale is defined by inequality: . Let's consider that function in the neighbourhood of some point has abnormal feature of scale , if in the neighbourhood of the point with the sizes de fined by an influence c one, the conditio n is sa tisfied: jnj Td≥ ,, (4) where is threshold value on scale , time duration of abnormality is defined by the influence cone of point . Operation of scale abnormal features detection can be realized on the basis of threshold functions applicatio n . ,0 , )( < ≥ = j j T Txесли Txеслиx xP j The sets of detailing components allocated in such a way define the component )( 2tf of model Equation (3). Intensity of abnormality on scale in point neighborhood we will define as , where . Changes of intensity in time can be analyzed on the basi s of value . (5) The construction of wavelet-packages [14, 24] assumes recursive splitting of space : . Space admits orthonormalized basis ( ) { } Zk j p j j kt i i i i ∈ −Ψ22 2/ . Integration of corresponding basises of wavelet-packages ( ) { } IiZk j p j j kt i i i i ≤≤∈ −Ψ 1, 2/ 22 defines orthonormalized basis , that allows to restore function completely. Detection and analysis of characteristic components of time series on the basis of wavelet-packages and neural net works joint applicat ion. The Neural network creates m ap p ing . The set of weight coefficients of neuron input connections represents a column-vector [21] , where is length o f network input vector. If is a real network output, and is a desired one, then is an unknown function, and а is its approximation which is reproduced by neural network. Procedure of network training is reduced to minimisation of approximation mean-square error on parameter . Giving to the inp ut of the t raine d neura l net work val ues of function f from an interval , network becomes capable to compute anticipated function values on time interval , where is a current discrete moment of time; is length of anticipation interval. The decision error is defined as difference between desired and real output values during the discrete time moment . The error vector is the vector where element is , (6) where is a current time moment, is a current position on antic ipation interva l. Algorithm of training and control sets formation: 1. An initial data array , where is a sampling length, is divided on blocks : ( ){}(){}( ){}( ){} ( ) KQKk Q k Q k K kkfkfkfkf −= + === =,...,, 1 211 long. 2. On the basis of wavelet-packages construction, for each block we have representation in the form of a linear combination different -scale components: , where every component i i i i i p si i i i p j p j Ikj p j skj s iWf ∈ΨΨ= ∑ ∈ , ),( , β in wavelet-space is uniquely defined by coefficients sequence { } i p s i i i Ikj skj s j∈ = ),( , ββ , , are wavelet-package spaces. 3. Every detected component defines a subspace of time series features space. As i p j W are wavelet-packages spaces, then is obtained: , . Thus, for each unit separation of data features in space is received Figure 1. Using the following sets of detected features ____ 11 ,1 ,Ls spj f=; ;…; ;...; ; { } ____ 2111 ,1 ,, , Ls spj spj ff = ;…; { } ____ 21 ,1 ,, , Ls spj spj IIff = ;  Method of Detection Abnormal Features in Ionosphere Critical Frequency Data on the Basis of Wavelet Trans fo rmation and Neural Networks Combination Copyright © 2012 SciRes. JSEA 184 { } ____ 312111 ,1 ,,, ,, Ls spj spj spjfff = ;… { } ____ 12111 ,1 ,,, ,...,, Ls spj spj spj I fff = ;…; ____ 21 ,1 ,,, ,...,, Ls spj spj spjIIIIfff =we form training and control sets for neural networks. Figure 1. The scheme of data separation in wavelet-images space. Algorithm of “the best" network construction: Step 1: Carry out wavelet-restoration of a component for each data unit and fo rm tr aining se t on the basis of combinations of the restored data from various units. Construct network 1 of variable structure [21] (variable structure network is a multilayer feed forward network, which architecture is defined by minimisation of decision error on training vectors set), tr a in and te st it. Step 2: Carry out wavelet-restoration of components for each data unit and fo r m t ra inin g se t o n t he basis of combinations of the restored data from various units. Construct a network 2 of variable structure, train and test it. Etc. Step r: Carry out wavelet-restoration of components spj spj spj IIII fff ,,, ,...,, 21 for each data unit and form training set on the basis of combinations of the restored data from various units. Construct network r of variable structure, tra in and test it. On the basis of the analysis of results of received neural networks operation the “best” network is defined: "the best" is considered to be the network having the least decision error on te st s et ( ) ∑∑ Μ = = ΜΜ = 1 1 2 min,) 1 (min l f i ilE ε α , (7) where is a neural network number, , is a length of analyzed network output vector, is a length of an anticipation inter val. The training data set is a set of observations containing features of studied process. On the basis of wavelet- packages construction, we have data features separation in space. During training and designing each network learns a subset of input data features and approximates them. " The best" networ k is t he net work ha ving t he lea st decision error on test set. Therefore data subset used at training of the "best" network will contain the most typical features of studied process. In wavelet-space this subset is represented by set of coefficients , defining component of time series model Equa tio n (3). If there is an abnormal feature in the data, then a change of their structure occurs. Therefore operation of abnormal features detection on the basis of a neural network can be c onstructe d b y processing and analysis of decision errors i ε : if ( ) Ρ≥= ∑∑ = = Z l f i iZ l Z E 1 1 2 1 ε , (8) where is an observation frame length, is a beforehand specified threshold value, then within an analyzed time frame we have abnormality. 3. Results of experiments In experiments fOF2 data were used, received by automatic ionospheric station located in Paratunka settlement, Kamchatka peninsula. Data recording occurs once an hour. For experiments results of fOF2 measurements dated 1979 - 2011 were taken. In the process of analysis, data of the Earth magnetic field (H-component) were used to define magnetospheric disturbances degree, characterising Solar activity. As basic functions the class of Daubechies orthogonal wavelets: db2, db3, db4 was used. Following the results obtained in [3], for detection of abnormalities on the basis of operation Equation (4) were used the threshold values defined in the process of algorithm ope ration by formula: ( ) jnj Vnn j StdmedT * , ,1, _____ θ += = , where ( ) ∑ = − − = V n nj njj dd V St 1 2 , , 1 1 , nj d, is the average value defined within the analyzed sliding time frame of length , readouts, is a median defined within the analyzed sliding time frame of length . The coefficient 3 has been defined statistically. The detected time-and-frequency intervals containing abnormal features, are shown on Figure 2-5 (b) by shades of grey colour. Ionospheric disturbances intensity changes in time were analyzed on the basis of value Equation (5), Fig ure 2 -5 (c). On the bas is o f desc rib ed above algor it hms tr ai ning a nd control sets for neural networks have been generated and "the best" network consisting of three layers that 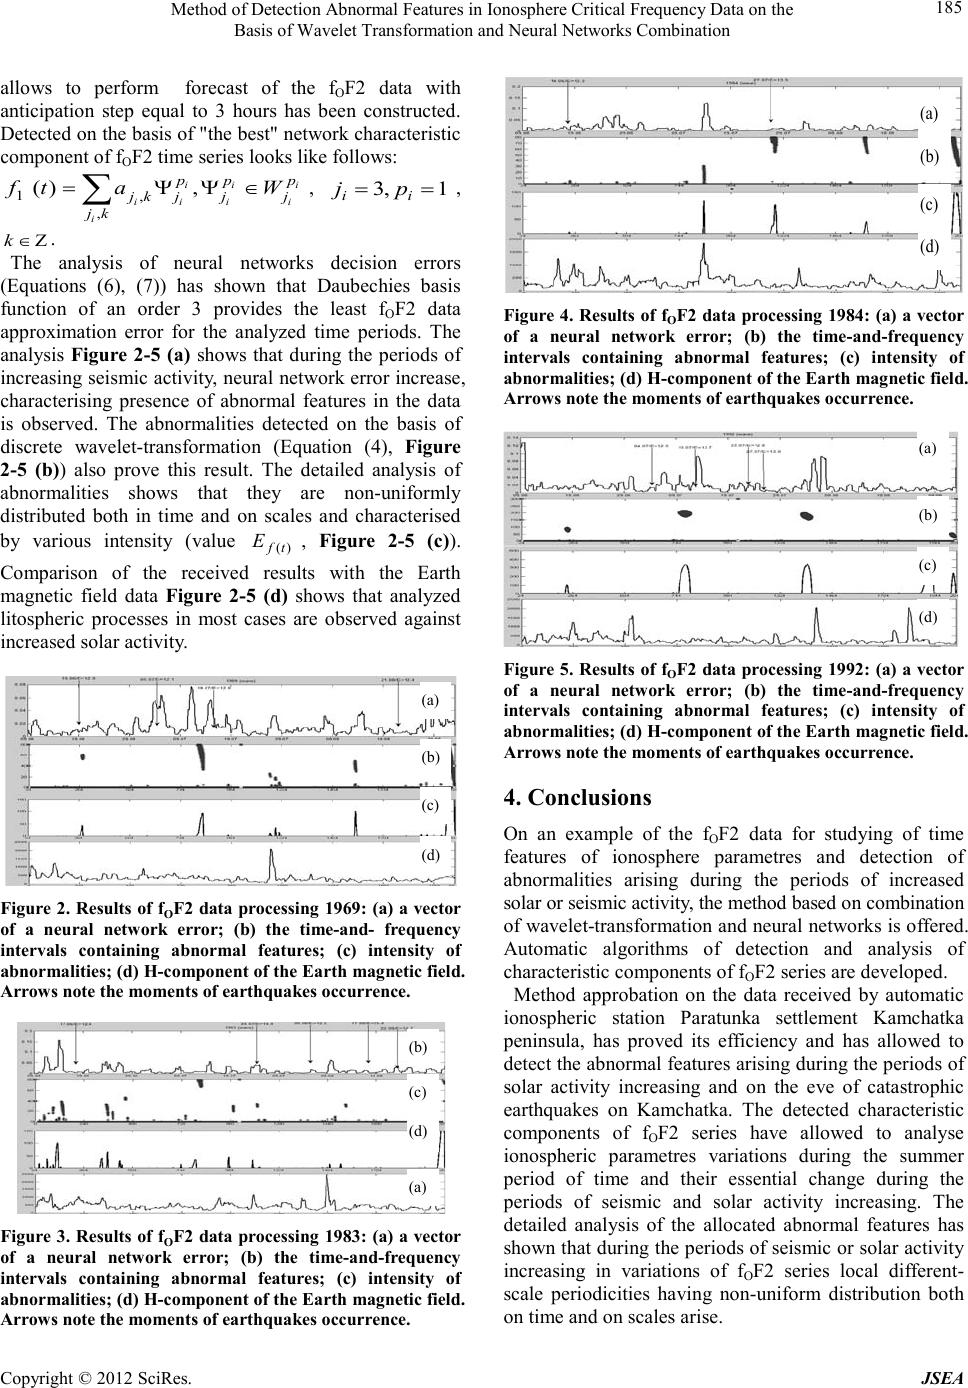 Method of Detection Abnormal Features in Ionosphere Critical Frequency Data on the Basis of Wavelet Transformation and Neural Networks Combination Copyright © 2012 SciRes. JSEA allows to perform forecast of the fOF2 data with anticipation step equal to 3 hours has been constructed. Detected on the basis of "the best" network characteristic component of fOF2 ti me serie s looks like follows: i i i i i i ii p j p j kj p jkj Watf∈ΨΨ= ∑,)( ,, 1 , , . The analysis of neural networks decision errors (Equations (6), (7)) has shown that Daubechies basis function of an order 3 provides the least fOF2 data approximation error for the analyzed time periods. The analysis Figure 2-5 (а) shows that during the periods of increasing seismic activity, neural network error increase, characterising presence of abnormal features in the data is observed. The abnormalities detected on the basis of discrete wavele t-transformation (Equation (4), Figure 2-5 (b)) also prove this result. The detailed analysis of abnormalities shows that they are non-uniformly distributed both in time and on scales and characterised by various intensity (value , Figure 2-5 (c)). Comparison of the received results with the Earth magnetic field data Figure 2-5 (d) shows that analyzed litospheric processes in most cases are observed against increased solar activity. Figure 2. Results of fOF2 data processing 1969: (a) a vector of a neural network error; (b) the time-and- frequency intervals containing abnormal features; (c) intensity of abnormalities; (d) H-component of the Earth mag netic field. Arrows note the moments of earthquakes occurrence. Figure 3. Results of fOF2 data processing 1983: (a) a vector of a neural network error; (b) the time-and-frequency intervals containing abnormal features; (c) intensity of abnormalities; (d) H-component of the Earth magnetic field. Arrows note the moments of earthquakes occurrence. Figure 4. Results of fOF2 data processing 1984: (a) a vector of a neural network error; (b) the time-and-frequency intervals containing abnormal features; (c) intensity of abnormalities; (d) H-component of the Earth magnetic field. Ar rows note the moments of ea rt hquakes occ urrence. Figure 5. Results of fOF2 data processing 1992: (a) a vector of a neural network error; (b) the time-and-frequency intervals containing abnormal features; (c) intensity of abnormalities; (d) H-component of the Earth magnetic field. Arrows note the moments of earthquakes occurrence. 4. Conclusions On an example of the fOF2 data for studying of time features of ionosphere parametres and detection of abnormalities arising during the periods of increased solar or seismic activity, the method based o n co mbination of wavelet-tra nsfor matio n and neural networ ks is o ffered. Automatic algorithms of detection and analysis of characteristic compone nts of fOF2 series are developed. Method approbation on the data received by automatic ionospheric station Paratunka settlement Kamchatka peninsula, has proved its efficiency and has allowed to detect the abnormal features arising during the periods of solar activity increasing and on the eve of catastrophic earthquakes on Kamchatka. The detected characteristic components of fOF2 series have allowed to analyse ionospheric parametres variations during the summer period of time and their essential change during the periods of seismic and solar activity increasing. The detailed analysis of the allocated abnormal features has sho wn that dur ing t he per iods of se ismic or solar activit y increasing in variations of fOF2 series local different- scale p er iodicities having non-uniform distribution both on time and on scales arise. 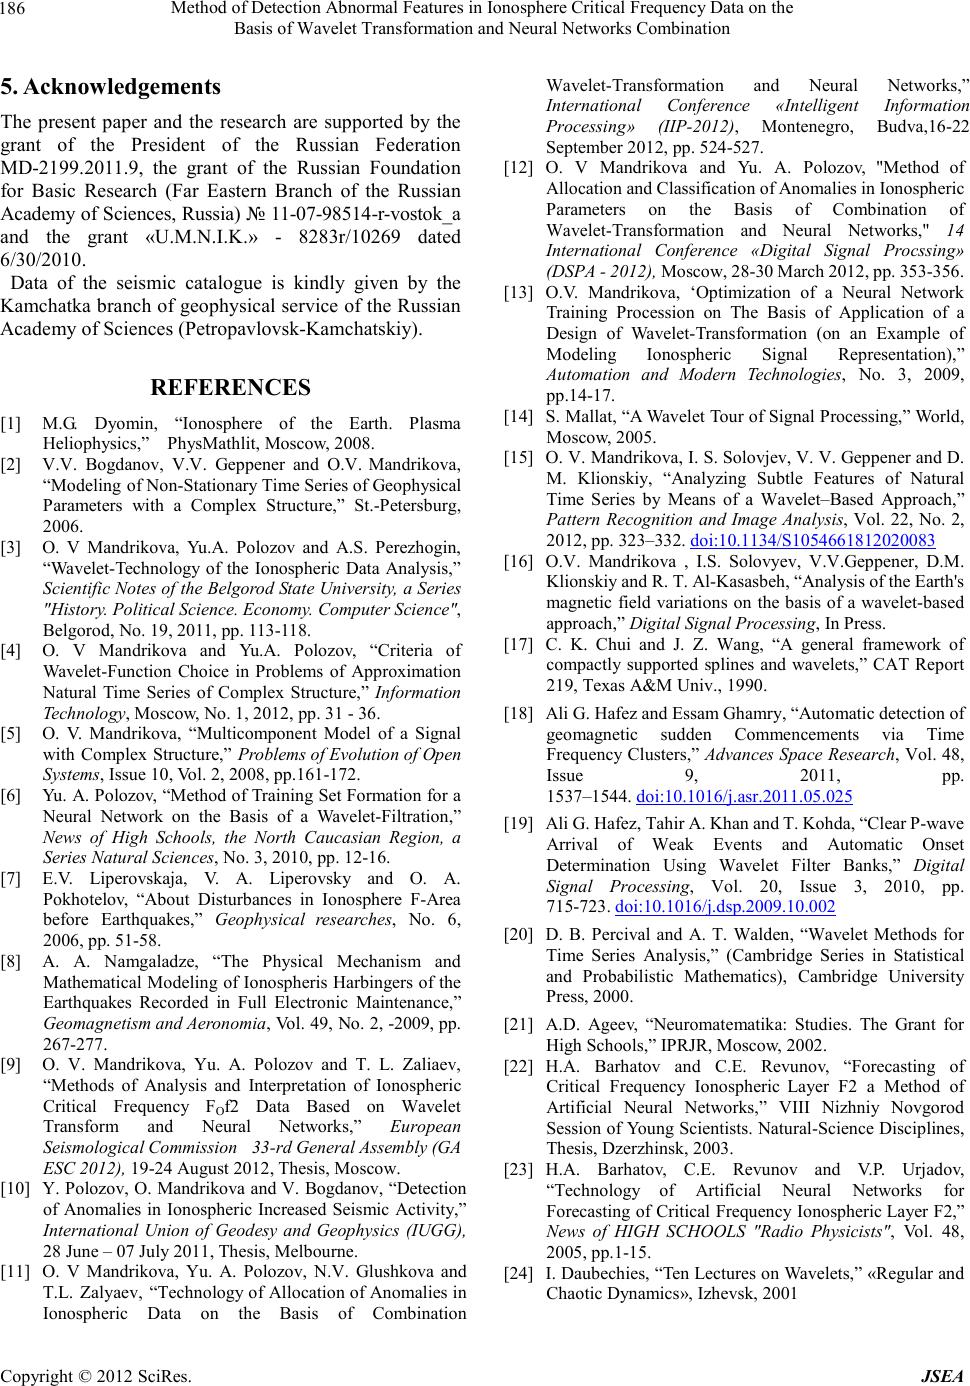 Method of Detection Abnormal Features in Ionosphere Critical Frequency Data on the Basis of Wavelet Trans fo rmation and Neural Networks Combination Copyright © 2012 SciRes. JSEA 186 5. Acknowledgements The present paper and the research are supported by the grant of the President of the Russian Federation MD-2199.2011.9, the grant of the Russian Foundation for Basic Research (Far Eastern Branch of the Russian Academy of Sciences, R ussia) № 11-07-98514-r-vostok_a and the grant «U.М.N.I.K.» - 8283r/10269 dated 6/30/2010. Data of the seismic catalogue is kindly given by the Kamchatka branch of geophysical service of the Russian Academy of Sciences (Petropavlovsk-Kamchatskiy). REFERENCES [1] M.G. Dyomin, “Ionosphere of the Earth. Plasma Heliophysics,” PhysMathlit, Moscow, 2008. [2] V.V. Bogdanov, V.V. Geppener and O.V. Mandrikova, “Modeling of Non-Stationary Time Series of Geophysical Parameters with a Complex Structure,” St.-Petersburg, 2006. [3] O. V Mandrikova, Yu.A. Polozov and A.S. Perezhogin, “Wavelet-Technology of the Ionospheric Data Analysis,” Scientific Notes of the Belgorod State University, a Series "History. Political Science. Economy. Computer Science", Belgorod, No. 19, 2011, pp. 113-11 8. [4] O. V Mandrikova and Yu.A. Polozov, “Criteria of Wavelet-Function Choice in Problems of Approximation Natural Time Series of Complex Structure,” Information Technology, Mos c ow, No. 1, 2012, pp. 31 - 36. [5] O. V. Mandrikova, “Multicomponent Model of a Signal with Complex Structure,” Problems of Evolution of Open Systems, Issue 10, Vol. 2, 2008, pp.161-172. [6] Yu. A. Polozov, “Method of Training Set Formation for a Neural Network on the Basis of a Wavelet-Filtration,” News of High Schools, the North Caucasian Region, a Series Natural S ciences, No. 3, 2010, pp. 12-16. [7] E.V. Liperovskaja, V. А. Liperovsky and O. A. Pokhotelov, “About Disturbances in Ionosphere F-Area before Earthquakes,” Geophysical researches, No. 6, 2006, pp . 51-58. [8] A. A. Namgaladze, “The Physical Mechanism and Mathematical Modeling of Ionospheris Harbingers of the Earthquakes Recorded in Full Electronic Maintenance,” Geom agnetis m and A eronom ia, Vol. 49, No. 2, -2009, pp. 267-277. [9] O. V. Mandrikova, Yu. A. Polozov and T. L. Zaliaev, “Methods of Analysis and Interpretation of Ionospheric Critical Frequency FOf2 Data Based on Wavelet Transform and Neural Networks,” European Seismological Commission 33-rd General Assembly (GA ESC 2012), 19-24 August 2012, Thesis, Moscow. [10] Y. Polozov, O. Mandrikova and V. Bogdano v, “Det ection of Anomalies in Ionospheric Increased Seismic Activity,” International Union of Geodesy and Geophysics (IUGG), 28 June – 07 July 2011, Thesis, Melbourne. [11] O. V Mandrikova, Yu. A. Polozov, N.V. Glushkova and T.L. Zalyaev, “Technology of Allocatio n of Anomalies i n Ionospheric Data on the Basis of Combination Wavelet-Transformation and Neural Networks,” International Conference «Intelligent Information Processing» (IIP-2012), Montenegro, Budva,16-22 September 2012, pp. 524-527. [12] O. V Mandrikova and Yu. A. Polozov, "Method of Allocation an d Class if ic ation of Anomalies in Io nospher ic Parameters on the Basis of Combination of Wavelet-Transformation and Neural Networks," 14 International Conference «Digital Signal Procssing» (DSPA - 2012), M osc ow , 28-30 M arch 2012, pp . 353-356. [13] O.V. Mandrikova, ‘Optimization of a Neural Network Training Procession on The Basis of Application of a Design of Wavelet-Transformation (on an Example of Modeling Ionospheric Signal Representation),” Automation and Modern Technologies, No. 3, 2009, pp.14-17. [14] S. Mallat , “A Wav elet Tour of Sign al P rocessing, ” World , Moscow, 2005. [15] O. V. Mandrikova, I. S. Solovjev, V. V. Geppener and D. M. Klionskiy, “Analyzing Subtle Features of Natural Time Series by Means of a Wavelet–Based Approach,” Pattern Recognition and Image Analysis, Vol. 22, No. 2, 2012, pp . 323–332. doi:10.1134/S1054661812020083 [16] O.V. Mandrikova , I.S. Solovyev, V.V.Geppener, D.M. Klions k iy and R . T. Al -Kasasbeh, “Analysis of the Earth's magnetic field variations on the basis of a wavelet-based approach,” Digit al Si g nal Proces s ing, In Press. [17] C. K. Chui and J. Z. Wang, “A general framework of compactly supported splines and wavelets,” CAT Report 219, Texas A&M Univ., 1990. [18] Ali G. Hafez and Essam Ghamry, “Automatic detection of geomagnetic sudden Commencements via Time Frequ ency Clu sters,” Advances Spa ce Research, Vol. 48, Issue 9, 2011, pp. 1537–1544. doi:10.1016/j.asr.2011.05.025 [19] Ali G. Hafez, Tahir A. Khan and T. Kohda, “Clear P-wave Arrival of Weak Events and Automatic Onset Determination Using Wavelet Filter Banks,” Digital Signal Processing, Vol. 20, Issue 3, 2010, pp. 715-723. doi:10.1016/j.dsp.2009.10.002 [20] D. B. Percival and A. T. Walden, “Wavelet Methods for Time Series Analysis,” (Cambridge Series in Statistical and Probabilistic Mathematics), Cambridge University Press, 20 00. [21] A.D. Ageev, “Neuromatematika: Studies. The Grant for High Schools,” IPRJR, Moscow, 2002. [22] H.A. Barhatov and C.E. Revunov, “Forecasting of Critical Frequency Ionospheric Layer F2 a Method of Artificial Neural Networks,” VIII Nizhniy Novgorod Session of Young Scientists. Natural-Scien ce Disciplin es, Thesis, Dzerzhinsk, 2003. [23] H.A. Barhatov, C.E. Revunov and V.P. Urjadov, “Technology of Artificial Neural Networks for Forecast ing of Critical F requency Ionospheric La yer F 2,” News of HIGH SCHOOLS "Radio Physicists", Vol. 48, 2005, pp .1-15. [24] I. Daubech ies, “Ten Lectures o n Wavelets,” «Regular and Chaotic Dynamics», Izhevsk, 2001
|