 Graphene, 2013, 2, 18-34 http://dx.doi.org/10.4236/graphene.2013.21004 Published Online January 2013 (http://www.scirp.org/journal/graphene) Force Field Based MM2 Molecule-Surface Binding Energies for Graphite and Graphene Jae H. Son, Thomas R. Rybolt* Department of Chemistry, University of Tennessee at Chattanooga, Chattanooga, USA Email: *Tom-Rybolt@utc.edu Received November 11, 2012; revised December 12, 2012; accepted January 11, 2013 ABSTRACT The gas phase adsorption of 118 organic molecules on graphite and graphene was studied by calculating their mole- cule-surface binding energies, Ecal*, using molecular mechanics MM2 parameters. Due to the general lack of reported experimental binding energy values for organic molecules with graphene, E*(graphene), it was considered desirable to have a simple but effective method to estimate these values. Calculated binding energy values using a three-layer model, Ecal*(3), were compared and correlated to published experimental values for graphitic surfaces, E*(graphite). Pub- lished values of experimental binding energies for graphite, E*(graphite), were available from gas-solid chromatogram- phy in the Henry’s Law region over a range of temperature. Calculated binding energy values using a one-layer model, Ecal*(1), were compared to the three-layer Ecal*(3) values and found to consistently be 93.5% as large. This relation along with an E*(graphite) and Ecal*(3) correlation was used to develop a means to estimate molecule-graphene bind- ing energies. Using this approach we report estimated values of 118 molecule-graphene binding energy values. Keywords: Molecule-Graphene Interaction; Molecule-Graphite Interaction; Molecular Mechanics; Adsorption Energy; Binding Energy on Graphene; Binding Energy on Graphite 1. Introduction Graphene is a now well-known single layer of carbons arranged in a hexagonal configuration. Multiple layers of graphene stacked upon each other and held together by van der Waal forces form graphite. Graphene is of great interest because of its many unique properties [1,2]. Gra- phene is transparent, light, and an excellent conductor of electricity and heat. Its transparency and electric conduc- tivity are desirable properties for touch screen electronic devices. Graphene’s thermal and electrical conductivity outperform copper. At room temperature, copper has a thermal conductivity of 401 Wm−1·K−1 while graphene’s is 5000 Wm−1·K−1 [3]. The electrical conductivity of copper is 0.60 × 10⁶ Ω−1·cm−1 and graphene’s is 0.96 × 10⁶ Ω−1·cm−1 [3]. The breaking strength of graphene is approximately 42 N/m and an equivalent thickness, steel has a value of 0.40 N/m [3]. In addition to these striking graphene properties, one promising application of this unique two-dimensional material is as a molecular sen- sor. Graphene-based devices have been considered for various electronic and optoelectronic devices as well as gas sensors and biosensors [4]. A single layer of gra- phene, bilayer of graphene, few-layers of graphene, or modified graphene surface can act as a sensor when a molecule adsorbs on the surface and changes the gra- phene’s electric conductivity or other measureable prop- erty. The change in conductivity or other property can then be correlated with amount of molecules adsorbed [5]. For example, the electrical conductivity of a gra- phene fabricated device was observed to increase linearly with an increase of carbon dioxide in the 10 to 100 ppm range [6]. In order to exploit the potential applications of gra- phene as gas sensors, the adsorption of a series of small gas molecules on pristine graphene and Si-doped gra- phene have been investigated by ab initio calculations [7]. Their theoretical results indicated that the electronic pro- perties are sensitive to oxygen and nitrogen dioxide ad- sorption, but not as much modified by the adsorption of carbon monoxide and water [7]. The adsorption of inor- ganic molecules including water, ammonia, carbon mo- noxide, nitrogen dioxide, and nitrogen oxide on a gra- phene substrate were considered using first-principles calculations [8]. Graphene surfaces and variously modi- fied graphene surfaces have been used to develop gas sensor devices and successfully have been used to detect ammonia [9], sulfur dioxide [10], nitrogen dioxide [11], nitrogen dioxide and ammonia [12], carbon dioxide [6], acetone [13], hydrogen sulfide [14], and hydrogen [15, *Corresponding author. C opyright © 2013 SciRes. Graphene  J. H. SON, T. R. RYBOLT 19 16]. A variety of surface modifications have been ex- plored and their detection effects examined [14-20]. Adsorption can be studied theoretically by calculating the adsorption interaction energy (binding energy) of a molecule on the surface. A molecule with higher binding energy should have greater adsorption on the graphene surface. For example, given the same amounts of two different molecules in the gas phase (atmosphere sur- rounding the graphene sensor surface, for example), the ratio of the amounts of those two molecules physically adsorbed on the surface would be different depending on the relative binding energy. The molecule with the stronger binding energy would be expected to be favored in surface physisorption. Therefore, the study of binding energy is important for developing sensors and correlat- ing sensor responses to amounts physically adsorbed and further correlating these amounts to the actual concentra- tions in a complex mixed molecule environment around the sensor. It would be useful to be able to predict single layer graphene binding energies for a variety of organic mole- cules. There is a lack of gas phase experimental binding energies for organic molecules on graphene. However, there have been many experimental studies relating to molecule adsorption on graphite. Using this molecule- graphite binding energy data, our approach is to study the relationship of calculated and experimental graphite ad- sorption energies and also of calculated graphite and calculated graphene binding energies. Assuming suitable relations are found then it should be possible to calculate molecule-surface binding energies on graphene or graph- ite and then predict experimental binding energies of molecules on graphene. Previous studies showed that MM2 molecular mecha- nics parameters for atom-carbon van der Waals (vdW) interactions are suitable to effectively predict molecule- carbon surface binding energies [21-25]. In these prior studies of gas-solid interactions, the standard augmented MM2 parameters developed by Allinger [26,27] were used to estimate the binding energies of organic mole- cules interacting with various model carbon surfaces [21- 25]. The adsorption of neutral molecules on a carbon surface is dominated by dispersive van der Waals (vdW) forces. In previous studies [21-25] molecule-surface ste- ric energy differences for an adsorbate molecule adjacent to or far from a model adsorbent surface were used to estimate the energy due to adsorption, the binding energy. Although force field calculations do not reference elec- tronic behavior, they have been widely used for deter- mining minimum energies and optimized molecular ge- ometries [28]. 2. Experimental Data A review of the literature revealed a lack of experimental organic molecule-graphene interaction energies. How- ever, a significant number of organic molecule-graphite interaction energies have been reported. These experi- ments typically utilized either thermal programmed de- sorption (TPD) or gas-solid chromatography (GSC). TPD experiments usually give information about multilayer or monolayer desorption and so molecule-molecule interac- tions cannot be ignored [21]. However, many GSC deter- minations involved finding the low coverage Henry’s constants and so reflect the interaction of isolated mole- cules with the carbon surface. Sample gas corrected retention times can be converted to a Henry’s law adsorption constant (KH). In various published studies these Henry law constants were ob- tained over a range of temperature values [29-42]. A plot of the natural logarithm of KH versus the reciprocal of the temperature (d ln KH/d/T) gives a plot whose slope is E*/R where E* is the molecule-surface binding energy or adsorption interaction energy and R is the gas constant. If given as R = 0.001986 kcal·K−1·mol−1 then the slope times R gives the E* value in kcal/mol. As E* increases then it indicates stronger molecule surface interactions. Published Studies using Graphitized Thermal Carbon Black (GTCB) were selected as suitable graphitic ad- sorbents. A total of 118 different organic molecules with a variety of structures and functionality determined from GSC on suitable graphitic surfaces were identified and are reported in Table 1. Table 1 gives the assigned mo- lecule number, molecule name, chemical formula, refer- ence source for value, experimental value E*, and the organic group to which the molecule is assigned. Experi- mental binding energy data are reported in various units but were converted to kcal/mol for all comparisons. The experimental binding energies or physisorption interac- tion energies are commonly reported in eV, meV, kJ/mol, and Kelvin. The conversion factors used were based on the relations 1 kcal/mol = 4.336411 × 10⁻² eV = 43.36411 meV = 4.184 kJ/mol = 503.217 K. 3. Theory The energy of a molecule calculated from molecular mechanics, EMM, (augmented MM2 parameters were used in this work) is a sum of covalent and noncovalent energies. The MM2 covalent energy contributions in- clude stretch, stretch-bend, angle, dihedral, improper torsion; and the noncovalent energy contributions include electrostatics, hydrogen-bonding, and van der Waals. The van der Waals interaction energy, EvdW, is a parameter that contributes to the noncovalent bond energy, and the Van der Waals radius of atoms dominates the molecule- graphite and molecule-graphene interactions. If two nonbonded atoms are pushed too close together, they will strongly repel from one other. If they are at a suitable intermediate range, they will experience a mutual attrac- Copyright © 2013 SciRes. Graphene  J. H. SON, T. R. RYBOLT Copyright © 2013 SciRes. Graphene 20 Table 1. Assigned molecule number, molecule name, chemical formula, reference source for value, experimental value E*, and the organic group to which the molecule is assigned. Number Name Formula Ref E*(Graphite) kcal/mol Group 1 butyl aldehyde C4H8O 29 7.4 aldehyde 2 capron aldehyde C6H12O 29 10.3 aldehyde 3 capryl aldehyde C8H16O 29 13.4 aldehyde 4 croton aldehyde C4H6O 29 8.7 aldehyde 5 isobutyl aldehyde C4H8O 29 7.2 aldehyde 6 isovaler aldehyde C5H10O 29 8.7 aldehyde 7 pelargon aldehyde C9H19O 29 14.1 aldehyde 8 propyl aldehyde C3H6O 29 6.7 aldehyde 9 valer aldehyde C5H10O 29 8.8 aldehyde 10 ethane C2H6 30 4.3 alkane 11 n-butane C4H10 30 6.8 alkane 12 n-decane C10H22 31 16.1 alkane 13 n-heptane C7H16 31 11.7 alkane 14 n-hexane C6H14 31 10.3 alkane 15 n-nonane C9H20 31 14.6 alkane 16 n-octane C8H18 31 13.3 alkane 17 n-propane C3H8 30 5.3 alkane 18 n-1-butene C4H8 30 6.7 alkene 19 n-1-decene C10H20 31 15.3 alkene 20 n-1-heptene C7H14 31 11.2 alkene 21 n-1-hexene C6H12 31 10.0 alkene 22 n-1-nonene C9H18 31 14.2 alkene 23 n-1-octene C8H16 31 12.9 alkene 24 allyl alcohol C3H6O 29 6.4 alkyl alcohol 25 heptanol-1 C7H16O 29 12.4 alkyl alcohol 26 hexanol-1 C6H14O 29 10.9 alkyl alcohol 27 Isoamyl alcohol C5H12O 29 8.5 alkyl alcohol 28 isobutyl alchol C4H10O 29 7.5 alkyl alcohol 29 isopropyl alcohol C3H6O 29 6.7 alkyl alcohol 30 n-pentanol C5H12O 29 9.5 alkyl alcohol 31 n-butyl alcohol C4H10O 29 8.3 alkyl alcohol 32 propyl alcohol C3H6O 29 6.8 alkyl alcohol 33 secondary amyl alcohol C5H12O 29 8.6 alkyl alcohol 34 secondary butyl alcohol C4H10O 29 7.6 alkyl alcohol 35 tertiary amy alcohol C5H12O 29 7.8 alkyl alcohol 36 tertiary butyl alcohol C4H10O 29 7.2 alkyl alcohol 37 di-n-propylamine C10H19N 32 15.8 alkyl amine 38 dibutylamine C8H19N 32 13.3 alkyl amine 39 diisobutylamine C8H19N 32 12.2 alkyl amine  J. H. SON, T. R. RYBOLT 21 Continued 40 dipropylamine C6H15N 32 10.3 alkyl amine 41 tri-n-propylamine C15H33N 32 21.3 alkyl amine 42 tributylamine C12H27N 32 17.3 alkyl amine 43 triethylamine C6H15N 32 8.7 alkyl amine 44 hexyne C6H10 29 8.6 alkyne 45 1-aminoadamantane C10H17N 33 10.4 aromatic amine 46 1,3,5-triazine C3H3N3 34 8.0 aromatic amine 47 1,8-dimethyl naphthalene C12H12 35 17.4 aromatic amine 48 2-aminoadamantane C10H17N 33 10.7 aromatic amine 49 2,3-dimethyl indol C10H11N 32 16.9 aromatic amine 50 3-methyl indol C9H9N 32 16.0 aromatic amine 51 alpha-naphthylamine C10H9N 32 17.4 aromatic amine 52 alpha-phenyl propionitrile C9H9N 32 12.8 aromatic amine 53 alpha-phenylethylamine C8H11N 32 12.6 aromatic amine 54 aniline C6H7N 32 11.6 aromatic amine 55 Benzonitrile C7H5N 32 11.9 aromatic amine 56 beta-naphthylamine C10H9N 32 17.6 aromatic amine 57 diphenylamine C12H11N 32 21.1 aromatic amine 58 indol C8H7N 32 15.0 aromatic amine 59 m-toluidine C7H9N 32 13.3 aromatic amine 60 N-methylaniline C7H9N 32 13.6 aromatic amine 61 N,N-diethylaniline C10H15N 32 16.5 aromatic amine 62 N,N-dimethylaniline C8H11N 32 15.3 aromatic amine 63 O-toluidine C7H9N 32 13.3 aromatic amine 64 p-toluidine C7H9N 32 13.4 aromatic amine 65 Pyrazine C4H4N2 34 8.7 aromatic amine 66 Pyridine C5H5N 34 9.3 aromatic amine 67 1-methyl-naphthalene C11H10 30 15.8 benzene 68 1,2,3,5-tetramethyl C10H14 36 15.8 benzene 69 1,2,4-trimethylbenzene C9H12 36 14.5 benzene 70 1,3,5-trimethylbenzene C9H12 36 14.3 benzene 71 2,3-dimethylnaphthalene C12H12 35 18.2 benzene 72 alpha-methyl naphthalene C11H10 35 17.0 benzene 73 benzene C6H6 36 8.9 benzene 74 beta-methyl naphthalene C11H10 35 17 benzene 75 biphenyl acetylene C14H10 37 20.6 benzene 76 diphenyl C12H10 36 16.3 benzene 77 ethyl benzene C8H10 36 11.2 benzene 78 fluorene C13H10 38 19.4 benzene 79 hexa-methyl benzene C12H18 36 18.7 benzene 80 iso-propyl benzene C9H12 36 11.5 benzene Copyright © 2013 SciRes. Graphene  J. H. SON, T. R. RYBOLT 22 Continued 81 m-xylene C8H10 36 12.6 benzene 82 n-pentyl benzene C11H16 36 14.6 benzene 83 n-butyl benzene C10H14 36 13.6 benzene 84 n-propyl benzene C9H12 36 12.8 benzene 85 naphthalene C10H8 36 14.9 benzene 86 o-xylene C8H10 36 12.6 benzene 87 p-xylene C8H10 36 12.6 benzene 88 para-terphenyl C18H14 39 22.7 benzene 89 penta-methyl benzene C11H16 36 17.4 benzene 90 toluene C7H8 36 10.3 benzene 91 1,3-dichlorobenzene C6H4Cl2 40 12.4 chloro aromatic 92 1,4-dichlorobenzene C6H4Cl2 40 12.7 chloro aromatic 93 2-chlorodiphenyl C12H9Cl 41 15.8 chloro aromatic 94 2,6-dichlorodiphenyl C12H8Cl2 41 16.2 chloro aromatic 95 2,6,2-trichlorodiphenyl C12H7Cl3 41 16.2 chloro aromatic 96 2,4,6-trichlorodiphenyl C12H7Cl3 41 17.7 chloro aromatic 97 4-chlorodiphenyl C12H9Cl 41 17.5 chloro aromatic 98 chlorobenzene C6H5Cl 40 10.6 chloro aromatic 99 cyclohexane C6H12 36 7.0 cycloalkane 100 ethyl cyclohexane C8H16 42 10.2 cycloalkane 101 isopropyl cyclohexane C9H18 42 11.0 cycloalkane 102 methyl cyclohexane C7H14 42 8.5 cycloalkane 103 acetone C3H6O 29 6.4 ketone 104 dibutyl acetone C9H18O 29 14.3 ketone 105 dipropyl acetone C7H14O 29 11.1 ketone 106 ethyl-isoamyl-acetone C8H16O 29 12.1 ketone 107 mesityl oxyde C6H10O 29 11.4 ketone 108 methyl-butyl-acetone C6H12O 29 10.3 ketone 109 methyl-ethyl-acetone C4H8O 29 7.9 ketone 110 methyl-heptyl acetone C9H18O 29 14.9 ketone 111 methyl-hexyl acetone C8H16O 29 13.1 ketone 112 methyl-isobutyl-acetone C6H12O 29 9.9 ketone 113 2-methyl thiophene C5H7S 40 10.0 thiophene 114 2-methylthianaphene C9H9S 40 15.8 thiophene 115 3-methyl thiophene C5H7S 40 10.0 thiophene 116 3-methylthianaphene C9H9S 40 15.8 thiophene 117 thianaphthene C8H6S 40 14.1 thiophene 118 thiophene C4H4S 40 8.0 thiophene Copyright © 2013 SciRes. Graphene 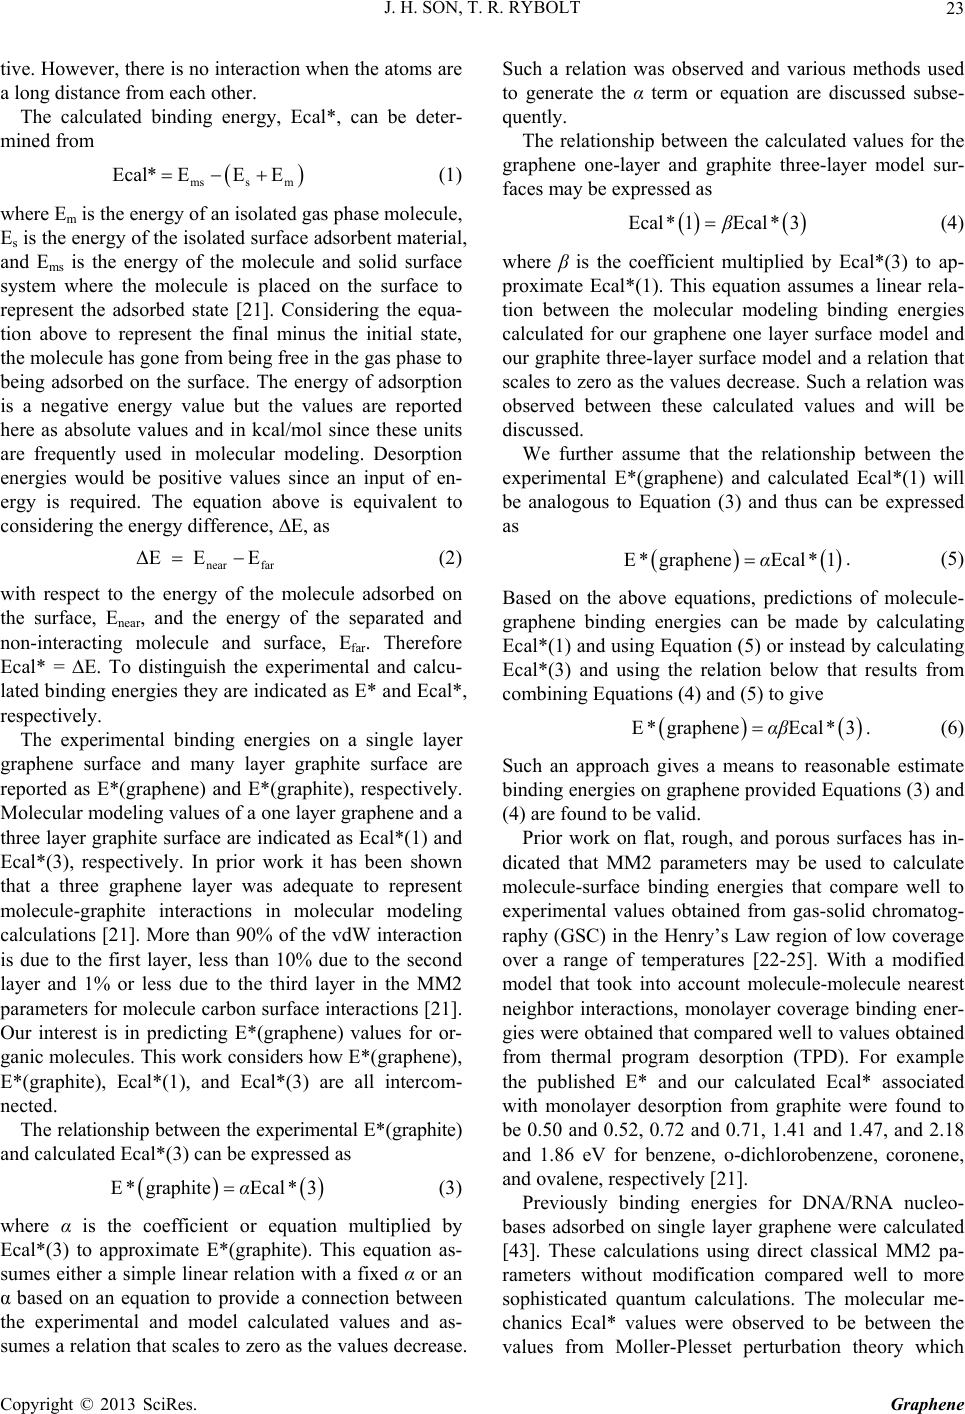 J. H. SON, T. R. RYBOLT Copyright © 2013 SciRes. Graphene 23 tive. However, there is no interaction when the atoms are a long distance from each other. The calculated binding energy, Ecal*, can be deter- mined from mss m EcalEE E* (1) where Em is the energy of an isolated gas phase molecule, Es is the energy of the isolated surface adsorbent material, and Ems is the energy of the molecule and solid surface system where the molecule is placed on the surface to represent the adsorbed state [21]. Considering the equa- tion above to represent the final minus the initial state, the molecule has gone from being free in the gas phase to being adsorbed on the surface. The energy of adsorption is a negative energy value but the values are reported here as absolute values and in kcal/mol since these units are frequently used in molecular modeling. Desorption energies would be positive values since an input of en- ergy is required. The equation above is equivalent to considering the energy difference, ∆E, as near far ΔE EE (2) with respect to the energy of the molecule adsorbed on the surface, Enear, and the energy of the separated and non-interacting molecule and surface, Efar. Therefore Ecal* = ∆E. To distinguish the experimental and calcu- lated binding energies they are indicated as E* and Ecal*, respectively. The experimental binding energies on a single layer graphene surface and many layer graphite surface are reported as E*(graphene) and E*(graphite), respectively. Molecular modeling values of a one layer graphene and a three layer graphite surface are indicated as Ecal*(1) and Ecal*(3), respectively. In prior work it has been shown that a three graphene layer was adequate to represent molecule-graphite interactions in molecular modeling calculations [21]. More than 90% of the vdW interaction is due to the first layer, less than 10% due to the second layer and 1% or less due to the third layer in the MM2 parameters for molecule carbon surface interactions [21]. Our interest is in predicting E*(graphene) values for or- ganic molecules. This work considers how E*(graphene), E*(graphite), Ecal*(1), and Ecal*(3) are all intercom- nected. The relationship between the experimental E*(graphite) and calculated Ecal*(3) can be expressed as EgraphiteEcal 3*α* (3) where α is the coefficient or equation multiplied by Ecal*(3) to approximate E*(graphite). This equation as- sumes either a simple linear relation with a fixed α or an α based on an equation to provide a connection between the experimental and model calculated values and as- sumes a relation that scales to zero as the values decrease. Such a relation was observed and various methods used to generate the α term or equation are discussed subse- quently. The relationship between the calculated values for the graphene one-layer and graphite three-layer model sur- faces may be expressed as Ecal 1Ecal3*β* (4) where β is the coefficient multiplied by Ecal*(3) to ap- proximate Ecal*(1). This equation assumes a linear rela- tion between the molecular modeling binding energies calculated for our graphene one layer surface model and our graphite three-layer surface model and a relation that scales to zero as the values decrease. Such a relation was observed between these calculated values and will be discussed. We further assume that the relationship between the experimental E*(graphene) and calculated Ecal*(1) will be analogous to Equation (3) and thus can be expressed as EgrapheneEcal 1*α* . (5) Based on the above equations, predictions of molecule- graphene binding energies can be made by calculating Ecal*(1) and using Equation (5) or instead by calculating Ecal*(3) and using the relation below that results from combining Equations (4) and (5) to give EgrapheneEcal 3*αβ * . (6) Such an approach gives a means to reasonable estimate binding energies on graphene provided Equations (3) and (4) are found to be valid. Prior work on flat, rough, and porous surfaces has in- dicated that MM2 parameters may be used to calculate molecule-surface binding energies that compare well to experimental values obtained from gas-solid chromatog- raphy (GSC) in the Henry’s Law region of low coverage over a range of temperatures [22-25]. With a modified model that took into account molecule-molecule nearest neighbor interactions, monolayer coverage binding ener- gies were obtained that compared well to values obtained from thermal program desorption (TPD). For example the published E* and our calculated Ecal* associated with monolayer desorption from graphite were found to be 0.50 and 0.52, 0.72 and 0.71, 1.41 and 1.47, and 2.18 and 1.86 eV for benzene, o-dichlorobenzene, coronene, and ovalene, respectively [21]. Previously binding energies for DNA/RNA nucleo- bases adsorbed on single layer graphene were calculated [43]. These calculations using direct classical MM2 pa- rameters without modification compared well to more sophisticated quantum calculations. The molecular me- chanics Ecal* values were observed to be between the values from Moller-Plesset perturbation theory which 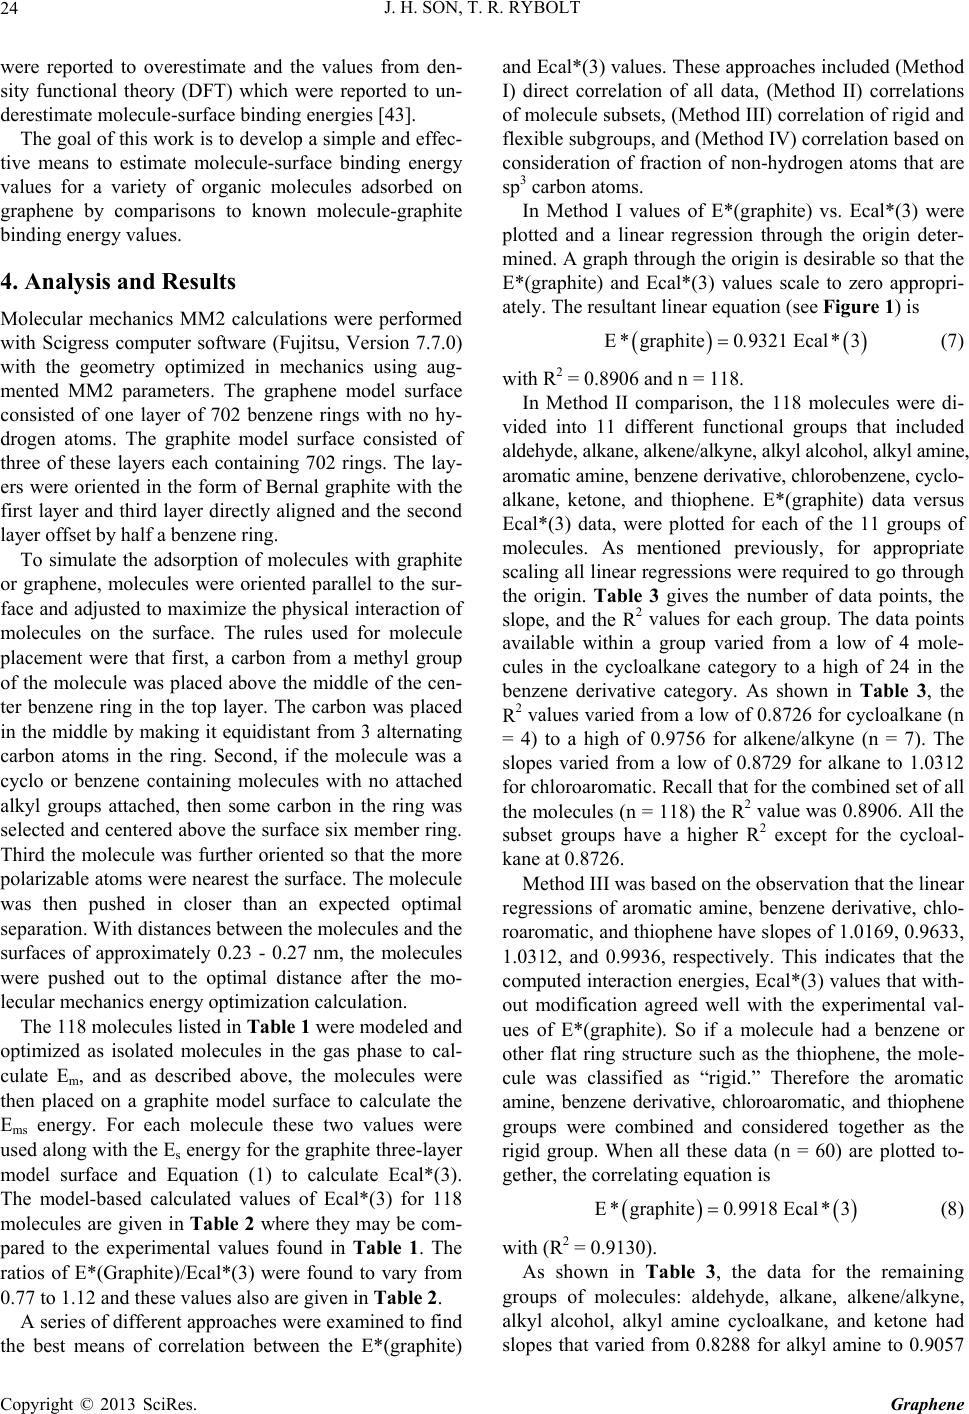 J. H. SON, T. R. RYBOLT 24 were reported to overestimate and the values from den- sity functional theory (DFT) which were reported to un- derestimate molecule-surface binding energies [43]. The goal of this work is to develop a simple and effec- tive means to estimate molecule-surface binding energy values for a variety of organic molecules adsorbed on graphene by comparisons to known molecule-graphite binding energy values. 4. Analysis and Results Molecular mechanics MM2 calculations were performed with Scigress computer software (Fujitsu, Version 7.7.0) with the geometry optimized in mechanics using aug- mented MM2 parameters. The graphene model surface consisted of one layer of 702 benzene rings with no hy- drogen atoms. The graphite model surface consisted of three of these layers each containing 702 rings. The lay- ers were oriented in the form of Bernal graphite with the first layer and third layer directly aligned and the second layer offset by half a benzene ring. To simulate the adsorption of molecules with graphite or graphene, molecules were oriented parallel to the sur- face and adjusted to maximize the physical interaction of molecules on the surface. The rules used for molecule placement were that first, a carbon from a methyl group of the molecule was placed above the middle of the cen- ter benzene ring in the top layer. The carbon was placed in the middle by making it equidistant from 3 alternating carbon atoms in the ring. Second, if the molecule was a cyclo or benzene containing molecules with no attached alkyl groups attached, then some carbon in the ring was selected and centered above the surface six member ring. Third the molecule was further oriented so that the more polarizable atoms were nearest the surface. The molecule was then pushed in closer than an expected optimal separation. With distances between the molecules and the surfaces of approximately 0.23 - 0.27 nm, the molecules were pushed out to the optimal distance after the mo- lecular mechanics energy optimization calculation. The 118 molecules listed in Tab le 1 were modeled and optimized as isolated molecules in the gas phase to cal- culate Em, and as described above, the molecules were then placed on a graphite model surface to calculate the Ems energy. For each molecule these two values were used along with the Es energy for the graphite three-layer model surface and Equation (1) to calculate Ecal*(3). The model-based calculated values of Ecal*(3) for 118 molecules are given in Table 2 where they may be com- pared to the experimental values found in Table 1. The ratios of E*(Graphite)/Ecal*(3) were found to vary from 0.77 to 1.12 and these values also are given in Table 2. A series of different approaches were examined to find the best means of correlation between the E*(graphite) and Ecal*(3) values. These approaches included (Method I) direct correlation of all data, (Method II) correlations of molecule subsets, (Method III) correlation of rigid and flexible subgroups, and (Method IV) correlation based on consideration of fraction of non-hydrogen atoms that are sp3 carbon atoms. In Method I values of E*(graphite) vs. Ecal*(3) were plotted and a linear regression through the origin deter- mined. A graph through the origin is desirable so that the E*(graphite) and Ecal*(3) values scale to zero appropri- ately. The resultant linear equation (see Figure 1) is Egraphite09321 Ecal3*. * (7) with R2 = 0.8906 and n = 118. In Method II comparison, the 118 molecules were di- vided into 11 different functional groups that included aldehyde, alkane, alkene/alkyne, alkyl alcohol, alkyl amine, aromatic amine, benzene derivative, chlorobenzene, cyclo- alkane, ketone, and thiophene. E*(graphite) data versus Ecal*(3) data, were plotted for each of the 11 groups of molecules. As mentioned previously, for appropriate scaling all linear regressions were required to go through the origin. Table 3 gives the number of data points, the slope, and the R2 values for each group. The data points available within a group varied from a low of 4 mole- cules in the cycloalkane category to a high of 24 in the benzene derivative category. As shown in Table 3, the R2 values varied from a low of 0.8726 for cycloalkane (n = 4) to a high of 0.9756 for alkene/alkyne (n = 7). The slopes varied from a low of 0.8729 for alkane to 1.0312 for chloroaromatic. Recall that for the combined set of all the molecules (n = 118) the R2 value was 0.8906. All the subset groups have a higher R2 except for the cycloal- kane at 0.8726. Method III was based on the observation that the linear regressions of aromatic amine, benzene derivative, chlo- roaromatic, and thiophene have slopes of 1.0169, 0.9633, 1.0312, and 0.9936, respectively. This indicates that the computed interaction energies, Ecal*(3) values that with- out modification agreed well with the experimental val- ues of E*(graphite). So if a molecule had a benzene or other flat ring structure such as the thiophene, the mole- cule was classified as “rigid.” Therefore the aromatic amine, benzene derivative, chloroaromatic, and thiophene groups were combined and considered together as the rigid group. When all these data (n = 60) are plotted to- gether, the correlating equation is Egraphite09918 Ecal3*. * (8) with (R2 = 0.9130). As shown in Table 3, the data for the remaining groups of molecules: aldehyde, alkane, alkene/alkyne, alkyl alcohol, alkyl amine cycloalkane, and ketone had slopes that varied from 0.8288 for alkyl amine to 0.9057 Copyright © 2013 SciRes. Graphene 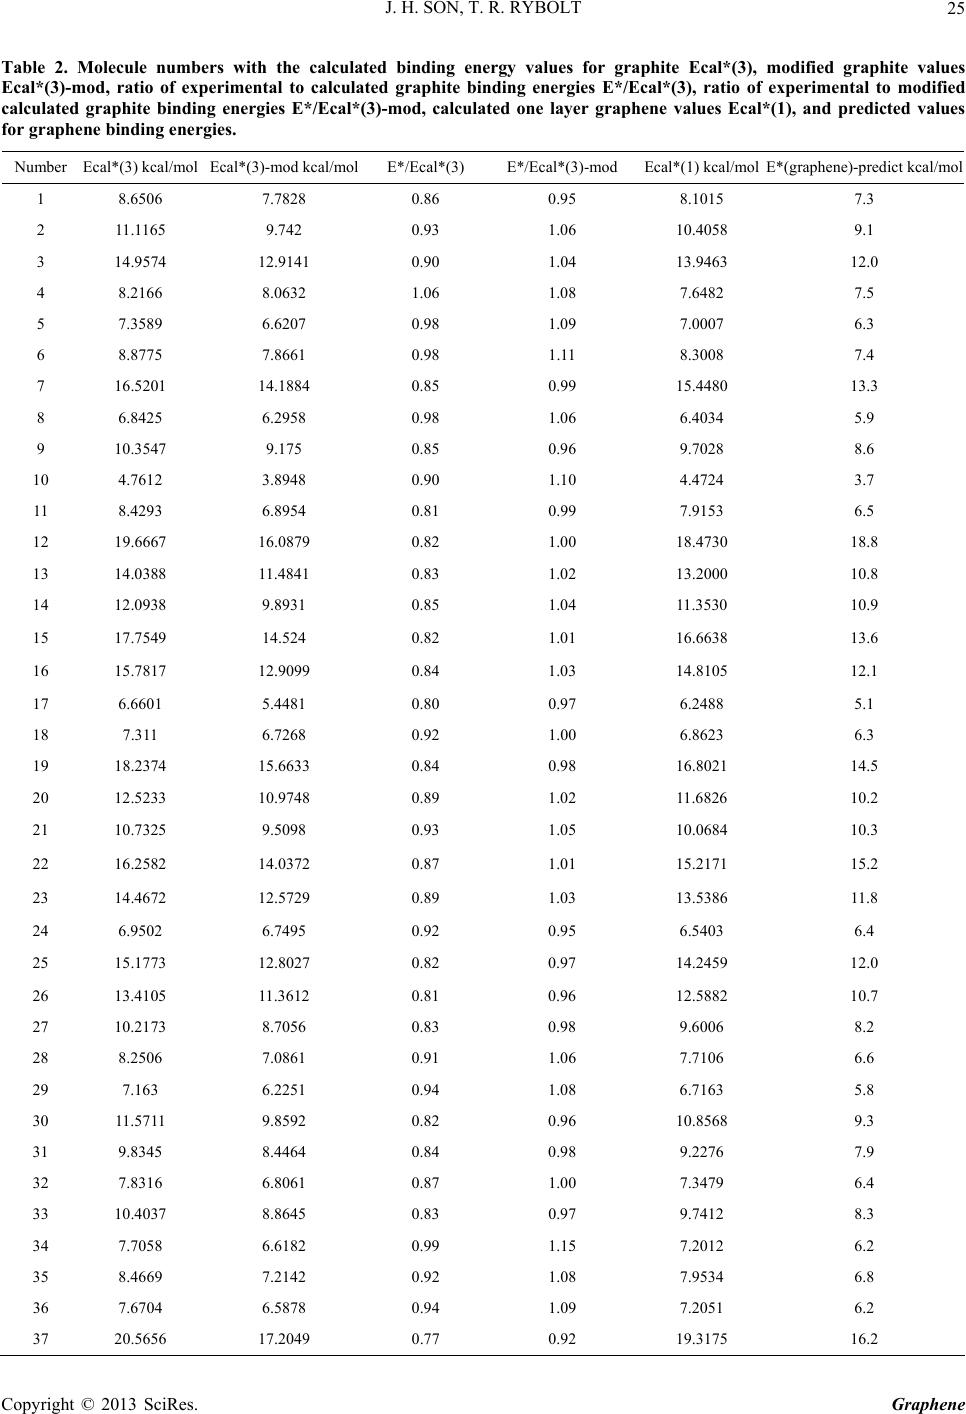 J. H. SON, T. R. RYBOLT Copyright © 2013 SciRes. Graphene 25 Table 2. Molecule numbers with the calculated binding energy values for graphite Ecal*(3), modified graphite values (3)-mod kcal/mol E*/Ecal*(3) E*/Ecal*(3)-mod Ecal*(1) kcal/mol E*(graphene)-predict kcal/mol Ecal*(3)-mod, ratio of experimental to calculated graphite binding energies E*/Ecal*(3), ratio of experimental to modified calculated graphite binding energies E*/Ecal*(3)-mod, calculated one layer graphene values Ecal*(1), and predicted values for graphene binding energies. Number Ecal*(3) kcal/mol Ecal* 1 8.6506 7.7828 0.86 0.95 8.1015 7.3 2 11.1165 9.742 0.93 1.06 10.4058 9.1 3 14.9574 12.9141 1 1 0.90 1.04 13.9463 12.0 4 8.2166 8.0632 1.06 1.08 7.6482 7.5 5 7.3589 6.6207 0.98 1.09 7.0007 6.3 6 8.8775 7.8661 0.98 1.11 8.3008 7.4 7 16.5201 14.1884 0.85 0.99 15.4480 13.3 8 6.8425 6.2958 0.98 1.06 6.4034 5.9 9 10.3547 9.175 0.85 0.96 9.7028 8.6 10 4.7612 3.8948 0.90 1.10 4.4724 3.7 11 8.4293 6.8954 0.81 0.99 7.9153 6.5 12 19.6667 16.0879 0.82 1.00 18.4730 18.8 13 14.0388 11.4841 0.83 1.02 13.2000 10.8 14 12.0938 9.8931 0.85 1.04 11.3530 10.9 15 17.7549 14.524 0.82 1.01 16.6638 13.6 16 15.7817 12.9099 0.84 1.03 14.8105 12.1 17 6.6601 5.4481 0.80 0.97 6.2488 5.1 18 7.311 6.7268 0.92 1.00 6.8623 6.3 19 8.237415.6633 0.84 0.98 16.8021 14.5 20 12.5233 10.9748 0.89 1.02 11.6826 10.2 21 10.7325 9.5098 0.93 1.05 10.0684 10.3 22 16.2582 14.0372 0.87 1.01 15.2171 15.2 23 14.4672 12.5729 0.89 1.03 13.5386 11.8 24 6.9502 6.7495 0.92 0.95 6.5403 6.4 25 15.1773 12.8027 0.82 0.97 14.2459 12.0 26 13.4105 11.3612 0.81 0.96 12.5882 10.7 27 10.2173 8.7056 0.83 0.98 9.6006 8.2 28 8.2506 7.0861 0.91 1.06 7.7106 6.6 29 7.163 6.2251 0.94 1.08 6.7163 5.8 30 1.5711 9.8592 0.82 0.96 10.8568 9.3 31 9.8345 8.4464 0.84 0.98 9.2276 7.9 32 7.8316 6.8061 0.87 1.00 7.3479 6.4 33 10.4037 8.8645 0.83 0.97 9.7412 8.3 34 7.7058 6.6182 0.99 1.15 7.2012 6.2 35 8.4669 7.2142 0.92 1.08 7.9534 6.8 36 7.6704 6.5878 0.94 1.09 7.2051 6.2 37 20.5656 17.2049 0.77 0.92 19.3175 16.2 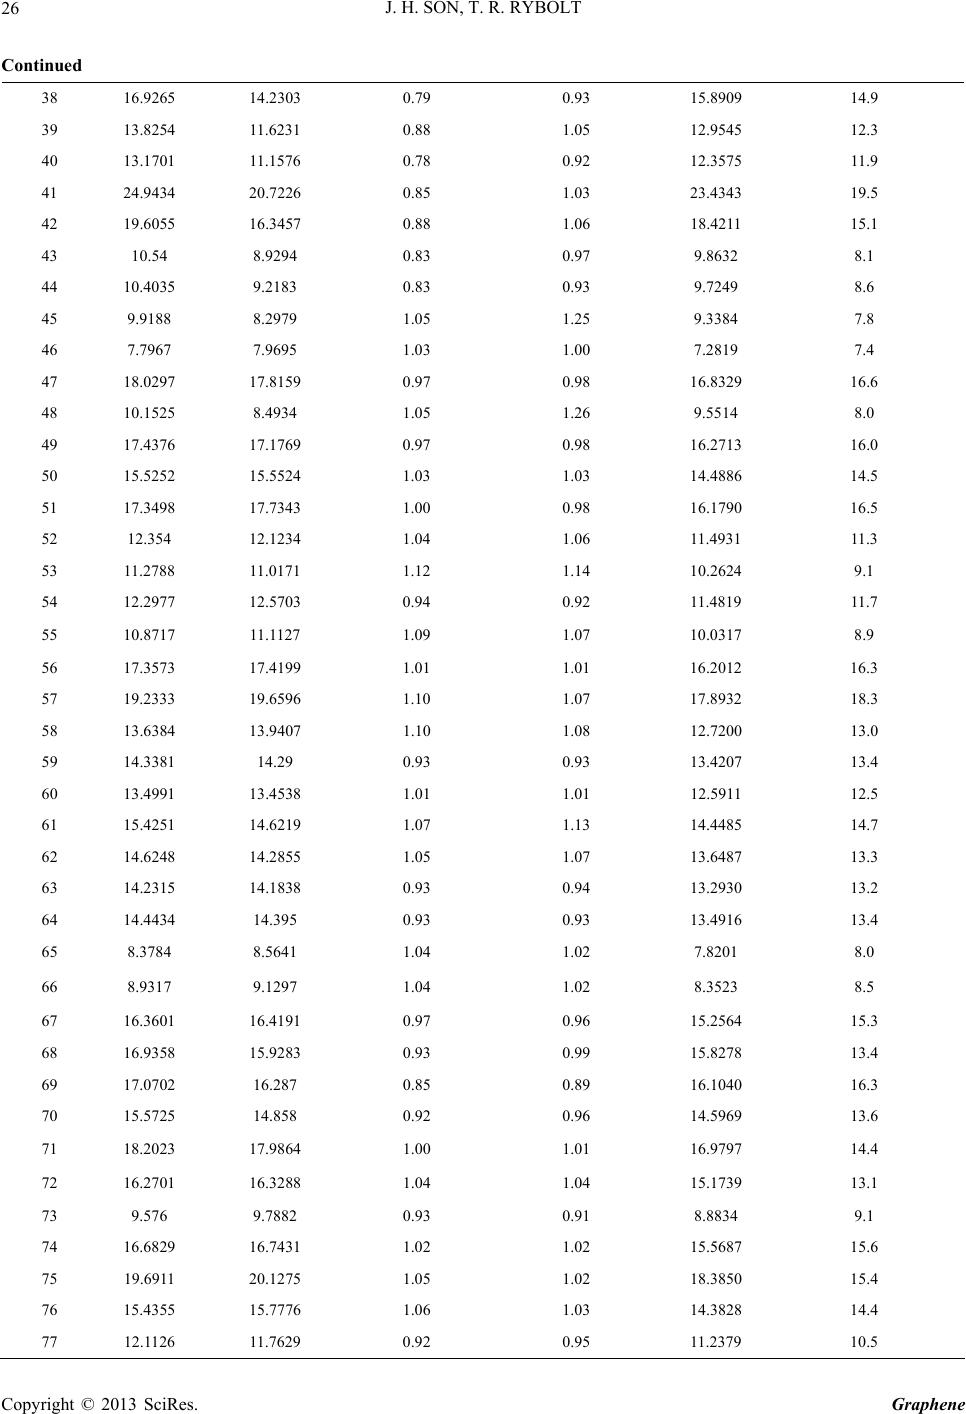 J. H. SON, T. R. RYBOLT 26 Continued 16.9265 14.2303 0.79 0.93 15.8909 14.9 38 39 13.8254 11.6231 0.88 1.05 12.9545 12.3 40 13.1701 11.1576 0.78 0.92 12.3575 11.9 41 24.9434 20.7226 0.85 1.03 23.4343 19.5 42 19.6055 16.3457 0.88 1.06 18.4211 15.1 43 10.54 8.9294 0.83 0.97 9.8632 8.1 44 1 1 1 77 12.1126 11.7629 0.92 0.95 11.2379 10.5 0.40359.2183 0.83 0.93 9.7249 8.6 45 9.9188 8.2979 1.05 1.25 9.3384 7.8 46 7.7967 7.9695 1.03 1.00 7.2819 7.4 47 18.0297 17.8159 0.97 0.98 16.8329 16.6 48 10.1525 8.4934 1.05 1.26 9.5514 8.0 49 17.4376 17.1769 0.97 0.98 16.2713 16.0 50 15.5252 15.5524 1.03 1.03 14.4886 14.5 51 17.3498 17.7343 1.00 0.98 16.1790 16.5 52 12.354 12.1234 1.04 1.06 11.4931 11.3 53 11.2788 11.0171 1.12 1.14 10.2624 9.1 54 12.2977 12.5703 0.94 0.92 11.4819 11.7 55 10.8717 11.1127 1.09 1.07 10.0317 8.9 56 17.3573 17.4199 1.01 1.01 16.2012 16.3 57 19.2333 19.6596 1.10 1.07 17.8932 18.3 58 13.6384 13.9407 1.10 1.08 12.7200 13.0 59 14.3381 14.29 0.93 0.93 13.4207 13.4 60 13.4991 3.45381.01 1.01 12.5911 12.5 61 15.4251 14.6219 1.07 1.13 14.4485 14.7 62 14.6248 14.2855 1.05 1.07 13.6487 13.3 63 14.2315 14.1838 0.93 0.94 13.2930 13.2 64 14.4434 14.395 0.93 0.93 13.4916 13.4 65 8.3784 8.5641 1.04 1.02 7.8201 8.0 66 8.9317 9.1297 1.04 1.02 8.3523 8.5 67 16.3601 16.4191 0.97 0.96 15.2564 15.3 68 16.9358 15.9283 0.93 0.99 15.8278 13.4 69 17.0702 16.287 0.85 0.89 16.1040 16.3 70 15.5725 14.858 0.92 0.96 14.5969 13.6 71 18.2023 17.9864 1.00 1.01 16.9797 14.4 72 16.2701 16.3288 1.04 1.04 15.1739 13.1 73 9.576 9.7882 0.93 0.91 8.8834 9.1 74 6.682916.7431 1.02 1.02 15.5687 15.6 75 19.6911 20.1275 1.05 1.02 18.3850 15.4 76 15.4355 15.7776 1.06 1.03 14.3828 14.4 Copyright © 2013 SciRes. Graphene  J. H. SON, T. R. RYBOLT 27 Continued 78 18.2586 18.3766 1.06 1.06 17.0269 17.1 79 20.2064 18.5918 0.93 1.01 18.9263 17.4 1 118 8.5846 8.7749 0.93 0.91 7.9981 8.2 80 11.4603 10.9345 1.00 1.05 10.6949 10.2 81 13.6196 13.2264 0.93 0.95 12.7310 13.0 82 17.5189 16.2816 0.83 0.90 16.3308 15.2 83 15.5873 14.66 0.87 0.93 14.5106 13.9 84 13.8437 13.2085 0.92 0.97 12.8623 10.9 85 14.6034 4.92711.02 1.00 13.6477 14.0 86 13.1729 12.7926 0.96 0.98 12.2962 10.5 87 13.5546 13.1633 0.93 0.96 12.6671 12.3 88 22.6612 23.1635 1.00 0.98 21.1151 21.6 89 18.2592 16.9696 0.95 1.03 17.1053 15.9 90 11.5674 11.4864 0.89 0.90 10.8043 10.7 91 12.9318 13.2184 0.96 0.94 12.0376 12.3 92 12.8689 13.1541 0.99 0.97 11.9701 12.2 93 14.8622 15.1916 1.06 1.04 13.8765 14.2 94 15.2383 15.576 1.06 1.04 14.3751 14.7 95 15.4103 15.7518 1.05 1.03 14.4006 13.7 96 16.3088 16.6703 1.09 1.06 15.2360 15.6 97 17.1266 17.5062 1.02 1.00 15.9001 15.4 98 11.2641 11.5138 0.94 0.92 10.4851 10.0 99 8.7455 7.1541 0.80 0.98 8.2032 6.7 100 11.8776 9.7162 0.86 1.05 11.1466 9.1 101 11.8508 9.6943 0.93 1.13 11.1610 9.1 102 10.5161 8.6025 0.81 0.99 9.8764 8.4 103 7.0548 6.4911 0.91 0.99 6.6022 6.1 104 17.7988 15.2866 0.80 0.94 16.6893 14.3 105 14.0043 12.1706 0.79 0.91 13.1325 11.4 106 14.6858 12.6796 0.82 0.95 13.8034 11.9 107 12.0338 11.2477 0.95 1.01 11.2562 9.3 108 12.4057 10.8718 0.83 0.95 11.6537 10.2 109 8.7048 7.8315 0.91 1.01 8.1405 7.3 110 17.9867 15.448 0.83 0.96 16.8834 16.8 111 16.1562 13.9491 0.81 0.94 15.1430 13.1 112 11.1266 9.7508 0.89 1.02 10.4099 10.7 113 10.7257 10.5985 0.93 0.94 9.9975 9.9 114 15.7348 15.7623 1.00 1.00 14.6754 14.7 115 10.604 10.4782 0.94 0.95 9.8864 9.8 116 15.4225 15.4495 1.02 1.02 14.3652 14.7 117 13.65 13.9525 1.03 1.01 12.7079 12.4 Copyright © 2013 SciRes. Graphene  J. H. SON, T. R. RYBOLT Copyright © 2013 SciRes. Graphene 28 Figure 1. Experimental organic molecule-graphitic surface binding energies versus three layer calculated binding en- ergies for 118 adsorbate molecules gave a linear regression of E*(graphite) = 0.9321 Ecal*(3) with (R2 = 0.8906). ry. R2 Table 3. Number of data points, the slope, and the R2 values for each group. The data points available within a group varied from a low of 4 molecules in the cycloalkane cate- ory to a high of 24 in the benzene derivative categog values varied from a low of 0.8726 for cycloalkane to a high of 0.9756 for alkene/alkyne. The slopes varied from a low of 0.8729 for alkane to 1.0312 for chloroaromatic. Parameters Functional Group Slope R2 n aldehyde 0.9057 0.9308 9 alkane 0.8291 alkene/alkyne 0.6 7 al ale ar c 0.9971 8 0.8751 975 lkyl alcoho0.8564 0.9043 13 kyl amin0.8288 0.96 7 ketone 0.8362 0.9421 10 cycloalkane 0.8581 0.8726 4 omatic amine1.0169 0.9394 22 benzene 0.9633 0.8971 24 hloroaromatic 1.0312 0.9257 8 thiophene 0.9936 0.9728 6 for alere grtogetwhat won- sidere catehble mo lacked g structuhe me and had otentially more conformational flexibility. The average Whiese R2 val0.9130 for rigid and 0.9621e flexible es are better the R2 of 0.8906 for all the molecule together, a still better correla- tion is ed to be abively usel*(3) val- (graphite). From the considerations above, it is clear that the calculated values for the “flexible” structures since as shown i must be multiplied by on average 0. olecule category was do arized as dehyde and w d as the “flexible” ouped gory. T her in e flexi e c lecules a flat rinre in toleculso p of the slopes in Table 3 for these seven groups was 0.8556 with a 0.0280 standard deviation. When all these “flexible” data (n = 58) are plotted together, the correlat- ing equation is E*graphite0 8500 Ecal*3. (9) with (R2 = 0.9621). ues to predict E* le thues of the for thmolecul than needle to effect Eca are too high n Figure 2 the Ecal*(3) values 85 to bring their values down to agreement with the E*(graphite) experimental values. However, there is more variation within individual molecules than simply placing into these two groups. To reconcile the differences observed for the “rigid” and “flexible” molecules and to have one common equa- tion and one correlation for all the molecules, a different approach was needed. We observed that the MM2 vdW parameters for the sp3 carbon atoms were overestimating their carbon surface interactions and hence could be cor- related only by using about 85% of their estimated bind- ing energy values. The flexible m minated by tetrahedral bonded carbons which we label below as C-sp3 atoms. However, the trigonal planar sp2 carbons dominated the so called rigid molecules had MM2 vdW parameters that matched well with the ex- perimental interaction energies and hence had slopes close to one. In examining the individual molecules we were able to observe variations depending on the number of C-sp3 atoms and C-sp2 and other atoms. These obser- vations led to the next approach. In Method IV for every molecule all non-hydrogen atoms were counted and placed into one of two catego- ries. The atom was either a sp3 hybridized carbon or not. The non sp3 carbon atoms included sp2 trigonal planar bonding carbon atoms, sp linear bonding carbon atoms, and all other atoms such as oxygen, nitrogen, sulfur. All hydrogen atoms were excluded from the counting proc- ess. So the relations may be summ Figure 2. Experimental organic molecule-graphitic surface binding energies versus three layer calculated binding en- ergies for rigid (n = 60) and flexible (n = 58) adsorbate molecules gave linear regressions of E*(graphite) = 0.9918 Ecal*(3) with R2 = 0.9130 and E*(graphite) = 0.8500 Ecal*(3) with R2 = 0.9621, respectively.  J. H. SON, T. R. RYBOLT 29 totalC-sp3 other nn n (10) C-sp3C-sp3 total fnn (11) (12) (13) where ntotal is the total number of nonhydrogen atoms, nC-sp3 is the number of sp3 carbon atoms, nother is the number of all other nonhydrogen and non sp3 carbon atoms, fC-sp3-c is the fraction of sp3 carbon atoms, and fother totalotherothern/nf C-sp3 other 1f f is the fraction of all other nonhydrogen atoms. Using the above relations then the Equation (3) may be written as C-sp3 C-sp3otherother E*graphitec fc f Ecal*3 (14) c and care the best fit coefficients C-sp3 other the fraction of sp3 carbon atoms and non-hydrogen atoms, respectively. T tion (3) is now represented as α = (cC-sp3 f C-sp3 + cother fother). The cC-sp3 and cother were derive regression calculation using E*(g values in Table 1 along with fC-sp3 tion for α in are indicated as Ecal*(3)-modified. For ex- ample, consider the molecule 1,2,3,5-tetrameth zene that consist of 4 sp3 carbon atoms and 6 sp2 c (15) di graphene, the second and third layers were removed from molecules already placed on the graphite model using the procedure previously des The Ems was recalculated for each molecule after MM optim 3.5% of the calculated value on graphite. Th multiplied by fraction of other he α term in Equa- d from multilinear raphite) and Ecal*(3) and fother values for each of the 118 molecules. The best fit coefficients for csp3-C was found to be 0.8180 and for cother was found to be 1.0221. The originally calculated Ecal*(3) for each of the 118 molecules could then be modified by the equa Equation (14) and are given in Table 2. These modi- fied values ylben- arbon atoms. The fractions are fC-sp3 = 0.4000 and fother = 0.6000. Using the best fit values of the fractions csp3-C gives [(0.8180) (0.4000) + (1.0221) (0.6000)] 16.9358 kcal/ mol = [0.9405] [16.9358] = 15.9274 or 15.9 kcal/mol. Clearly 15.9 is much better estimate of the reported ex- perimental binding energy of 15.8 kcal/mol. Figure 3 shows a plot of E*(Graphite) versus Ecal*(3)- modified where Ecal* 3 -modified C-sp3 other 08180 f1 0221 f Ecal*3.. The linear regression for E*(graphite) versus Ecal*(3)- modified (n = 118) gave a slope of 1.0000 and (R2 = 0.9647). While still using the standard MM2 parameters this approach provides a fairly simple modification that provides reasonable estimates of E*(graphite). A com- parison of Figures 1 and 3 shows a change of R2 from 0.8906 to 0.9647 indicating a significant improvement in the correlation. Next, it was necessary to determine values of Ecal*(1). A molecule must have same placement and orientation for accurate comparison. The only part that should be fferent was the number of layers for the surface. To convert graphite to cribed. 2 ization and then used with Em values and an Es(graphene) calculated value to find Ecal*(1) using Equation (1). The average ratio of Ecal*(1)/Ecal*(3) for the 118 molecules gave an average and standard devia- tion of 0.9350 ± 0.004. Figure 4 shows a plot of Ecal*(1) versus Ecal*(3) and the slope based on a linear regres- sion was 0.9349 with (R2 = 0.9998). The results indicated the calculated binding energy of a molecule on graphene is consistently 9 us, the β from Equation (4) is determined to be 0.935 and may the relation may be expressed as Ecal10 935 Ecal3*. * (16) Figure 3. Experimental organic molecule-graphitic surface binding energies versus modified three layer calculated binding energies for 118 adsorbate molecule regression of E*(graphite) = 1.0000 Ecal*( =118) with (R2 = 0.9647). s gave a linear 3)-modified (n Figure 4. Plot of Ecal*(1) modeling binding energy on gra- phene versus Ecal*(3) modeling binding energies on graph- ite for 118 organic adsorbate molecules gave a linear re- gression with a slope of 0.9349 and (R2 = 0.9998). Copyright © 2013 SciRes. Graphene  J. H. SON, T. R. RYBOLT 30 So we propose that using MM2 parameters for a molecule in optimized geometry and then placed on a three layer graphite surface can give a reasonable esti- mate of the graphene binding energy using our Equation (6) expressed after combining Equations (14) and (15) to give (17) Or more directly if a molecule is placed on a single layer model graphene surface, a reasonable estimate of the expected molecule-graphene interaction or binding energy is obtained from the above as α = (cC-sp3 fC-sp3 + cother fother). 5. Discussion Th physical adsorption. Larger more polarizable atoms tend to increase vdW forces crease the binding energy. For example, comparing cules M91 1,3-dichlorobenzene and M73 benzene, one ob rface. Since our focus was t energy for a molecule adsorbed on a ives an average of 0.93 and a 0. nd Ecal*(3) with the Ecal*(1) values being 93 h. other nonhydrogen atoms have values that are on average C-sp3other E* graphene 0 93508180 f1 0221 f Ecal*3.. . C-sp3other E* graphene 0 8180 f1 0221 fEcal*1.. (18) It is assumed that the graphite correction also can be applied to graphene. This assumption is reasonable con- sidering a single carbon layer accounts for 93.5% of the MM2 graphite binding energies for the 118 molecules considered. The cCsp3 and cother above are taken directly from Equation (15). The α in Equation (3) is now repre- sented from e binding energy of an adsorbate molecule on an ad- sorbent surface can be affected by molecule size, mole- cule orientation, and the nature of surface. For organic molecules adsorbed on graphitic surfaces, van der Waals forces tend to dominate the in- mole- serves E* values of 12.4 and 8.9 kcal/mol, respectively. More atoms in a molecule increases the vdW forces. For example, comparing molecules M12 decane and M11 butane, one observes E* values of 16.1 and 6.8 kcal/mol, respectively. Different orientations of the molecule and different conformations can also affect the binding en- ergy. Orientations of molecules were selected to have the maximum contact with the su to find the lowes surface, we chose the most polarizable atom facing the surface as previously described because the vdW is stronger with more polarizable atoms near the surface and a flat orientation to put as much of the molecule on the surface as possible. The approach illustrated in Table 3 was to divide the experimental values into one of nine subgroups based on the molecular structure of the adsorbate. With the excep- tion of the cycloalkane group that only had four mole- cules and R2 = 0.8726, all the remaining R2 values were better than the set of all 118 molecules with R2 = 0.8906. The R2 for the eight other groups ranged from 0.8971 up to 0.9971. However it was desirable to have one general equation that would allow calculation of Ecal* for what- ever molecule was selected without regard to functional group. As shown in Table 2, our coefficients and the equation do not make our Ecal* values match with E* exactly. However, our modification provides a reasonable ap- proach to interpret the over-calculated values for the at- oms with sp3 hybridizations and improves the match of calculated and experimental values. Using the values of the E*/Ecal*(3) ratios g 09 standard deviation. Using the values of the E*/ Ecal*(3)-modified ratios gives an average of 1.01 and 0.07 standard deviation. This modification was necessary to successfully predict the binding energy. Figure 1 shows the E* versus Ecal* plots somewhat scattered with R2 of 0.8906 and a slope of 0.9321. However, Figure 3 shows E* versus Ecal*(3)-modified with a slope of 1.0000 and R2 of 0.9647. So Equation (15) provides an effective method to estimate E*(graphite) by modifying computed values of Ecal*(3). There is a regular relation between Ecal*(1) a .5% of the Ecal*(3) values as shown in Figure 4 and in Table 2. Our initial adjustment for the scatter in Figure 1 was to place molecules in categories of rigid (ring containing) or flexible (no ring) as illustrated in Table 3 based on the slopes that were near one for aromatic amine, benzene derivatives, chloroaromatic, and thiophene groups but clearly less than one for the remaining seven groups. While this division into two categories led to improved correlation coefficients with R2 equal to 0.9621 and 0.9130 for the flexible and rigid, respectively the cause of this difference was based on the overestimate of vdW forces between the surface carbon atoms and sp3 carbon atoms. For instance, Table 2 shows the ratio of E* (graphite)/Ecal*(3) is 0.87 for n-butyl benzene (M83) but for naphthalene (M85) this ratio is 1.02 meaning the cal- culated and experimental are in close agreement. Both molecules have same number of carbons but the Ecal* is about 15% too large due to the calculated vdW energy being too hig Since this overestimation occurs in a regular pattern we were able to adjust the Ecal* simply based on the fraction of nonhydrogen atoms that were sp3 carbon at- oms. This adjustment was accomplished by Equation (15) where the fraction of sp3 carbons is multiplied by 0.8180 Ecal* to give its E* contribution to E* and the fraction of all other nonhydrogen atoms is multiplied by 1.0221 Ecal* to give its contribution to E*. We see that on av- erage sp3 carbons have a value that is too high and all Copyright © 2013 SciRes. Graphene  J. H. SON, T. R. RYBOLT 31 slightly low. To test the application of our approach a molecule not in the original set of 118 molecules was selected for es- timation of E*(graphite) and E*(graphene). C. Thier- felder et al. reported calculated binding energies of me- thane on graphene with five different methods [44]. They used a reported experimental value of methane on graph- ite in the range of 0.12 - 0.14 eV. They also made an assumption that the binding energy of methane on gra- ph 6. orrec- mers and found ns with small basis sets tended to rs. By allowing these errors to offset n adsorption due to dis- pe t of 118 organic molecules us ene should be about 0.01 eV less than on graphite so their estimated binding energy value for methane on gra- phite was E*(graphite) = 0.12 to 0.14 eV and on gra- phene they estimated E*(graphene) = 0.11 to 0.13 eV. Our estimated energy for Ecal*(3) for methane was 3.40 kcal/mol and Ecal*(3)-modified was 2.8 kcal/mol (0.12 eV) and the predicted Ecal*(graphite) was 2.6 kcal/mol (0.11 eV). So our estimated binding energies of E*(graphite) = 0.12 eV and E*(graphene) = 0.11 eV agree with well their suggested values. Conclusions The weakness of noncovalent vdW interactions presents a general challenge for more exact quantum mechanical methods and density functional theory (DFT) calcula- tions as indicated by a comparison of 40 density func- tionals with noncovalent interaction energies [45,46]. DFT results have been reported to underestimate vdW interactions [47]. However, Moller-Plesset perturbation theory (MP2) has been reported to overestimate the binding energies [48]. The basis set used to model a molecule and a dimer cluster (benzene-coronene for ex- ample) can greatly affect the interaction energy. This er- ror is known as the basis set superposition error (BSSE). For benzene-coronene quantum calculations where coro- nene can be used to represent a graphene surface the MP2 results had to be modified by a counterpoise c tion of about 40% [48]. Tauer and Sherrill examined π-π interactions for benzene dimers and trim that MP2 calculatio have cancelling erro each other they were able to find interaction energies close, few tenths of kcal/mol, of a complete basis set couple cluster CCSD(T) limit [49]. Because of these computational challenges, for ease of use, for representa- tions of larger surface areas or multiple molecules, and for simpler and quicker calculations it can be useful to make estimates based on molecular mechanics and the approach outlined in this work. We used augmented MM2 parameters and classical molecular modeling to predict molecule-graphene bind- ing energies of 118 organic molecules. Our results sug- gest that this method can provide useful estimates of ex- perimental values that may otherwise be difficult to ob- tain. In prior work MM2 parameters and molecular me- chanics calculations have been used to estimate molecule surface interaction energies on flat, rough, and porous carbon surfaces [22-25,43]. The calculated binding energies for a molecule on the single layer graphene model were consistently found to be 93.5% of the value for the same molecule on the three-layer graphite model. This is in agreement with prior work for nucleobases on graphene and graphite that showed going from 1 to 3 layers increased binding en- ergy by 8% to 10% [43]. The MM2 calculations for these binding energies are dominated by vdW forces and these have been observed to give reasonable correlations when a standard 0.9 nm cutoff value was used. One implication for future sensor devices based o rsive forces on bilayer graphene is that the interaction energy for a bilayer should be very close, within a few percent, to the value for graphite. Although the MM2 parameters were not optimized for adsorption energy calculations, the values obtained for vdW dominated adsorption on carbon give good correla- tions with experimental. It was observed that calculated Ecal* values had to be corrected to better agree with the experimental E* for the se ed. The calculated binding energy was corrected with simple modification using coefficients that reduced the energy contribution from all sp3 carbon atoms by multi- ply the fraction of these atoms by 0.818 and the remain- ing carbon and heteroatoms (hydrogen atoms were not included in determining these fractions) were almost un- changed being multiplied by 1.022, respectively. The direct MM2 results gave the ratio of E*/Ecal*(3) as 0.93 (n = 118) with a standard deviation of 0.09. The modified MM2 results gave the ratio of E*/Ecal*(3)-mod as 1.01 (n = 118) with a standard deviation of 0.07. So the direct MM2 model based binding energies were on average larger than the experimental values by about 7.5% (1/0.93 = 1.075), but after the modification de- scribed previously and given in Equation (15), the aver- age of all 118 values was within about one percent. Most calculated values were within 7% of the corresponding experimental ones (see Table 2). The slope of E* versus Ecal*(3)-mod was 1.00 with R2 = 0.965 as shown in Fig- ure 3. The modification of the Ecal*(3) calculated values should apply to the graphene also so the Ecal*(3)-mod could be multiplied by 0.935 as shown in Equation (16) to find E*(graphene). Or more directly Ecal*(1) can be converted to E*(gaphene) using Equation (17). In other words, a molecule’s interaction energy can be calculated on a three layer model or a one layer model and effec- tively converted to a reasonable estimate of the expected experimental interaction energy on single layer graphene surface, E*(graphene). Using our data set correlations and extending it to a molecule not included in the origin- Copyright © 2013 SciRes. Graphene  J. H. SON, T. R. RYBOLT 32 nal set of 118 allowed us to test this method. Binding energies of 0.12 and 0.11 eV were obtained for methane and these compared well to published experimental and estimated values for graphite and graphene, respectively. Simpler non quantum mechanical calculations based on classical molecular mechanics continue to be of use to estimate molecule-surface binding energies based on weaker dispersion forces. This molecular mechanics ap- proach does not provide any electronic details but i us t is a eful, computationally simple approach to study mole- cule interactions on carbon surfaces and should be help- ful to predict how strongly various molecules may be held on future single layer graphene or bilayer graphene sensor detection devices. This approach may also be useful to predict interactions in other possible applica- tions such as surface self assembly, molecular separa- tions, or graphene-molecule storage and delivery devices. 7. Acknowledgements We gratefully acknowledge the support provided by the Grote Chemistry Fund and the Wheeler Odor Research Center at the University of Tennessee at Chattanooga. REFERENCES [1] S. W. Pati, T. Enoki and C. N. Rao, “Graphene and Its Fascinating Attributes,” World Scientific, Singapore, 2011. [2] W. Choi and J. Lee, “Graphene: Synthesis and Applica- tions,” CRC Press, Boca Raton, 2012. [3] Royal Swedish Academy of Sciences, “Scientific Back- ground on the Nobel Prize in Physics 2010 GRAPH- ENE,” 2010. http://www.nobelprize.org/nobel_prizes/physics/laureates /2010/advancedphysicsprize2010.pdf [4] P. T. Araujo, M. Terrones and M. S. Dresselhaus, “De- fects and Impurities in Graphene-Like Materials,” Mate- rials Today, Vol. 15, No. 3, 2012, pp. 98-109. doi:10.1016/S1369-7021(12)70045-7 [5] W. Choi, I. Lahiri, R. Seel thesis of Graphene and Its aboyina and Y. S. Kang, “Syn- Applications: A Review,” Cri- tical Reviews in Solid State Materials Sciences, Vol. 35, No. 1, 2010, pp. 52-71. doi:10.1080/10408430903505036 [6] H. J. Yoon, D. H. Jun, J. H. Yang, Z. Zhou, S. S. Yang and M. M.-C. C Graphene Shetors B: Chemical hen, “Carbon Dioxide Gas Sensor Using a et,” Sensors and Actua, Vol. 157, No. 1, 2011, pp. 310-313. doi:10.1016/j.snb.2011.03.035 [7] Y. Zou, F. Li, Z. H. Zhu, M. W. Zhao, X. G. Xu and X. Y. Su, “An ab Initio Study on Gas Sensing Properties of Graphene and Si-Doped Graphene,” European Physical Journal B, Vol. 81, No. 4, 2011, pp. 475-479. doi:10.1140/epjb/e2011-20225-8 [8] O. Leenaerts, B. Partoens and F. M. Peeters, “Adsorption of H2O, NH3, CO, NO2, and NO on Graphene: A First- Principles Study,” Physical Review B 2008, Article ID: 125416. doi:0.1103/PhysRevB.77.125416 [9] M. Gautam and A. H. Jayatissa, “Adsorption K Ammonia Sensing by Graphene Film inetics of s Decorated with Platinum Nanoparticles,” Journal of Applied Physics, Vol. 111, No. 9, 2012, Article ID: 094317. doi:10.1063/1.4714552 [10] Y. Ren, C. Zhu, W. Cai, H. Li, H. Ji, I. Kholmanov, Y. Wu, R. D. Piner and R. S. Ruoff, “Detection of Sulfur Dioxide Gas with Graphene Field Effect Transistor,” Ap- plied Physics Letters, Vol. 100, No. 16, 2012, Article ID: 163114. doi:10.1063/1.4704803 [11] M. G. Chung, D. H. Kim, H. M. Lee, D. K. Seo, J.-B. Yoo, S.-H. Ho T. Kim, J. H. Choi, ng, T. J. Kang and Y. H. Kim, “Highly Sensitive NO2 Gas Sensor Based on Ozone Treated Graphene,” Sensors and Actuators B: Chemical, Vol. 166-167, 2012, pp. 172-176. doi:10.1016/j.snb.2012.02.036 [12] S. Mao, S. Cui, G. Lu, K. Yu, Z. Wen and J. Chen, “Tun- ing Gas-Sensing Properties of Reduced Graphene Oxide Using Tin Oxide Nanocrystals,” Journal of Materials Chemistry, Vol. 22, 2012, pp. 11009-11013. doi:10.1039/c2jm30378g [13] H. Zhang, A. Kulkarni, H. Kim, D. Woo, Y.-J. Kim, B. H. Hong, J.-B. Choi and T. Kim, “Detection of Acetone Va- por Using Graphene on Polymer Optical Fiber,” Journal of Nanoscience and Nanotechnology, Vol. 11, No. 7, 2011, pp. 5939-5943. doi:10.1166/jnn.2011.4408 , J. S. Chung, E. W. Shin, D. H. [14] T. V. Cuong, V. H. Pham Yoo, S. H. Hahn, J. S. Huh, G. H. Rue, E. J. Kim, S. H. Hur and P. A. Kohl, “Solution-Processes ZnO-Chemically Converted Graphene Gas Sensor,” Materials Letters, Vol. 64, No. 22, 2010, pp. 2479-2482. doi:10.1016/j.matlet.2010.08.027 [15] J. L. Johnson, A. Behnam, S. J. Pearton and A. Ural, “Hydrogen Sensing Using Pd-Functionalized Multi-Layer Graphene Nanoribbon Networks,” Advanced Materials, Vol. 22, No. 43, 2010, pp. 4877-4880. doi:10.1002/adma.201001798 [16] W. Wu, Z. Liu, L. A. Jauregui, Q. Yu, R. Pillai, H. Cao, J. 70 Bao, Y. P. Chen and S.-S. Pei, “Wafer-Scale Synthesis of Graphene by Chemical Vapor Deposition and Its Appli- cation in Hydrogen Sensing,” Sensors and Actuators B: Chemical, Vol. 150, No. 1, 2010, pp. 296-300. doi:0.1016/j.snb.2010.06.0 [17] H. Song, L. Zhang, C. He, Y. Qu, Y. Tian and Y. Lv, “Graphene Sheets Decorated with SnO2 NanoParticles: In Situ Synthesis and Highly Efficient Materials for Catalu- minescence Gas Sensors,” Journal of Materials Chemis- try, Vol. 21, No. 16, 2011, pp. 5972-5977. doi:10.1039/c0jm04331a [18] A. Shimizu and K. Fujii, “Thin Film Gas Sensor,” Japan Kokai Tokyo Koho, 2011, JP 2011169634 A 20110901. [19] G. Lu, S. Park, K. Yu, R. S. Ruoff, L. E. Ocola, D. Ro- senmann and J. Chen, “Toward P with Highly Reduced Graphene ractical Gas Sensing Oxide: A New Signal Processing Method to Circumvent Run-to-Run and De- vice-to-Device Variations,” ACS Nano, Vol. 5, No. 2, 2011, pp. 1154-1164. doi:10.1021/nn102803q , Vol. 77, No. 12, Copyright © 2013 SciRes. Graphene  J. H. SON, T. R. RYBOLT 33 [20] G. Lu, L. E. Ocola and J. Chen, “Gas De Low-Temperature Reduced Gra tection Using phene Oxide Sheets,” Ap- plied Physics Letters, Vol. 94, No. 8, 2009, Article ID: 083111. doi:10.1063/1.3086896 [21] T. R. Rybolt, C. E. Wells, C. R. Sisson, C. B. Black and K. A. Ziegler, “Evaluation of Molecular Mechanics Cal- culated Binding Energies for Isolated and Mono ganic Molecules on Graphite layer Or- ,” Journal of Colloid and Interface Science, Vol. 314, No. 2, 2007, pp. 434-445. doi:10.1016/j.jcis.2007.05.083 [22] T. R. Rybolt, K. A. Ziegler, H. E. Thomas, J. L. Boyd and M. E. Ridgeway, “Adsorption Energies for a Nanoporous Carbon from Gas-Solid Chromatography an Mechanics,” Journal of C d Molecular olloid and Interface Science , Vol. 296, No. 1, 2006, pp. 41-50. doi:10.1016/j.jcis.2005.08.057 [23] T. R. Rybolt and R. A. Hansel, “Determining Molecule- Carbon Surface Adsorption Energies Using Molecular Mechanics and Graphene Nanostructures,” Journal of Colloid and Interface Science, Vol. 300, No. 2, 2006, pp. 805-808. doi:10.1016/j.jcis.2006.04.057 [24] T. R. Rybolt, C. E. Wells, H. E. Thomas, C. M. Goodwin, J. L. Blakely and J. D. Turner, “Binding Energies for Al- kane Molecules on a Carbon Surface from Gas-Solid Chromatography and Molecular Mechanics,” Journal of Colloid and Interface Science, Vol. 325, No. 1, 2008, pp. 282-286. doi:10.1016/j.jcis.2008.06.043 [25] T. R. Rybolt, K. T. Bivona, H. E. Thomas and C. M. O’Dell, “Comparison of Gas-Solid Chromatography and MM2 Force Field Molecular Binding Energies for Green- house Gases on a Carbonaceous Surface,” Journal of Col- loid and Interface Science, Vol. 338, No. 1, 2009, pp. 287- 292. doi:10.1016/j.jcis.2009.06.001 [26] N. L. Allinger, “Conformational Analysis. 130. MM2. A Hydrocarbon Force Field Utilizing V1 and V2 Torsional Terms,” Journal of the American Chemical Society, Vol. 99, No. 25, 1977, pp. 8127-8134. doi:10.1021/ja00467a001 [27] J. Lii and N. L. Allinger, “Molecular Mechanics. The MM3 Force Field for Hydrocarbons. 3. The van der Waals’ Potentials and Crystal Data for Aliphatic and Aro- matic Hydrocarbons,” Journal of the American Chemical Society, Vol. 111, No. 23, 1989, pp. 8576-8582. doi:10.1021/ja00205a003 [28] F. Jensen, “Introduction to Computational Chemistry,” John Wiley & Sons, Chichester, 1999. [29] E. V. Kalashnikova, A. V. Kiselev, A. M. Makogon and K. D. Shcherbakova, “Adsorption of Molecules of Dif- ferent Structure on Graphitized Thermal Carbon Black IV. Gas Chromatographic Investigation of Adsorption of Al- dehydes, Ketones and Alcohols on Hydrogen-Treated Graphitized Thermal Carbon Black,” Chromatographia, Vol. 8, No. 8, 1975, pp. 399-403. doi:10.1007/BF02269088 [30] C. Vidal-Madjar, M. F. Gonnord and G. Guiochon, “Mo- )90306-9 lecular Statistical Theory of Adsorption Prediction of the Thermodynamical Functions of Adsorption of Hydrocar- bons on Graphitized Thermal Carbon Black,” Journal of Colloid and Interface Science, Vol. 52, No. 1, 1975, pp. 102-119. doi:10.1016/0021-9797(75 , A. E. Pilt, S. A. Rang and K. [31] O. G. Eisen, A. V. Kiselev D. Shcherbakova, “Gas Chromatographic Investigation of Adsorption of Normal Alkenes C6 - C10 on Graphitized Thermal Carbon Black,” Chromatographia, Vol. 4, No. 10, 1971, pp. 448-454. doi:10.1007/BF02268813 [32] A. V. Kiselev, E. B. Polotnyuk and K. D. Shcher “Gas Chromatographic Stu bakova, dy of Adsorption of Nitrogen- . 14, No. 8, 1981, Containing Organic Compounds on Graphitized Thermal Carbon Black,” Chromatographia, Vol pp. 478-483. doi:10.1007/BF02263538 [33] S. N. Yashkin, O. B. Grior’eva and A. K. Buryak, “Ex- perimental and Molecular-Statistical Investigation of Ad- sorption of Aminoadamantanes on Graphitized Thermal Carbon Black,” Russian Chemical Bulletin, Vol. 50, No. 6, 2001, pp. 980-985. doi:10.1023/A:1011348730899 [34] S. N. Yashkin, D. A. Svetlov and modynamic Characteristic A. K. Buryak, “Ther- s of Adsorption of Nitrogen- Containing Heterocycles on Graphitized Thermal Carbon Black Derived from Molecular Statistical Calculation. 1. Azines,” Russian Chemical Bulletin, Vol. 52, No. 2, 2003, pp. 344-353. doi:10.1023/A:1023446513475 [35] E. G. Bychkova, E. V. Kalashnikova, A. V. Kiselev and K. D. Shcherbakova, “Thermodynamic Characteristics of , K. D. 12, No. 12, 1979, Adsorption of the Naphthalene-Type Hydrocarbons on the Graphitized Thermal Carbon Black,” Vestnik Mosk- ovskogo Universiteta, Seriya 2: Khimiya, Vol. 27, No. 4, 1986, pp. 382-385. [36] E. V. Kalashnikova, A. V. Kiselev, R. S. Petrova Shcherbakova and D. P. Poshkus, “Chromatographic Meas- urements and Molecular Statistical Calculations of Ther- modynamic Characteristics of Adsorption of Aromatic and Polycyclic Hydrocarbons on Graphitized Thermal Carbon Black,” Chromatographia, Vol. pp. 799-802. doi:10.1007/BF02260661 [37] E. V. Kalashnikova, A. V. Kiselev and K. D. Shcherba- kova, “Retention of Some Phenyl-Substituted and Bicy- clic Hydrocarbons on Graphitized Carbon Black,” Chro- matographia, Vol. 17, No. 10, 1983, pp. 521-525. doi:10.1007/BF02261913 [38] A. V. Kiselev, V. I. Nazarova and K. D. Shcherbakova, “Molecular Structure and Retention Behaviour of Some Polycyclic Aromatic and Perhydroaromatic Hydrocarbons on Graphitized Carbon Black,” Chromatographia, Vol. 18, No. 4, 1984, pp. 183-189. doi:10.1007/BF02276730 [39] E. V. Kalashnikova, A. V. Kiselev, K. D. Shcherbakova and S. D. Vasileva, “Retention of Diphenyls, Terphenyls, Phenylalkanes and Fluorene on Graphitized Thermal Car- bon Black,” Chromatographia, Vol.14, No. 9, 1981, pp. 510-514. doi:10.1007/BF02265630 [40] A. K. Buryak, P. B. Dallakyan and A. V. Kiselev, “De- . Kiselev, “Corre- lation between the Structure of Chlorinated Biphenyls and termination of Atom-Atom Potentials of Intermolecular Interaction and Calculation of the Thermodynamic Char- acteristics of Adsorption on Graphite of Sulfur- and Chlorine-Containing Organic Compounds,” Doklady Aka- demii Nauk SSSR Physical Chemistry, Vol. 282, No. 2,1985, pp. 350-353. [41] A. K. Buryak, A. N. Fedotov and A. V Copyright © 2013 SciRes. Graphene  J. H. SON, T. R. RYBOLT Copyright © 2013 SciRes. Graphene 34 . S and A. L. Shilov, “Gas Their Adsorption on Graphitized Thermal Carbon Black,” Vestnik Moskovskogo Universiteta, Seriya 2: Khimiya, Vol. 26, No. 6, 1985, pp. 568-571. [42] W. Engewald, E. V. Kalashnikova, A. V. Kiselev, R Petrova, K. D. Shcherbakova . Chromatographic Investigation of the Adsorption of Po- lymethylcyclohexanes on Graphitized Thermal Carbon Black,” Journal of Chromatography A, Vol. 152, No. 2, 1978, pp. 453-466. doi:10.1016/S0021-9673(00)85082-7 [43] T. R. Rybolt and C. E. Wells, “Molecule-Surface Binding Energies from Molecular Mechanics: Nucleobases on Graphene,” In: H. E. Chan, Ed., Graphene and Graphite Materials, Nova Science Publishers, New York, 2009, pp. 95-112. [44] C. Thierfelder, M. Witte, S. Blankenburg, E. Rauls and W. G. Schmidt, “Methane Adsorption on Graphene from First Principles Including Dispersion Interaction,” Surface Sci- ence, Vol. 605, No. 7-8, 2011, pp. 746-749. doi:10.1016/j.susc.2011.01.012 [45] O. Engkvist, P. Astrand and G. Karlstrom, “Accurate Intermolecular Potentials Obtained from Molecular Wave Functions: Bridging the Gap between Quantum Chemis- try and Molecular Simulations,” Chemical Reviews, Vol. 100, No. 11, 2000, pp. 4087-4108. doi:10.1021/cr9900477 [46] Y. Zhao and D. G. Truhlar, “Density Functionals for Noncovalent Interaction Energies of Biological Impor- tance,” Journal of Chemical Theory and Computation, Vol. 3, No. 1, 2007, pp. 289-300. doi:10.1021/ct6002719 [47] R. Zacharia, H. Ulbricht and T. Hertel, “Interlayer Cohe- sive Energy of Graphite from Thermal Desorption of Po- lyaromatic Hydrocarbons,” Physical Review B, Vol. 69, No. 15, 2004, Article ID: 155406. doi:10.1103/PhysRevB.69.155406 [48] H. Ruuska and T. A. Pakkanen, “Ab layer Interaction of Grap Initio Study of Inter- hite: Benzene-Coronene and Co- ronene Dimer Two-layer Models,” Journal of Physical Chemistry B, Vol. 105, No. 39, 2001, pp. 9541-9547. doi:10.1021/jp011512i [49] T. P. Tauer and C. D. Sherrill, “Bey mer: An Investigation ond the Benzene Di- of the Additivity of π-π Interac- tions,” Journal of Physical Chemistry A, Vol. 109, No. 46, 2005, pp. 10475-10478. doi:10.1021/jp0553479
|