Health
Vol.4 No.12A(2012), Article ID:26140,10 pages DOI:10.4236/health.2012.412A226
Obesity-associated steatotic liver exhibits aberrant or altered sphingolipid composition and preferentially accumulates ceramide species containing long chain fatty acids
![]()
1Department of Biology, University of Waterloo, Waterloo, Canada
2Department of Biological Sciences, University of Windsor, Windsor, Canada; *Corresponding Author: rpbird@uwindsor.ca
Received 14 November 2012; revised 15 December 2012; accepted 24 December 2012
Keywords: Sphingolipids; Obesity; Zucker Obese Rats; Apoptosis; Hepatic Steatosis
ABSTRACT
The sphingolipid (SL) signaling pathways are induced by reactive oxygen species and proinflammatory molecules, which are shown to be up-regulated in the obese state. The present work was conducted to determine if an altered SL pathway exists, and contributes to the pathogenesis of hepatic steatosis associated with obesity. Steatotic and non-steatotic livers were procured from Zucker Obese female rats and their lean counterparts in this pre-clinical study, and assessed for enzymes involved in degradation as well as in phosphorylation of pro-apoptotic SLs. The expression of enzymes [sphingomyelinase (SMase), ceramidase, and sphingosine kinase-1 (SK1)] and apoptotic proteins (Bax and Bcl-2) was quantified by ELISA and by Western Blot. Sphingomyelin (SM), ceramide, ceramide-1 phosphate (C1P), sphingosine (SPH), and sphingosine-1-phosphate (S1P) levels were quantified by high-performance liquid chroma-tography (HPLC)-tandem mass spectroscopy (MS). Obese steatotic livers exhibited significantly upregulated ceramidase and down-regulated SK1 and C1P levels (P < 0.05), as well as significantly lower levels of SM and higher levels of ceramide species containing long chain fatty acids, compared to their lean counterparts. These findings demonstrate that obese liver harbours SLs that favour a proapoptotic environment. Moreover, accumulation of ceramides containing long chain fatty acids could be involved in the pathogenesis of hepatic steatosis.
1. INTRODUCTION
Sphingolipids (SLs) are important components of biological membranes and play a prominent role in cell signaling. The up-regulation of SLs by various factors mediates specific cell responses that range from proliferation to growth arrest, apoptosis, differentiation or recognition [1]. Ceramide functions as a key player in cell signaling and as a precursor for other SLs [2]. Some SLs, such as ceramide and sphingosine-1-phosphate (S1P), exert opposing effects in the regulation of apoptosis and survival, and are key molecules for determining the fate of cells in response to specific stimuli [3].
Sphingomyelin (SM) on the plasma membrane is the primary SL source for biologically active ceramide in the vast majority of cells [4]. Sphingomyelinase (SMase), with its phospholipase C activity, initiates ceramide-activated apoptogenic signaling by hydrolyzing the phosphodiester bond of SMs [2,4]. Although three isoforms of SMase have been identified, two of these enzymes, the lysosomal phosphodiesterase acid SMase (A-SMase) and the membrane-bound neutral SMase (N-SMase), contribute substantially to apoptosis triggered by death receptors [5,6]. Ceramides are further hydrolyzed to generate sphingosine (SPH), which is phosphorylated by Sphingosine kinase (SK) to form S1P. Ceramide, SPH, and S1P are all active signaling molecules and mediate cell proliferation, differentiation, apoptosis, adhesion, and migration [1,7].
Obesity is a chronic disease characterized by an increase in body fat stores. Due to its prevalence, obesity is currently the most common metabolic disease in the world [8]. The impact of the SL pathway is an important area of study in obesity research as it may be altered in the obese state, thus affecting the cell proliferation/ death balance and contributing to the increased pathogenesis of various diseases, including cancer and cardiovascular disease. A previous study compared adipose tissue from lean and obese mice, and showed an overall decrease in SM and increased ceramide levels in obese mice compared to lean, with an associated increase in SPH, N-SMase, and A-SMase. In addition, the plasma of obese mice showed increased levels of SM, ceramide, SPH, and S1P that contributed to the pro-inflammatory phenotype of obese adipose tissue [9].
Obesity induces a chronic state of inflammation and is associated with metabolic syndrome-X, hyperlipidemia, diabetes, and hepatic steatosis [10-12]. The livers of obese rats exhibit increased levels of pro-inflammatory cytokines, so one could speculate that SL signaling will be altered in the steatotic liver. In the present study, we examined pro-apoptotic SL levels in Zucker obese and lean rats. Zucker obese rats exhibit many of the symptoms normally associated with the obese state in humans, including (but not limited to) hyperlipidemia, hyperinsulinemia, and liver steatosis [13-19]. We hypothesized that obese liver tissue will contain higher levels of proapoptotic SLs than lean liver. The most important finding of the present study is significantly higher levels of ceramides containing long chain fatty acids, and lower levels of anti-apoptotic proteins in steatotic liver from obese animals than in lean liver tissue.
2. MATERIALS AND METHODS
2.1. Animals
Five-week-old female obese (fa/fa) rats (n = 14) and their lean (Fa/Fa) counterparts (n = 12) were obtained from Charles River Laboratories (Wilmington, MA, USA). They were housed in the animal housing facility in wire cages suspended approximately 10 cm above sawdust bedding trays with a 12-h light/12-h dark cycle. Temperature and relative humidity were controlled at 22˚C and 55%, respectively. All animals were acclimatized to these conditions for one week with free access to standard laboratory rodent chow and drinking water until initiation of the experiment. All animals were cared for according to the guidelines of the Canadian Council on Animal Care, and the protocol was approved by the University of Waterloo Animal Care Committee.
2.2. Diet, Body Weights, Termination
After acclimatization, the rats were fed synthetic diet AIN93 ad libitum for nine weeks, and were then weighed and terminated by CO2 asphyxiation. Following termination, gross anatomy was observed and any pathological abnormalities were recorded. Weights of liver, kidney, spleen, and heart tissues were recorded, and the samples were frozen at −80˚C for biochemical analyses.
2.3. Sphingomyelinase Assay
The activity of N-SMases and A-SMases in liver was measured using the Amplex Red Sphingomyelinase Assay Kit (Molecular Probes, Eugene, OR) as per the manufacturer’s protocol. The activity of N-SMase was analyzed using 250 μg of protein from liver tissue. The enzymatic activity was measured as fluorescence using excitation of 545 ± 10 nm and emission detection of 590 ± 10 nm.
2.4. Protein Homogenate Preparation and Western Blotting
Tissues were mixed with 2 mL of ice-cold RIPA buffer (50 mM Tris-HCl, 1% NP-40, 0.25% Sodium deoxycholate, 150 mM NaCl, 1 mM EDTA, 1 mM NaF) with freshly added protease inhibitors (1 μg/mL of Aprotinin, Leupeptin, Trypsin Inhibitor, Sodium Orthovandate) and then homogenized on ice using a PT2100 Polytron homogenizer.
The following antibodies were acquired commercially to quantify expression of SK1, ceramidase, Bax and Bcl-2: 1) Rabbit polyclonal to SK1 in rat, human and mouse (Abgent Inc., San Diego, CA, USA; catalogue # AP7237c); 2) Goat polyclonal to ceramidase in rat, human and mouse (Santa Cruz Biotechnologies, Santa Cruz, CA, USA; catalogue # sc-28486); 3) Rabbit polyclonal to Bax and Bcl-2 in rat, human and mouse (Abcam Inc., Cambridge, MA, USA; catalogue #s ab7977 and ab7973, respectively); 4) Bovine Anti-goat IgG-HRP (Santa Cruz Biotechnologies, Santa Cruz, CA, USA; catalogue # sc-23500); 5) Goat Anti-rabbit IgG-HRP (Cell Signaling Technology Inc., Boston, MA, USA; catalogue # 7074).
The protein samples (50 μg) were subjected to 10% sodium dodecyl sulphate-polyacrylamide gel electrophoresis (SDS-PAGE) using the Mini-Protean-BioRad II apparatus (Bio-Rad Laboratories Ltd, Carlsbad, CA, USA) to quantify the proteins of interest [18,19], with the exception of SK, which required 100 μg of protein from liver samples. The protein samples were loaded into the wells with Laemmli buffer (Sigma Chemical) and separated by SDS-PAGE at 120 V for 90 min. Proteins were transferred from gels onto methanol soaked 0.45 μm PVDF membranes (Pall Corp. FL, USA.) The Trans-Blot Semi-Dry transfer cell system (Bio-Rad Laboratories Ltd, Carlsbad, CA, USA) at 20 V for 30 min was used for SK1 immunoblots. For all other blots, transfer was completed using the Mini-Trans-Blot Electrophoretic Transfer Cell (Bio-Rad Laboratories Ltd, Canada) at 100 V for 60 min. The gels were stained with Coomassie Brilliant Blue to confirm proper transfer.
After incubation in respective primary antibodies, all immunoblots were washed three times with Tris-Buffered Saline with Tween 20 (TBS-T) solution and then incubated with peroxidase conjugated secondary antibodies in a 1% blocking solution for 1.5 h. After washing three times in TBS-T, the blots were incubated for five minutes with ECL plus (Amersham Biosciences Canada, GE Healthcare Bio-Sciences Inc., Quebec, Canada) and developed using X-ray film (Fisher Scientific Company, Ottawa, ON, Canada). Finally, densitometric analysis was conducted using AlphaEaseFC software. The membranes were stained with Ponceau-S to confirm equal loading and were used to normalize the integrated density values for quantification. Densitometry analysis was performed using a Visible Imaging System equipped with AlphaEaseFC software (Alpha Innotech, San Leandro, CA). The blots for liver samples were washed in TBS-T and re-probed with beta-actin as a secondary control for equal loading.
2.5. Sphingolipid Quantitative Analysis by HPLC and MS
SM, ceramide, ceramide-1 phosphate, SPH and S1P were analyzed by high-performance liquid chromatography (HPLC)-tandem mass spectroscopy (MS) in the lab of Dr. J Beilawski (Lipidomic Core, Medical University of South Carolina, Charleston, SC) as described previously [20]. Briefly, 0.5 grams of each liver sample was homogenized in tissue buffer and fortified with internal standards, 17-sphingosine, 17-S1P, 18C17-SM and 17C 16-ceramide. Protein concentration was determined in each sample (Bio-Rad Protein Assay) and then SLs were extracted using a solution of iso-propanol: water: ethyl acetate (30:10:60). Samples were centrifuged for 10 min at 4000 rpm and supernatants collected. Organic extracts were evaporated under N2 gas and were reconstituted in methanol containing 0.2% formic acid. Samples were then analyzed using TSQ 7000 LC/MS system. Quantitative analysis is based on calibration curves generated by spiking bovine serum albumin with known amounts of target synthetic standards and an equal amount of internal standard. The calibration curves are generated by plotting the peak area ratios of SL to the respective internal standards against concentration using a linear regression model.
2.6. Statistical Analysis
Statistical analysis of the data was performed using SPSS statistical software (SPSS Inc., Chicago, IL, USA). A comparison between lean and obese groups was performed and differences were determined using the independent samples t-test, at a significance level of P < 0.05. Statistical analysis between tissue types was determined using the paired samples t-test at a significance level of P < 0.05.
3. RESULTS
3.1. Body Weight and Total Liver Lipid Were Higher in the Obese State
Body mass of obese rats (552.83 ± 15.43 g) was significantly higher (P < 0.05) than the body mass of their lean counterparts (269.75 ± 6.27 g) after termination at 9 weeks of age. Livers from obese rats were significantly larger than the lean livers. Furthermore, obese liver tissue appeared pale and creamy colored in comparison to the darker red of the lean livers. The morphology of the obese liver showed more lipid accumulation than the lean rats’ liver tissue.
3.2. Ceramidase and Bax Levels Were Higher and Bcl2 Levels Were Lower in Obese Liver
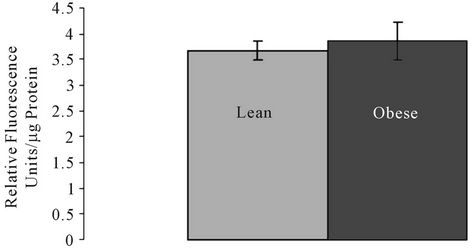
SMase, ceramidase, and Bcl2 and Bax proteins were quantified. There were no significant differences in the Aand N-SMase levels in lean and obese liver tissue (Figures 1(a) and (b)). However, ceramidase protein expression was significantly higher in obese liver tissue compared to the liver tissue of lean animals (Figure 2(a)). Ceramidase bands were observed at a band size of 55 kDa for both lean and obese liver tissue, which is consistent with the ceramidase 55 kDa precursor protein (Figure 2(c)). SK bands were observed at the predicted
 (a)
(a)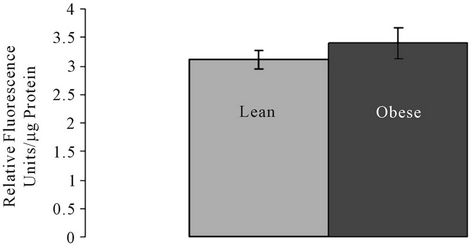 (b)
(b)
Figure 1. (a) Acidic sphingomyelinase (A-SMase) and (b) Neutral sphingomyelinase (N-SMase) activity in lean and obese liver tissue.
band size of 43 kDa for both lean and obese liver tissue. A second band appeared just below the 43 kDa mark in obese liver tissue that was not observed in lean tissue (Figure 2(c)). SK1 protein expression was significantly higher in lean liver tissue compared to obese tissue (Figure 2(b)).
The Bcl-2 band was observed at the predicted band size of 30 kDa for both lean and obese liver tissue (Figure 2(c)). Lean liver tissue had higher Bcl-2 levels than obese liver tissue (Figure 2(d)). Bax bands were observed at the predicted band size of 21 kDa for both lean and obese liver tissue. A faint band also appeared at the 42 kDa mark; according to antibody specifications, this band represented Bax homodimers (Figure 2(c)). Bax protein expression was significantly higher in obese liver tissue compared to lean (Figure 2(e)).
3.3. Lower Levels of SMs Containing Long Chain Fatty Acids Are Present in Obese than in Lean Liver Tissue
LC-MS (liquid chromatography-mass spectroscopy) analysis revealed that levels of various species of SMs were altered in obese liver tissue compared to lean. SM species differ in the number of carbons and number of double bonds in their fatty acid chain. C16-SM was significantly higher in obese liver while SM species containing chain lengths of C22-C26 were lower in obese liver (Figure 3(a)) compared to lean tissue. Other SM species (i.e., C14-, C18-, C18:1-, C20-, C20:1- and C24: 1-SM) did not differ significantly for the obese and lean groups (Supplementary Table 1). Calculation of total SM showed lower SM content in obese than in lean liver tissue (Figure 3(b)).
3.4. Levels of Total Ceramide and Selected Long Chain Fatty Acid Ceramide Species Are Higher in Obese Liver Tissue
LC-MS analysis shows that various ceramide species were significantly altered in obese liver tissue compared to lean. Similarly to SM, ceramide species differ in the number of carbons and number of double bonds in their fatty acid chain. C16-ceramide was significantly lower in obese tissue, while C22-, C24:1-, C18-, C20- and C24: 0- ceramide levels were significantly higher in obese than in lean liver (Figure 4(a)). Total ceramide content was
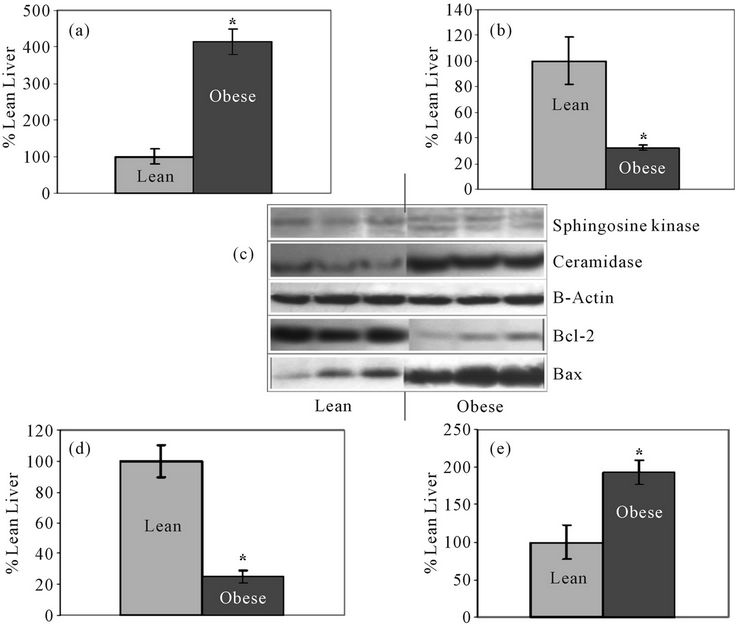
Figure 2. Bar graphs represent mean levels of: (a) ceramidase; (b) Sphingosine kinase (SK); (d) Bcl-2; and (e) Bax in lean and obese liver. Panel C: Western Blot for SK, ceramidase, Bcl-2, and Bax in lean and obese liver with 3 representative bands from each group shown with β-actin control bands. All bands were normalized to their respective ponceau stained bands; *Significantly different from lean group (P < 0.05; N = 6).

Figure 3. (a) C16, C22, C22:1, C24, C26 and C26:1 sphingomyelin (SM) levels in lean and obese liver tissue; (b) Total SM content in lean and obese liver tissue. SM levels are shown in pmole/mg protein ± SEM. N = 5 per group *Significantly different from lean group (P < 0.05).
higher in obese liver compared to lean liver, but differences were not statistically significant (Figure 4(b)).
3.5. Total Ceramide 1-Phosphate (C1P) Is Lower in Obese than in Lean Liver
LC-MS analysis of C1P containing different lengths of fatty acid chains showed that C18- and C18:1-C1P levels were significantly lower in obese liver (Figures 5(a) and (b)). C16-C1P was also lower in obese tissue, although not significantly. Levels of other C1P species were below the detection limit. Total C1P was significantly lower in obese than in lean liver tissue (Figure 5(c)).
3.6. SPH Level Is Higher in Obese than in Lean Liver Tissue
LC-MS analysis shows that SPH is higher in obese liver compared to lean, although the two groups do not differ significantly for this sample size (n = 5 per group) (Figure 5(d)). S1P levels were below the detection level of LC-MS analysis in liver (Table 1). Protein samples (1 mg) were analyzed using the TSQ 7000 LC/MS system. S1P was undetectable in all samples suggesting that S1P must exist at very low levels in the tissue compared to other SLs, which were detectable in samples containing 1 mg of protein. The collective findings for SM and ceramide species are summarized in Figure 6.
4. DISCUSSION
This study was undertaken to determine if the SL pathway is altered in the obese state. We hypothesized that the pro-inflammatory environment of the steatotic liver would result in an up-regulation of the SL signaling path-
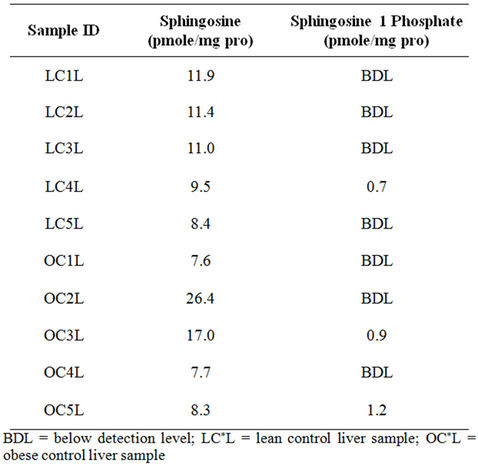
Table 1. Raw data quantification values for sphingosine and S1P in lean and obese liver.
way, thus favouring a pro-apoptotic environment. Quantifying SLs, as well as the key SL enzymes, did show notable differences in the SL pathway between obese and lean liver. Enzymes, such as SMases and ceramidase, which result in pro-apoptotic ceramides and SPHs, were elevated in obese liver tissue. Steatotic liver also exhibited the accumulation of ceramides containing long chain fatty acids.
The liver is a complex and multi-functional organ, and liver disease is commonly linked to obesity. Zucker obese rats exhibit hepatic steatosis [21,17]; this may be attributed to insulin resistance and increased release of
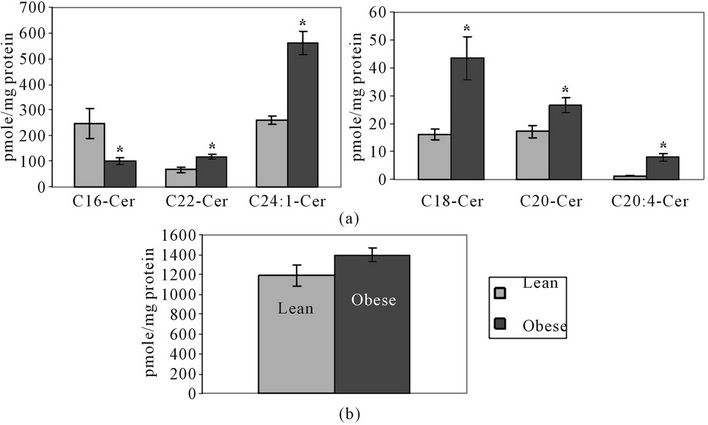
Figure 4. (a) C16, C18, C20, C20:4, C22 and C24:1 ceramide levels in obese and lean liver tissue; (b) Total ceramide content in lean and obese liver tissue. Ceramide levels are shown in pmole/mg protein ± SEM. N = 5 per group *Significantly different from lean group (P < 0.05).
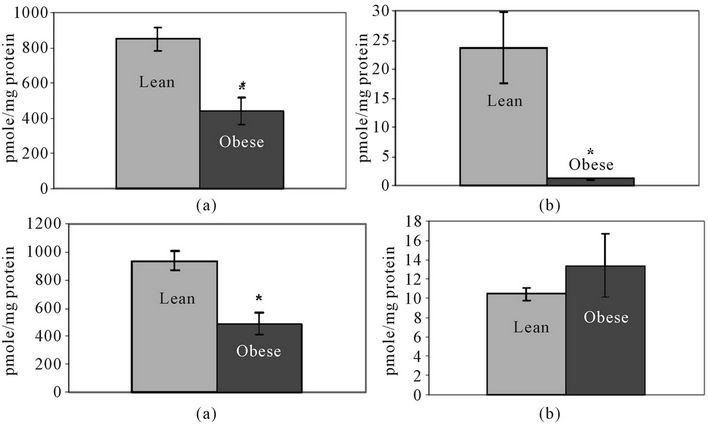
Figure 5. Lean and obese liver tissue levels of: (a) C18-ceramide-1-phosphate; (b) C18:1- Ceramide-1-Phosphate; (c) Total Ceramide-1-Phosphate; and (d) Sphingosine (SPH). Levels are shown in pmole/mg protein ± SEM. N = 5 per group *Significantly different from lean group (P < 0.05).
free fatty acids from adipose tissue [22]. In addition, hepatic steatosis is linked to oxidative stress and inflammation; both reactive oxygen species and inflammatory molecules have been reported as being present in higher levels in the obese state [23,24]. Previously, it was reported that the SL signaling pathway is activated under conditions of cellular stress, including induction of SMase by TNF-α, IL-1β, free fatty acids, and ROS [1,25, 26].
When SMase activity in obese and lean liver tissue was compared, there was a trend toward a higher level of SMase in obese liver tissue. While both Nand A-SMase activity were consistently found to be slightly higher in obese tissue compared to lean, the differences were not significant in all repetitions of the assay. This could be due to the fact that the animals in this study were not exposed to an environment extreme enough to significantly activate SMase. It is possible that the level of inflammation associated with obesity exerts a moderate, but consistent effect on SMases; if so, the variance associated with the small sample size in the current study might have masked the effect. LC-MS quantification of
 (a) (b)
Figure 6. Sphingomyelin (SM) and ceramide species composition in lean versus obese liver tissue: (a) SM species levels are shown as a percentage of total SM content in this stacked graph; (b) Ceramide species levels are shown as a percentage of total ceramide content in this stacked graph; *Significantly different from lean group (P < 0.05; N = 5).
SM showed a trend towards lower SM levels in obese liver tissue compared to lean. When individual SM species varying in fatty acid composition were compared, the levels of SM species containing very long chain fatty acids were lower in obese liver than in lean liver, suggesting that the longer chain SMs are preferentially hydrolyzed to ceramide by activated SMase in obese tissue. Only one SM species, C16-SM, was found to be higher in obese than in lean liver tissue. The possibility that long chain SMs are preferentially hydrolyzed into ceramide was supported by the fact that total ceramides, as well as levels of ceramides containing long chain fatty acids, were higher in obese liver compared to lean liver.
The SL pathway is constantly undergoing synthesis and degradation. While SM hydrolysis may be occurring, SM synthesis can also be taking place within the cells, resulting in SM regeneration; perhaps certain species of SM are generated more frequently. The trend toward lower SM in obese liver supports the finding of a recent study in which SM was lower in the livers of obese mice compared to their lean counterparts [27].
The production and accumulation of ceramides are important for generating an apoptotic signal within the cell. The trend toward higher ceramide levels and altered ceramide species in obese tissue may contribute to the pathogenesis of the steatotic liver. Of course, other SL molecules in the signaling pathway must be examined as well, so as to determine the overall balance in signaling molecules. Ceramide, once generated, can have many fates within a cell; for example, it can be converted back to SM, deacetylated to SPH, or phosphorylated by ceramide kinase to form C1P. Quantification of C1P showed that total C1P, as well as levels of C18- and C18:1-C1P species, were significantly lower in obese liver (Figure 5). All of the longer chain species of C1P fell below the detection level. Normally, C1P opposes apoptotic ceramide activity. An overall depression in the amount of C1P indicates that obese liver cells are receiving less stimulation for survival and proliferation processes.
Ceramide can also be prevented from accumulating in the cell via conversion to SPH. Ceramidase deacetylates ceramide, producing SPH. When this enzyme was analyzed by Western Blot, ceramidase expression was found to be significantly higher in obese than lean liver. In liver tissue, ceramidase bands were observed at a size of 55 kDa, consistent with the expected size of a ceramidase precursor protein; ceramidase is synthesized as a 55 kDa lysosomal protein. Little is known about inducers of ceramidase, however, it has been suggested that platelet derived growth factor (PDGF) and insulin-like growth factor (IGF) can activate ceramidase, leading to SPH production [28].
Ceramidase overexpression in obese liver tissue may indicate that the tissue is trying to compensate for high ceramide levels in the active SL pathway. Ceramidase may play a protective role by converting ceramide to SPH. While SPH is considered to be an apoptotic signaling molecule like ceramide, it is also the necessary substrate for SK1 and the production of S1P. Thus SPH is an important intermediary, signaling for apoptosis while also being readily available for conversion to a mitogenic signaling molecule. In fact, a study examining the role of ceramide in apoptosis reported that overexpression of acid ceramidase protected cells from TNF-α-induced apoptosis, demonstrating that ceramidase expression may help to shift the balance between intracellular ceramide and S1P levels towards cell survival [29].
LC-MS analysis of SPH revealed that there is a trend towards up-regulation of SPH in obese tissue, although the results for lean and obese rats do not differ significantly. Though SPH is a bioactive lipid that is itself, capable of apoptotic signals, it can be converted back to ceramide via ceramide synthase, or it can be phosphorylated to S1P by SK1. In contrast to SMase and ceramidase, SK1 expression was lower in obese liver by approximately 60%. SK1 phosphorylates SPH to produce S1P, an important mediator of cell growth and differentiation. The reduced expression of SK1 in steatotic liver tissue indicates lower levels of S1P being produced, and this further validates the idea that in hepatic steatotic tissue there is a shift towards apoptosis, which is induced by the change in balance between SL signaling enzymes.
LC-MS analysis of S1P showed that S1P levels were below the detection level, meaning that the levels of S1P for most samples were below 0.1 pmole/mg protein. S1P is normally present at very low levels in vivo. Sphingosine-1-phosphatase (S1Pase) can remove the phosphate, and regenerate SPH or sphingosine-1-phosphate lyase (SPL) can act to degrade S1P irreversibly. Together, these two enzymes control S1P levels. Also, in mice and rats, SPL expression and activity appear to be highest in the small intestine, colon, thymus and liver, thus contributing to low levels of S1P [30]. The low levels of S1P will increase only when SK1 is up-regulated, induced by a diverse number of growth stimuli, including PDGF [31, 32]. Since it is clear in obese liver tissue that SK1 is down-regulated, S1P levels would remain at a very low level.
The regulation of pro-apoptotic and anti-apoptotic signals is complex and involves many molecules. For the purpose of this study, it is apparent that compared to lean liver tissue, steatotic obese liver tissue appears to have increased SMase activity and lower levels of SMs containing long chain fatty acids, accompanied by increased levels of ceramide containing long chain fatty acids. Ceramidase, a pro-apoptotic protein that hydrolyzes ceramide to SPH, is elevated in obese liver tissue whereas the enzyme, SK1, is elevated in lean relative to obese liver tissue. SK converts pro-apoptotic SPH to anti-apoptotic S1P. A rise in ceramide levels will mediate apoptosis through Protein Phosphatase 2a (PP2a). PP2a can activate pro-apoptotic Bax through dephosphorylation, leading to membrane permeation and subsequent cytochrome C release and apoptosis [33]. Furthermore, ceramide has been implicated in the down-regulation of anti-apoptotic Bcl-2. Bcl-2 binds to Bax, and prevents Bax from initiating apoptosis at the mitochondrial membrane. PP2a may also play a role in ceramide induction of Bcl-2. PP2a activated by ceramide can dephosphorylate Bcl-2, rendering it inactive as an anti-apoptotic protein [34]. Analysis of Bax and Bcl-2 proteins by Western Blot showed that both are altered in obese liver tissue. Densitometric analysis of the 21 kDa bands consistent for Bax [35] showed that Bax is up-regulated in obese tissue by approximately 100% compared to lean tissue. Analysis of Bcl-2 demonstrated that Bcl-2 protein expression is approximately 75% lower in obese tissue (Figure 2(c)).
These findings further support the contention that steatotic liver is associated with a pro-apoptotic environment. Increased expression of death receptors in obese liver tissue sensitizes these cells to pro-apoptotic stimuli, thereby triggering excessive hepatocyte apoptosis and inflammation [36]. The key molecules analysed in this study, and the altered levels in obese liver tissue compared to lean, are summarized in Figure 6. Briefly, the findings of the present study demonstrate that downstream effecttor proteins of the SL signaling pathway are altered in the livers of obese rats. Most importantly, increased levels of ceramides containing long chain fatty acids appear to play a major role in the genesis of steatotic liver.
5. ACKNOWLEDGEMENTS
The authors wish to thank Dr. EM Munn for expert assistance with the manuscript preparation.
REFERENCES
- Kolesnick, R. (2002) The therapeutic potential of modulating the ceramide/sphingomyelin pathway. Journal of Clinical Investigation, 110, 3-8. doi:10.1172/JCI200216127
- Merrill Jr., A.H. (2002) De novo sphingolipid biosynthesis: A necessary, but dangerous, pathway. Journal of Biological Chemistry, 277, 25843-25846. doi:10.1074/jbc.R200009200
- Ogretmen, B. and Hannun, Y.A. (2004) Biologically active sphingolipids in cancer pathogenesis and treatment. Nature Reviews Cancer, 4, 604-616. doi:10.1038/nrc1411
- Marchesini, N. and Hannun, Y.A. (2004) Acid and neutral sphingomyelinases: Roles and mechanisms of regulation. Biochemistry and Cell Biology, 82, 27-44. doi:10.1139/o03-091
- Levade, T. and Jaffrezou, J.P. (1999) Signalling sphingomyelinases: which, where, how and why? Biochimica et Biophysica Acta—Molecular and Cell Biology of Lipids, 1438, 1-17. doi:10.1016/S1388-1981(99)00038-4
- Perry, D.K. and Hannun, Y.A. (1998) The role of ceramide in cell signaling. Biochimica et Biophysica Acta—Molecular and Cell Biology of Lipids, 1436, 233-243. doi:10.1016/S0005-2760(98)00145-3
- Xu, R., Jin, J., Hu, W., Sun, W., Bielawski, J., Szulc, Z., Taha, T., Obeid, L.M. and Mao, C. (2006) Golgi alkaline ceramidase regulates cell proliferation and survival by controlling levels of sphingosine and S1P. Journal of the Federation of American Societies of Experimental Biology, 20, 1813-1825. doi:10.1096/fj.05-5689com
- Formiguera, X. and Canton, A. (2004) Obesity: Epidemiology and clinical aspects. Best Practice and Research Clinical Gastroenterology, 18, 1125-1146. doi:10.1016/S1521-6918(04)00091-5
- Samad, F., Hester, K.D., Yang, G., Hannun, Y.A. and Bielawski, J. (2006) Altered adipose and plasma sphingolipid metabolism in obesity: A potential mechanism for cardiovascular and metabolic risk. Diabetes, 55, 2579- 2587. doi:10.2337/db06-0330
- Pi-Sunyer, F.X. (2002) The obesity epidemic: Pathophysiology and consequences of obesity. Obesity Research, 10, 97S-104S. doi:10.1038/oby.2002.202
- Kushner, R.F. (2002) Medical management of obesity. Seminars in Gastrointestinal Disease, 13, 123-132.
- Lee, Y.H. and Pratley, R.E. (2005) The evolving role of inflammation in obesity and the metabolic syndrome. Current Diabetes Reports, 5, 70-75. doi:10.1007/s11892-005-0071-7
- Zucker, T.F. and Zucker, L.M. (1962) Hereditary obesity in the rat associated with high serum fat and cholesterol. Proceedings of the Society for Experimental Biology and Medicine Society for Experimental Biology and Medicine, 110, 165-171.
- Bray, G.A. (1977) The Zucker-fatty rat: A review. Federation Proceedings, 36, 148-153.
- McCaleb, M.L. and Sredy, J. (1992) Metabolic abnormalities of the hyperglycemic obese Zucker rat. Metabolism, 41, 522-525. doi:10.1016/0026-0495(92)90212-S
- Raju, J., Bajaj, G., Chrusch, J. and Bird, R.P. (2006) Obese state leads to elevated levels of TGF-β and COX isoforms in platelets of Zucker rats. Molecular and Cellular Biochemistry, 284, 19-24. doi:10.1007/s11010-005-9008-3
- Raju, J. and Bird, R.P. (2006) Alleviation of hepatic steatosis accompanied by modulation of plasma and liver TNF-α levels by Trigonella foenum graecum (Fenugreek) seeds in Zucker obese (fa/fa) rats. International Journal of Obesity, 30, 1298-1307. doi:10.1038/sj.ijo.0803254
- Jain, S.S. and Bird, R.P. (2010) Elevated expression of tumor necrosis factor-α signaling molecules in colonic tumors of Zucker obese (fa/fa) rats. International Journal of Cancer, 127, 2042-2050. doi:10.1002/ijc.25232
- Jain, S.S., AshokKumar, M. and Bird, R.P. (2011) Differential expression of TNF-α signaling molecules and ERK1 in distal and proximal colonic tumors associated with obesity. Tumor Biology, 32, 1005-1012. doi:10.1007/s13277-011-0202-5
- Bielawski, J., Szulc, Z.M., Hannun, Y.A. and Bielawska, A. (2006) Simultaneous quantitative analysis of bioactive sphingolipids by high-performance liquid chromatographytandem mass spectrometry. Methods, 39, 82-91. doi:10.1016/j.ymeth.2006.05.004
- Chanussot, F., Ulmer, M., Ratanasavanh, R., Max, J.P., and Debry, G. (1984) Influence of diet composition on obesity, hyperlipemia and liver steatosis in Zucker fa/fa rats pair-fed with Zucker Fa/rats. International Journal of Obesity, 8, 259-270.
- Angulo, P. (2002) Nonalcoholic fatty liver disease. New England Journal of Medicine, 346, 1221-1231. doi:10.1056/NEJMra011775
- Wellen, K.E. and Thompson, C.B. (2010) Cellular metabolic stress: Considering how cells respond to nutrient excess. Molecular Cell, 40, 323-332. doi:10.1016/j.molcel.2010.10.004
- Chitturi, S. and Farrell, G.C. (2001) Etiopathogenesis of nonalcoholic steatohepatitis. Seminars in Liver Disease, 21, 27-41. doi:10.1055/s-2001-12927
- Woodcock, J. (2006) Sphingosine and ceramide signaling in apoptosis. International Union of Biochemistry and Molecular Biology Life, 58, 462-466. doi:10.1080/15216540600871118
- Ogretmen, B. (2006) Sphingolipids in cancer: Regulation of pathogenesis and therapy. Federation of European Biochemical Societies Letters, 580, 5467-5476. doi:10.1016/j.febslet.2006.08.052
- Yetukuri, L., Katajamaa, M., Medina-Gomez, G., Seppanen-Laakso, T., Vidal-Puig, A. and Oresic, M. (2007) Bioinformatics strategies for lipidomics analysis: Characterization of obesity related hepatic steatosis. BMC Systems Biology, 1, 12. doi:10.1186/1752-0509-1-12
- Suzuki, E., Handa, K., Toledo, M.S. and Hakomori, S. (2004) Sphingosine-dependent apoptosis: A unified concept based on multiple mechanisms operating in concert. Proceedings of the National Academy of Sciences of the United States of America, 101, 14788-14793. doi:10.1073/pnas.0406536101
- Strelow, A., Bernardo, K., dam-Klages, S., Linke, T., Sandhoff, K., Kronke, M. and Adam, D. (2000) Overexpression of acid ceramidase protects from tumor necrosis factor-induced cell death. Journal of Experimental Medicine, 192, 601-612. doi:10.1084/jem.192.5.601
- Fyrst, H. and Saba, J.D. (2008) Sphingosine-1-phosphate lyase in development and disease: Sphingolipid metabolism takes flight. Biochimica et Biophysica Acta—Molecular and Cell Biology of Lipids, 1781, 448-458. doi:10.1016/j.bbalip.2008.05.005
- Olivera, A., Edsall, L., Poulton, S., Kazlauskas, A. and Spiegel, S. (1999) Platelet-derived growth factor-induced activation of sphingosine kinase requires phosphorylation of the PDGF receptor tyrosine residue responsible for binding of PLCγ. Journal of the Federation of American Societies for Experimental Biology, 13, 1593-1600. http://www.fasebj.org/content/13/12/1593.full
- Olivera, A., Kohama, T., Edsall, L., Nava, V., Cuvillier, O., Poulton, S. and Spiegel, S. (1999) Sphingosine kinase expression increases intracellular sphingosine-1-phosphate and promotes cell growth and survival. Journal of Cell Biology, 147, 545-558. doi:10.1083/jcb.147.3.545
- Xin, M. and Deng, X. (2006) Protein phosphatase 2A enhances the proapoptotic function of Bax through dephosphorylation. Journal of Biological Chemistry, 281, 18859- 18867. doi:10.1074/jbc.M512543200
- Ruvolo, P.P. (2003) Intracellular signal transduction pathways activated by ceramide and its metabolites. Pharmacological Research, 47, 383-392. doi:10.1016/S1043-6618(03)00050-1
- Gross, A., Jockel, J., Wei, M.C. and Korsmeyer, S.J. (1998) Enforced dimerization of BAX results in its translocation, mitochondrial dysfunction and apoptosis. European Molecular Biology Organization (EMBO) Journal, 17, 3878-3885. doi:10.1093/emboj/17.14.3878
- Canbay, A., Gieseler, R.K., Gores, G.J. and Gerken, G. (2005) The relationship between apoptosis and non-alcoholic fatty liver disease: An evolutionary cornerstone turned pathogenic. Zeitschrift für Gastroenterologie, 43, 211-217. doi:10.1055/s-2004-813744.