Paper Menu >>
Journal Menu >>
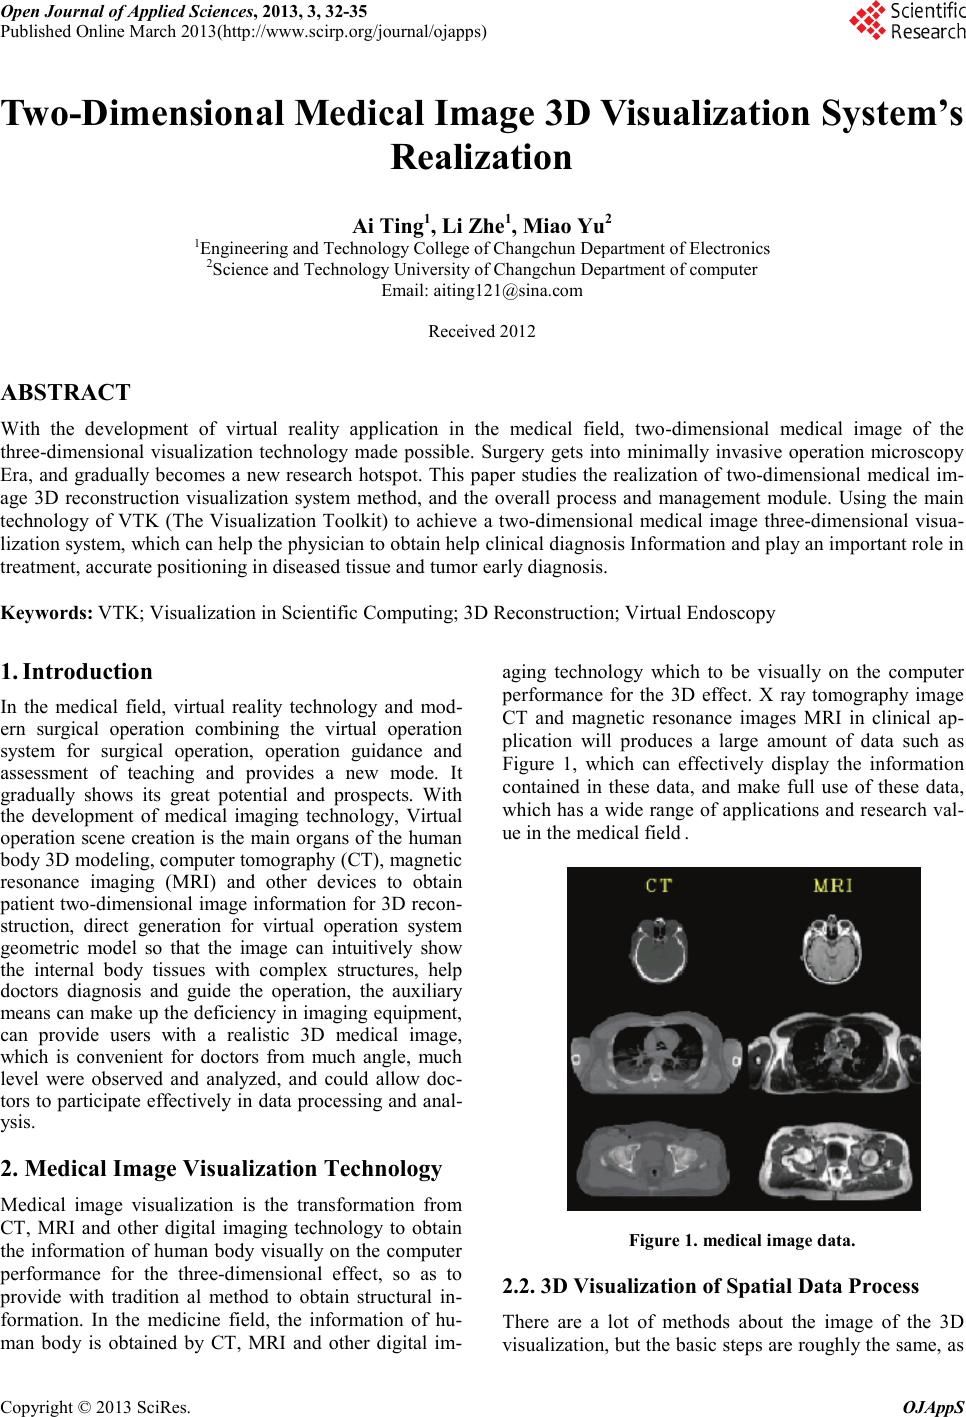 Open Journal of Applied Sciences, 2013, 3, 32-35 Published Online March 2013(http://www.scirp.org/journal/ojapps) Copyright © 2013 SciRes. OJAppS Two-Dimensional Medical Image 3D Visualization System’s Realization Ai Ting1, Li Zhe1, Miao Yu2 1Engineering and Technology College of Changchun Department of Electronics 2Science and Technology University of Changchun Department of computer Email: aiting121@sina.com Received 2012 ABSTRACT With the development of virtual reality application in the medical field, t wo-dimensional medical image of the three -dimensional visualization technology made possible. Surgery gets into minimally invasive operation microscopy Era, and gradually becomes a new research hotspot. This paper studies the realization of two-dimensional medical im- age 3D reconstruction visualization system method, and the overall process and management module. Using the main technology of VTK (The Visualization Toolkit) to achieve a two-dimensional medical image three-dimensional visua- lization system, which can help the physician to obtain help clinical diagnosis Information and play an important role in treatment, accurate positioning in diseased tissue and tumor early diagnosis. Keywords: VTK; Visualization in Scientific Computing; 3D Reconstruction; Virtual Endoscopy 1. Introduction In the medical field, virtual reality technology and mod- ern surgical operation combining the virtual operation system for surgical operation, operation guidance and assessment of teaching and provides a new mode. It gradually shows its great potential and prospects. With the development of medical imaging technology, Virtual operation scene creation is the main organs of the human body 3D modeling, computer tomography (CT), magnetic resonance imaging (MRI) and other devices to obtain patient two-dimensional image information for 3D recon- struction, direct generation for virtual operation system geometric model so that the image can intuitively show the internal body tissues with complex structures, help doctors diagnosis and guide the operation, the auxiliary means can make up the deficiency in imaging equipment, can provide users with a realistic 3D medical image, which is convenient for doctors from much angle, much level were observed and analyzed, and could allow doc- tors to participate effectively in data processing and anal- ysis. 2. Medical Image Visualization Technology Medical image visualization is the transformation from CT, MRI and other digital imaging technology to obtain the information of human body visually on the computer performance for the three-dimensional effect, so as to provide with tradition al method to obtain structural in- formation. In the medicine fie ld , the information of hu- man body is obtained by CT, MRI and other digital im- aging technology which to be visually on the computer performance for the 3D effect. X ray tomography image CT and magnetic resonance images MRI in clinical ap- plication will produces a large amount of data such as Figure 1, which can effectively display the information contained in these data, and make full use of these data, whi c h has a wide range of applications and research val- ue in the medical field . Figure 1. med ical image data. 2.2. 3D Visualization of Spatial Data Process There are a lot of methods about the image of the 3D visualization, but the basic steps are roughly the same, as 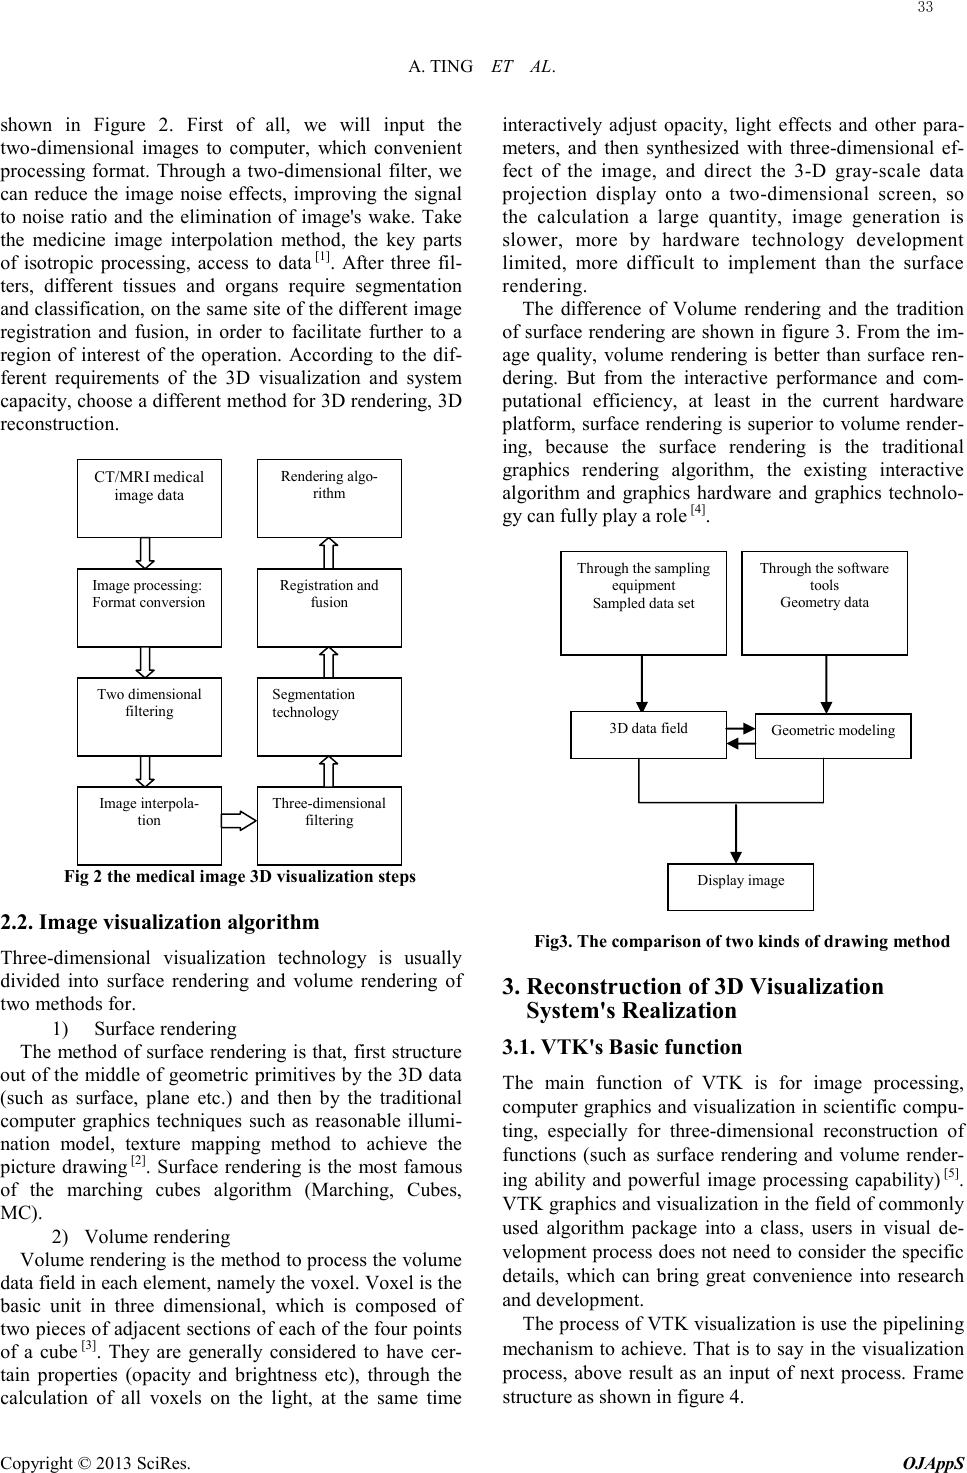 A. TIN G ET AL. Copyright © 2013 SciRes. OJAppS shown in Figure 2. First of all, we will input the two-dimensional images to computer, which convenient processing format. Through a two-dimensional filter, we can reduce the image noise effects, improving the signal to noise ratio and the elimination of image's wake. Take the medicine image interpolation method, the key parts of isotropic processing, access to data [1]. After three fil- ters, different tissues and organs require segmentation and classification, on the same site of the different image registration and fusion, in order to facilitate further to a region of interest of the operation. According to the dif- ferent requirements of the 3D visualization and system capacity, choose a different method for 3D rendering, 3D rec onstr ucti o n. Fig 2 the medical image 3D visualization steps 2.2. Image visualization algorit hm Thr ee -dimensional visualization technology is usually divided into surface rendering and volume rendering of two methods for. 1) Surface rendering The method of surface rendering is that, first structure out of the middle of geometric primitives by the 3D data (such as surface, plane etc.) and then by the traditional computer graphics techniques such as reasonable illumi- nation model, texture mapping method to achieve the picture drawing [2]. Surface rendering is the most famous of the marching cubes algorithm (Marching, Cubes, MC). 2) Volume rendering Volume rendering is the method to process the volume data field in each element, namely the voxel. Voxel is the basic unit in three dimensional, whi c h is composed of two pieces of adjacent sections of each of the four points of a c ube [3]. They are generally considered to have cer- tain properties (opacity and brightness etc), through the calculation of all voxels on the light, at the same time interactively adjust opacity, light effects and other para- meters, and then synthesized with three-dimensional ef- fect of the image, and direct the 3-D gray-scale data projection display onto a two-dimensional screen, so the calculation a large quantity, image generation is slower, more by hardware technology development limited, more difficult to implement than the surface rendering. The difference of Volume rendering and the tradition of surface rendering are shown in figure 3. From the im- age quality, volume rendering is better than surface ren- der ing. But from the interactive performance and com- putational efficiency, at least in the current hardware platform, surface rendering is superior to volume render- ing, because the surface rendering is the traditional graphics rendering algorithm, the existing interactive algorithm and graphics hardware and graphics technolo- gy can fully play a role [4]. Fig3. The comparison of two kinds of drawing method 3. Reconstruction of 3D Visualization System's Realization 3.1. VTK's Basic function The main function of VTK is for image processing, computer graphics and visualization in scientific compu- ting, especially for three-dimensional reconstruction of functions (such as surface rendering and volume render- ing ability and powerful image processing capability) [5]. VTK graphics and visualization in the field of commonly used algorithm package into a class, users in visual de- velopment process does not need to consider the specific details, which can bring great convenience into research and development. The process of VTK visualization is us e the pipelining mechanism to achieve. That is to say in the visualization process, above result as an input of next process. Frame structure as shown in figure 4. CT/MRI medical image data Image processing: Format conversion Two dimensional filtering Image interpola- tion Three -dimensional filtering Segmentation technology Registration and fusion Rendering algo- rithm Through the software tools Geometry data Through the sampling equipmen t Sampled data set 3D data field Geometric modeling Display image 33 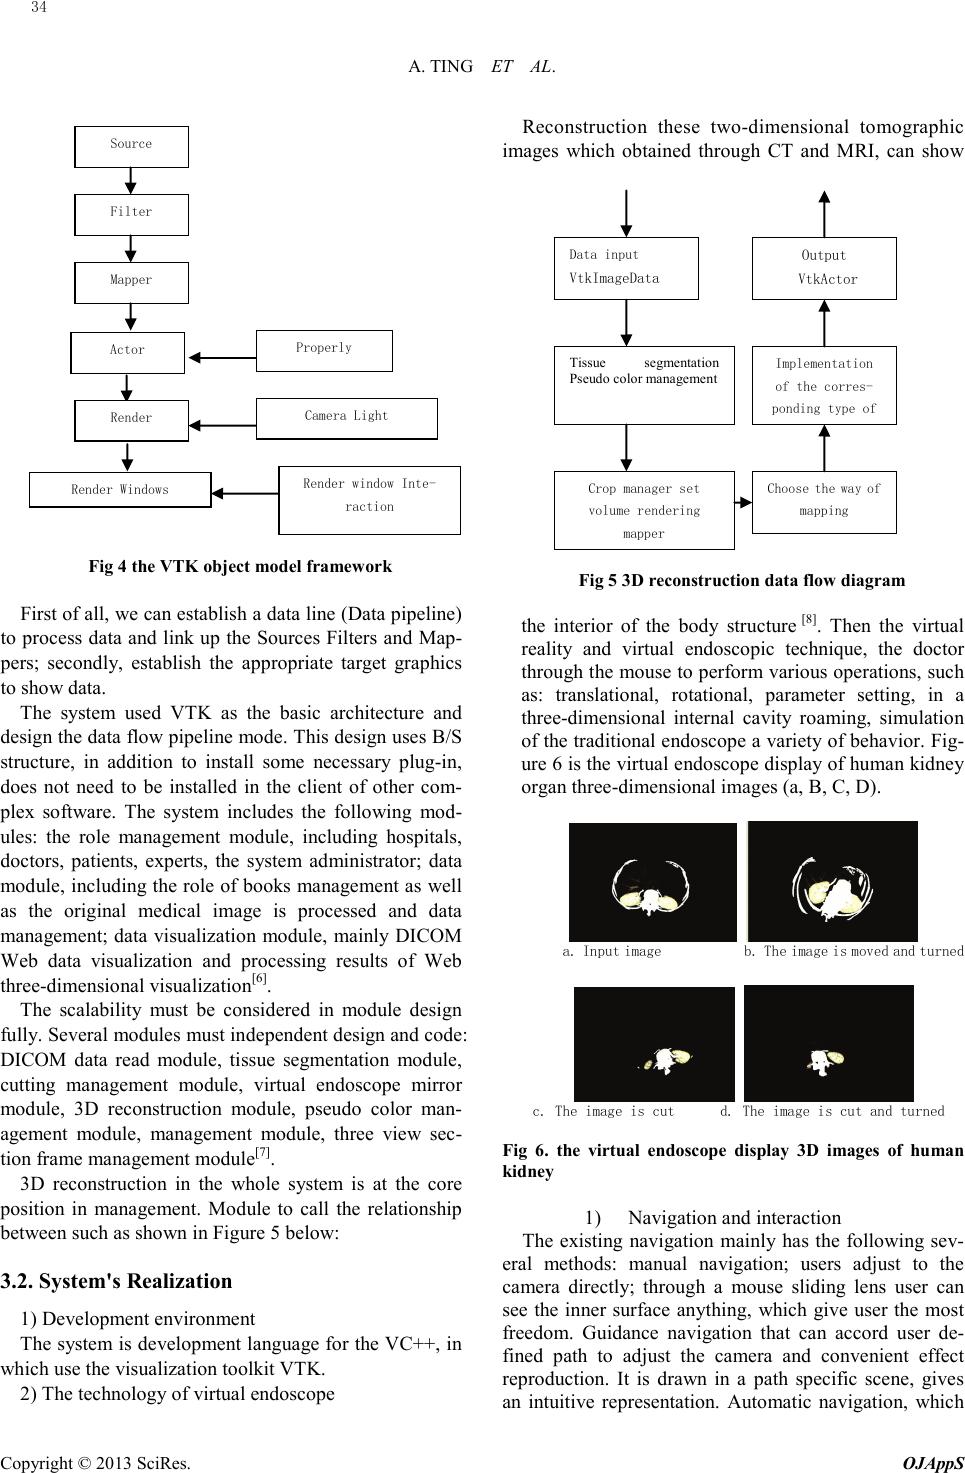 A. TING ET AL. Copyright © 2013 SciRes. OJAppS Fig 4 the VTK object model framework First of all, we can establish a data line (Data pipeline) to process data and link up the Sources Filters and Map- pers; secondly, establish the appropriate target graphics to show data. The system used VTK as the basic architecture and design the data flow pipeline mode. This design uses B/S structure, in addition to install some necessary plug-in, does not need to be installed in the client of other com- plex software. The system includes the following mod- ules: the role management module, including hospitals, doctors, patients, experts, the system administrator; data module, including the role of books management as well as the original medical image is processed and data management; data visualization module, mainly DICOM Web data visualization and processing results of Web three -dimensional visualization[6]. The scalability must be considered in module design fu lly. Several modules must independent design and code: DICOM data read module, tissue segmentation module, cutting management module, virtual endoscope mirror module, 3D reconstruction module, pseudo color man- agement module, management module, three view sec- tion frame management module[7]. 3D reconstruction in the whole system is at the core position in management. Module to call the relationship between such as shown in Figure 5 below: 3.2. System's Realization 1) Development environment The system is development language for the VC++, in which use the visualization toolkit VTK. 2) The technology of virtual endoscope Reconstruction these two-d imensional tomographic images which obtained through CT and MRI, can show Fig 5 3D reconstruction data flow diagram the interior of the body structure [8]. Then the virtual reality and virtual endoscopic technique, the doctor thro ugh the mouse to perform various operations, such as: translational, rotational, parameter setting, in a three -dimensional internal cavity roaming, simulation of the traditional endoscope a variety of behavior. Fig- ure 6 is the virtual endoscope display of human kidney organ three-dimensional images (a, B, C, D). a. Input image b. The image is moved and turned c. The image is cut d. The image is cut and turned Fig 6. the virtual endoscope display 3D images of human kidne y 1) Navigation and interaction The existing navigation mainly has the following sev- eral methods: manual navigation; users adjust to the camera directly; through a mouse sliding lens user can see the inner surface anything, which give user the most freedom. Guidance navigation that can accord user de- fined path to adjust the camera and convenient effect reproduction. It is drawn in a path specific scene, gives an intuitive representation. Automatic navigation, which Source Filter Mapper Actor Render Render Windows Properly Camera Light Render window Inte- raction Data input VtkImageData Tissue segmentation Ps e udo color management Crop manager set volume rendering mapper Choose the way of mapping Implementation of the corres- ponding type of Output VtkActor 34 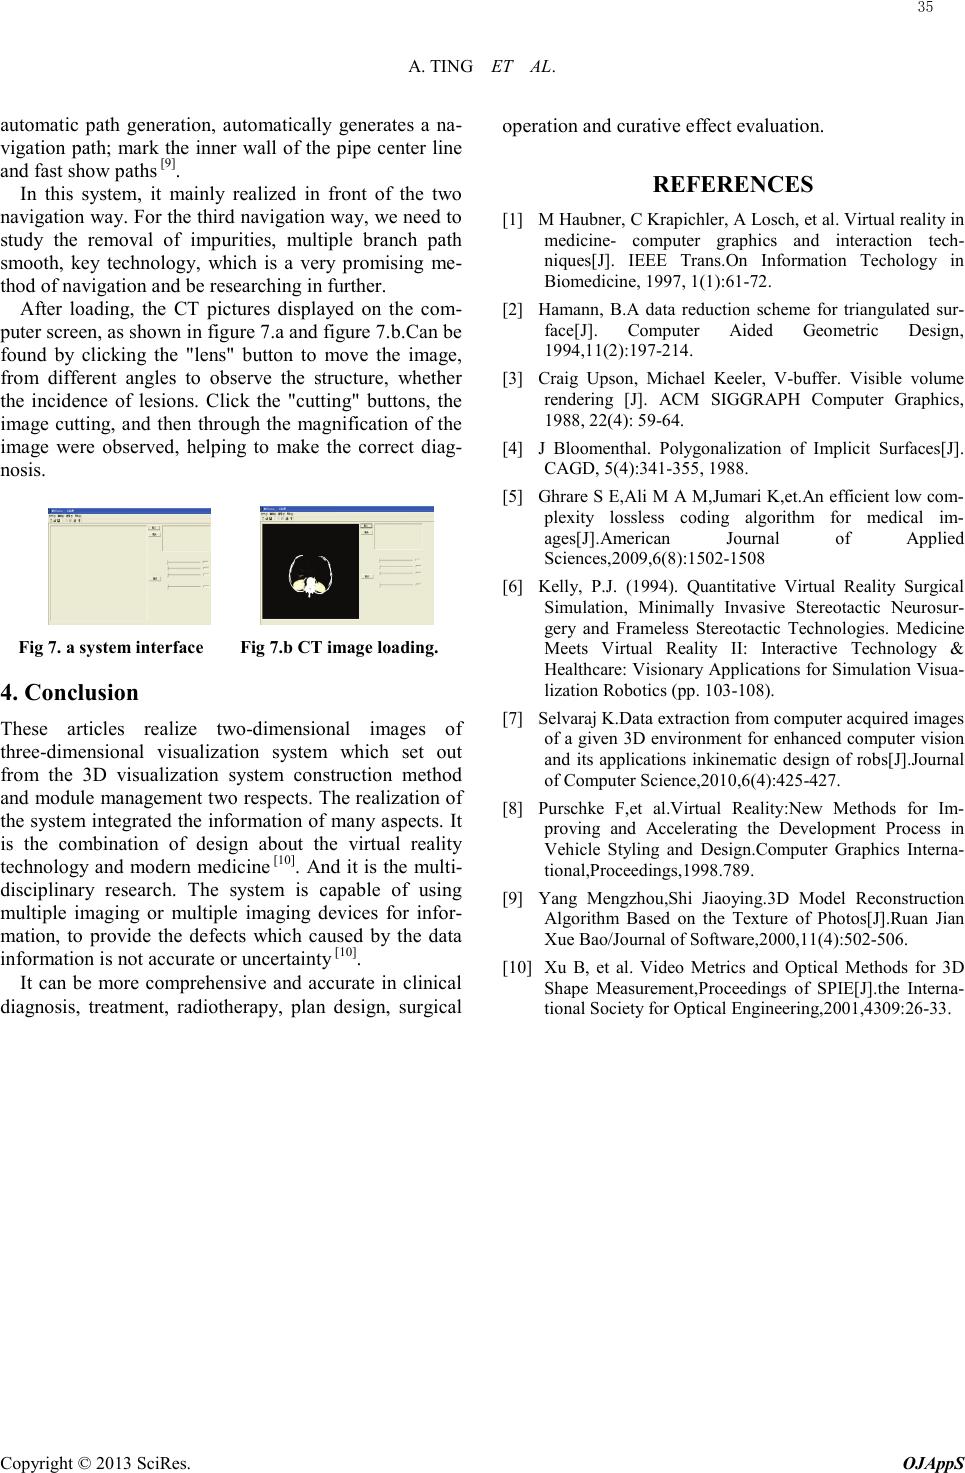 A. TIN G ET AL. Copyright © 2013 SciRes. OJAppS automatic path generation, automatically generates a na- vigation path; mark the inner wall of the pipe center line and fast show pat hs [9]. In this s yst e m, it mainly realized in front of the two navigation way. For the third navigation way, we need to study the removal of impurities, multiple branch path smooth, key technology, which is a very promising me- thod of navigation and be researching in further. After loading, the CT pictures displayed on the com- puter screen, as shown in figure 7.a and figure 7.b.Can be found by clicking the "lens" button to move the image, from different angles to observe the structure, whether the incidence of lesions. Click the "cutting" b utto ns, the image cutting, and then through the magnification of the image were observed, helping to make the correct diag- nosis. Fig 7. a system interface Fig 7.b CT image loading. 4. Conclusion These articles realize two-dimensional images of three -dimensional visualization system wh i c h set out from the 3D visualization system construction method and module management two respects. The realization of the system int e grat ed the information of many aspects. It is the combination of design about the virtual reality technology and modern medicine [10]. And it is the mul t i- disciplinary research. The system is capable of using multiple imaging or multiple imaging devices for infor- mation, to provide the defects which caused by the data information is not accurate or unc er tai nt y [10]. It can be more comprehensive and accurate in clinical diagnosis, treatment, radiotherapy, plan design, surgical operation and curative effect evaluation. REFERENCES [1] M Haubner, C Krapichler, A Losch, et al. Virtual reality in medicine- computer graphics and interaction tech- niques[J]. IEEE Trans.On Information Techology in Biomedicine, 1997, 1(1):61-72. [2] Hamann, B.A data reduction scheme for triangulated sur- fac e[J]. Computer Aided Geometric Design, 1994,11(2):197-214. [3] Craig Upson, Michael Keeler, V-buffer. Visible volume rendering [J]. ACM SIGGRAPH Computer Graphics, 1988, 22(4): 59-64. [4] J Bloomenthal. Polygonalization of Implicit Surfaces[J]. CAGD, 5(4):341-355, 1988. [5] Ghrare S E,Ali M A M,Jumari K,et.An efficient low com- plexity lossless coding algorithm for medical im- ages[J].American Journal of Applied Sciences,2009,6(8):1502-1508 [6] Kelly, P.J. (1994). Quantitative Virtual Reality Surgical Simulation, Minimally Invasive Stereotactic Neurosur- gery and Frameless Stereotactic Technologies. Medicine Meets Virtual Reality II: Interactive Technology & Healthcare: Visionary Applications for Simulation Visua- lization Robotics (pp. 103-108). [7] Selvaraj K.Data extraction from computer acquired images of a given 3D environment for enhanced computer vision and its applications inkinematic design of robs[J].Journal of Computer Science,2010,6(4):425-427. [8] Purschke F,et al.Virtual Reality:New Methods for Im- proving and Accelerating the Development Process in Vehicle Styling and Design.Computer Graphics Interna- tional,Proceedings,1998.789. [9] Yang Mengzhou,Shi Jiaoying.3D Model Reconstruction Algorithm Based on the Texture of Photos[J].Ruan Jian Xue Bao/Journal of Software,2000,11(4):502-506. [10] Xu B, et al. Video Metrics and Optical Methods for 3D Shape Measurement,Proceedings of SPIE[J].the Interna- tional Society for Optical Engineering,2001,4309:26-33. 35 |