Open Journal of Applied Sciences, 2013, 3, 6-9
Published Online March 2013 (http://www.scirp.org/journal/ojapps)
Copyright © 2013 SciRes. OJAppS
Quality Analyses of Fine Structures Transfer
in the Photorealistic Images
S. V. Sai, I. S. Sai, N. Yu. Sorokin
Department of automation and information technologies, Pacific National University, Khabarovsk, Russia
Email: sai@evm.khstu.ru, nus@mail.khstu.ru
Received 2012
ABSTRACT
This work presents method of the quality analyses of the photorealistic images. Developed method utilizes proposed
criteria of image definition quality for fine details. Presented method has the following significant property: the quality
estimation is provided without test images or patterns. Algorithm for search and recognition of fine structures in the
photorealistic images using the predefined criterion is considered.
Keywords: Image Quality Analyses; Search Algorithm; Fine Structures Recognition
1. Introduction
Quality control of the compressed digital image is com-
plex and a mbiguous. Usually the distortion definitions of
the static and dynamic test signals are the indirect values
of the quality estimation of the broadband digital system.
However, systems of the compressed television signals
have to be analyzed using more complex parameter
measurements. Image quality in such systems changes
dynamically depending on the data rate, complexity of the
transferred image and applied coding algorithm. Static test
signals cannot present real quality characteristics of the
image. More complex analyses instead of simple test
signals must be carried out, i.e. natural test images in
compressed mode must be used.
Objective analyses of the digital video signals can be
produced using the current measurement systems (like
PQA200, PQA300, PQA500, etc.). In general, these types
of equipment are used by the vendors of the video com-
pression systems for the quality analyses of codecs. But
the application of such equipment is not suitable when the
multimedia system has been already selected by the
broadcasting company using some criteria.
Suppliers of the multimedia services provide highly
compressed images in a low quality pack because of ab-
sence of the standard methods of quality analyses for
digital images and video. In most cases user has no orig-
inal image to compare with, thus he estimates the “good”
or “bad” quality of the received image using his expe-
rience of visual perception of such properties as image
definition, s ha r p ne s s, contrast, saturation, presence of the
artifacts. Modern analyzers use the quality analyses me-
thods that are based on comparison of the differences
between test and distorted (corrupted) images [1-6]. This
comparison is carried out for some selected visual model.
Thus, the absence of test images does not allow the ap-
plication of such analyzers.
Therefore, finding new methods of the quality analys-
es is an actual problem. Such methods must provide an
objective estimation of image definition quality and
sharpness degradation without the test patterns.
This article proposes the method of the visual image
definition quality estimation of the photorealistic image
using the objective criterion without the test image. Spe-
cial features of the proposed algorithm for search and
recognition of fine structures in the real ima ge s are con-
sidered.
2. Algorithm for search and recogn it ion
In order to estimate the image definition quality search
and recognition of the fine structures must be carried out.
Such structures include fine details like dot objects or
thin line fragments with the size from one to several pix-
els.
Search algorithm consists of the following stages. In
the first stage the transformation of the primary color
signals (RGB) to the equal color space
***
VUW
is
produced for each pixel [7] using the following equation:
1725 31 −= /* YW
,
)uu(WU
o
**
−= 13
,
)vv(WV
o
**
−=13
,
whe re
Y
is the luminance, changed from 1 to 100,
*
W
is the br i ght ness i nd e x;
*
U
and
*
V
are the
chromaticity indices; u and vare the chromaticity
S. V. SAI ET AL.
Copyright © 2013 SciRes. OJAppS
coordinates in Mac-Adam diagram [8]; o
u
and o
v
are the chromaticity coordinates of basic white color with
o
u= 0,201, o
v = 0,307.
Equal color spaces (
***
VUW
, *** vaL , etc.) are used
traditionally for the estimation of color transfer quality
for the big details. Here estimation of the color differ-
ences Δ is computed as
() () ()
222
3***VUW
∆∆∆∆
++=
, (1)
whe re
*
o
*
o
*
W
~
WW −=
;
*
o
*
o
*
U
~
UU −=
;
*
o
*
o
*
V
~
VV −=
;
*
o
*
o
*
o
VUW
are the color coordinates
of the big detail from the test image;
*
o
*
o
*
o
V
~
U
~
W
~
are the
color coordinates of the distorted image. The color trans-
fer quality is determined by the number of the minimum
perceptible color difference (MPCD). If Δ < 1 then the
color differences are invisible for the human eye.
In our works [9-10] we proposed method of the color
differences estimation between the fine detail (
*
o
*
o
*
o
VUW
)
and the color coordinates of the background pixels
(
*
b
*
b
*
b
VUW
) using the normalized equal color space. The
following criterion was used:
2
*
th
*
b
*
o
2
*
th
*
b
*
o
2
*
th
*
b
*
o
V
VV
U
UU
W
WW
K
+
+
=
∆∆∆
, (2)
whe re ΔK color contrast of the fine detai l relative ly to
bac kgr o u nd ; *
th
W
, *
th
U
, *
th
V
are the thresholds
according to brightness and chromaticity indices for fine
detail. Threshold values on brightness and chromaticity
indices depend on the size of fine detail, background
color coordinates, time period of object presentation and
noise level. For fine details with sizes not exceeding one
pixel the threshold values are obtained experimentally. In
particular [9], for fine details of the test pattern located
on a grey background (9070 << *
b
W) threshold values
are approximately 6
*
th
W
MPCD and
72≈≈ *
th
*
th UU
∆∆
MPCD.
In the second stage the criterion (2) is used for the es-
timation of quality and recognition of fine details. For
this, the processed image is scanned with the 3×3 pixels
window. Recognition algorithm of the fine structure is
executed for each iteration step.
During the analyses we should recognize an object: is
it a dot of a thin line. For this we use the binary images
of the fine structures presented on Figure 1. Using im-
ages we can obtain the spatial coordinates of the object
and background.
Figure 1. Binary images of the fine structures.
Analyses are started with the first structure a dot (left
image on Figure 1). On the first step the mean values of
the color coordinates of the background (
*
b
*
b
*
b
VUW
) and
object (
*
o
*
o
*
o
VUW
) are computed.
Next, the following condition is checked:
50
1
1
,K
N
N
n
nb <=
=
∆∆
, (3)
whe re n is a relative number of the background pixel in
the cur r e nt window (3×3); N is a total number of back-
ground p ixel s in the win dow; n
K
is a color contrast
of the pixel relative to mean value of the background
color, computed as
2
*
th
*
b
*
n
2
*
th
*
b
*
n
2
*
th
*
b
*
n
n
V
VV
U
UU
W
WW
K
+
+
=
∆∆∆
. (4)
Condition (3) means that the color differences between
the background pixels are invisible for an eye. Similarly,
the color differences for the object pixels are computed:
50
1
1
,K
M
M
m
mo <=
=
∆∆
, (5)
whe re m is a relative number of the object pixel; M is
a total number of object pixels in a wind ow (3×3);
m
K
color contrast of the object pixel relative to mean
values (*
o
W
*
o
U
*
o
V
), that are produced similar to (4).
If the cond itions (3) a nd (5) are fulfilled, the contrast of
the object relatively to the background is computed
2
*
th
*
b
*
o
2
*
th
*
b
*
o
2
*
th
*
b
*
o
b/o
V
VV
U
UU
W
WW
K
+
+
=
∆∆∆
(6)
and afterwards the following condition is checked
2
b/o
K
. (7)
If (7) is satisfied than the decision is made that the dot
object is recognized and we save the spatial coordinates
of the center of this object (i, j). Af t er this we move th e
win dow further by three pixels and ana lyze a no t her block
of the processed image.
If conditions (3), (5) and (7) are not fulfilled the next
structur e (a fragmen t of the hori zo nt a l thin line) is
processed. Also, if conditions (3), (5) and (7) are not ful-
filled for each structure we decide that the current win-
dow has no recognized objects and the window is shifted
further by one element.
Hereby, the proposed algorithm allows for recognition
and selection of the fine structures dots and thin lines
fragments, noticeable for an eye. Note that compared to
the algorithm described in the work [10] we do not use
the comparison of the binary blocks to the binary masks.
This reduces the number of computation steps signifi-
cantly.
Figure 2 presents an example of the algorithm output,
7
S. V. SAI ET AL.
Copyright © 2013 SciRes. OJAppS
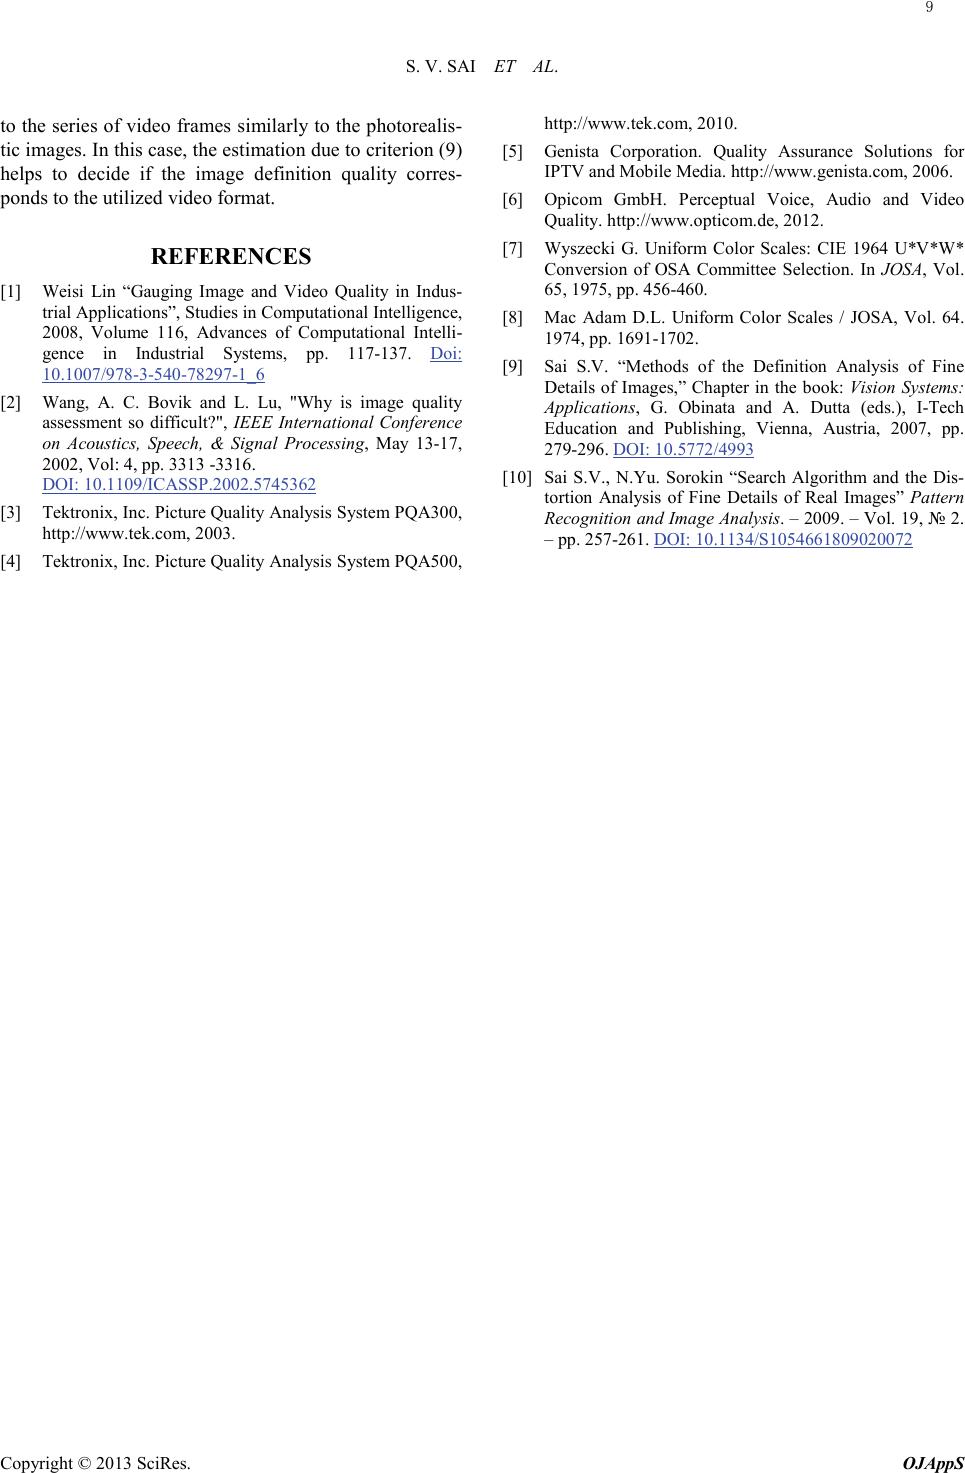
where the fine structures are selected from the photorea-
listic image (244×225 pixels).
Figure 2. Example of the recognition of fine structures.
3. Criterion of image definition quality
Normally, the image de finitio n quality is estimated usin g
the resolution of the video system, i.e. by the number of
reproduced pixels or the format of the image. For exam-
ple, the format 1280×960 (1,23 Megapixels) means that
the photo or video system is able to reproduce the fine
details with sizes 1/1280 and 1/960 from width and
height of the image frame, accordingly. So, the image
will have a number of fine structures noticeable by an
eye in case the image is not distorted. Particularly, for the
image in Figure 2 number of recognized fine structures
is equal to NR = 0,18% from the total amount of pixels.
Obvio usl y, that NR depends on the real number of fine
details of the image and on the format of the image.
However, the photorealistic image will always have
some minimal value of NR. This assumption is used in the
developed method of the image definition quality estima-
tion.
The method of the estimation consists of several stages.
Assume that we have a number of photorealistic images
provided by the multimedia service through the Internet.
Usually, these images are transferred using the com-
pressed format, like JPEG or JPEG-2000 standards. Each
i mage (m) can be presented in arbitrary format (number
of pixels). For example, one of them can have 1280×960
pixels, another 800×600 pixels.
At the first stage, we process each image with the pre-
sented algorithm for search and recognition of the fine
structures. We compute the mean value:
=
=
M
m
m,RR N
M
N
1
1, (8)
whe re M is the number of processed images. This mean
value is compared to the threshold NTH
THRNN
. (9)
If the criterion (9) is satisfied then the decision is
made that the image definition quality corresponds to the
presented format. This threshold value is selected expe-
rimentally after analyzing a big set of not distorted im-
ages in different formats. As a result of the experiment
we concluded that the image definition quality corres-
ponds to the presented format in case the number of rec-
ognized fine structures is greater than the threshold NTH =
0,05%.
If the criterion (9) is not satisfied, i.e. number of fine
structures is less than 0,05%, the decision is made that
the image definition quality does not correspond to the
presented format.
Nonfulfill ment of the criterion (9) means that the
processed images have lack of fine structures. This result
can be explained by the following reasons: images were
highly distorted due to the high level of compression in
codec, or were obtained from the digital camera with the
lower resolution than the image format.
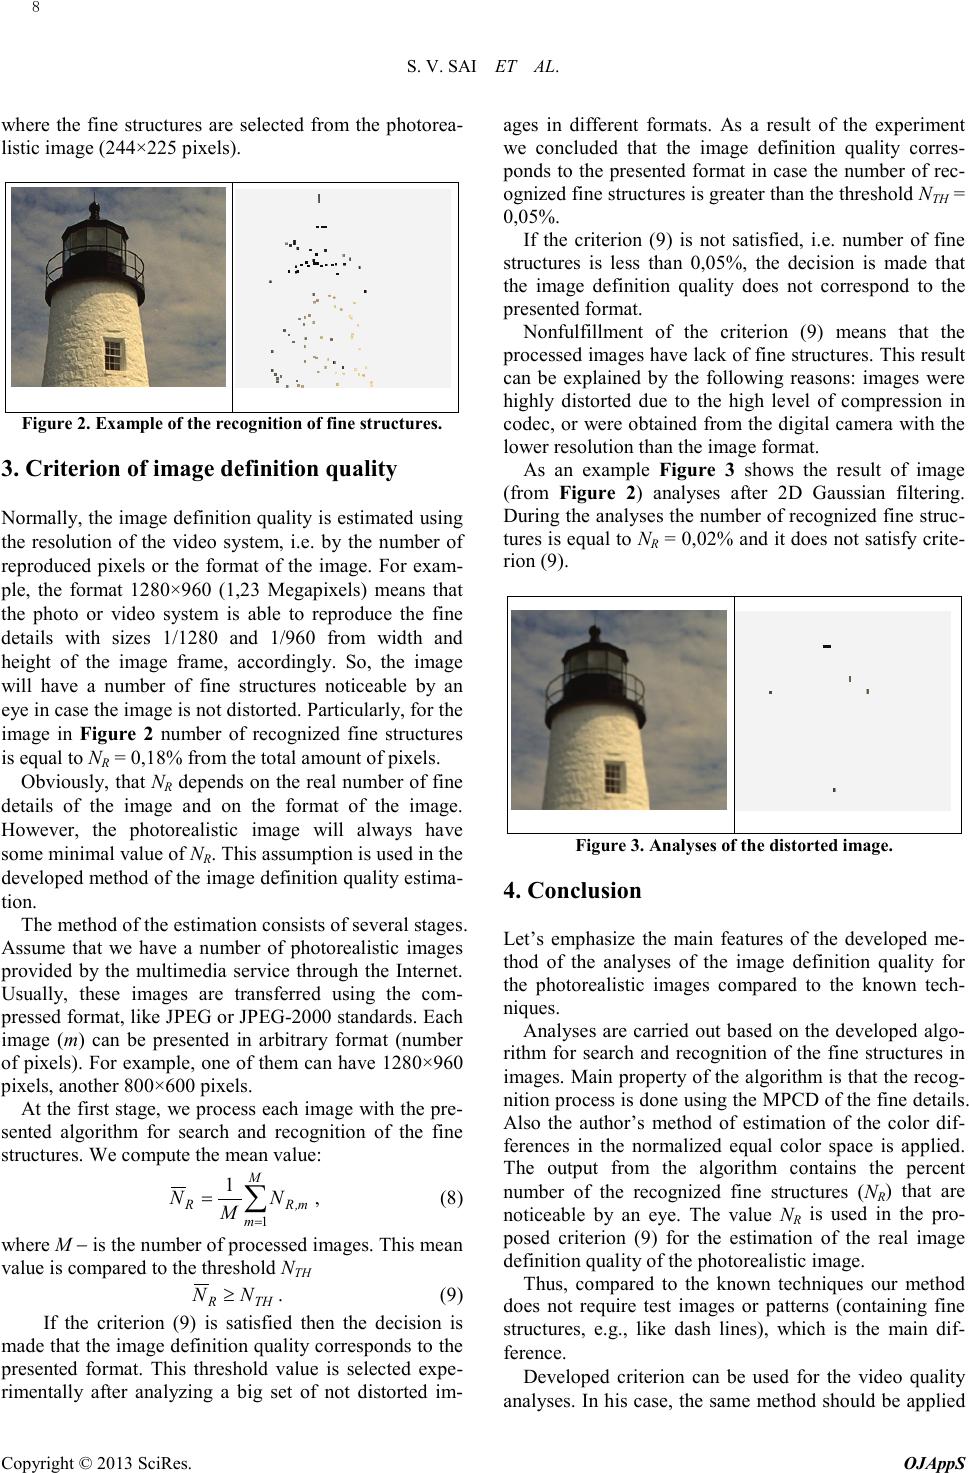
As an example Figure 3 shows the result of image
(from Figure 2) analyses after 2D Gaussian filtering.
During the analyses the number of recognized fine struc-
tures is equal to NR = 0,02% and it does not satisfy crite-
rion (9).
Figure 3. Analyses of the distorted image.
4. Conclusion
Let ’s emphasize the ma in feat ur es of the developed me-
thod of the analyses of the image definition quality for
the photorealistic images compared to the known tech-
niques.
Analyses are carried out based on the developed algo-
rithm for search and recognition of the fine structures in
i mages. Main property of the algorithm is that the recog-
nition process is done using the MPCD of the fine details.
Also the author’s method of estimation of the color dif-
ferences in the normalized equal color space is applied.
The o utp ut fr om the algo ri thm contains the percent
number of the recognized fine structures (NR) that are
noticeable by an eye. The value NR is used in the pro-
posed criterio n (9) for the estimation of the real image
definition quality of the photorealistic image.
Thus, compared to the known techniques our method
does not require test images or patterns (containing fine
structures, e.g., like dash lines), which is the main dif-
ference.
Developed criterion can be used for the video quality
analyses. In his case, the same method should be applied
8
S. V. SAI ET AL.
Copyright © 2013 SciRes. OJAppS
to the series of video frames similarly to the photorealis-
tic images. In this case, the estimation due to criterion (9)
helps to decide if the image definition quality corres-
ponds to the utilized video format.
REFERENCES
[1] Weisi Lin “Gauging Image and Video Quality in Indus-
trial Applications”, Studies in Computational Intelligence,
2008, Volume 116, Advances of Computational Intelli-
gence in Industrial Systems, pp. 117-137. Doi:
10.1007/978-3-540-78297-1_6
[2] Wang, A. C. Bovik and L. Lu, "Why is image quality
assessment so difficult?", IEEE International Conference
on Acoustics, Speech, & Signal Processing, May 13-17,
2002, Vol: 4, pp. 3313 -3316.
DOI: 10.1109/ICASSP.2002.5745362
[3] Tektronix, Inc. Picture Quality Analysis System PQA300,
http://www.tek.com, 2003.
[4] Tektronix, Inc. Picture Quality Analysis System PQA500,
http://www.tek.com, 2010.
[5] Genista Corporation. Quality Assurance Solutions for
IPTV and Mobile Media. http://www.genista.com, 2006.
[6] Opicom GmbH. Perceptual Voice, Audio and Video
Quality. http://www.opticom.de, 2012.
[7] Wyszecki G. Uniform Color Scales: CIE 1964 U*V*W*
Conversion of OSA Committee Selection. In JOSA, Vol.
65, 1975, pp. 456-460.
[8] Mac Adam D.L. Uniform Color Scales / JOSA, Vol. 64.
1974, pp. 1691-1702.
[9] Sai S.V. “Methods of the Definition Analysis of Fine
Details of Images,” Chapter in the book: Vision Systems:
Applications, G. Obinata and A. Dutta (eds.), I-Tech
Education and Publishing, Vienna, Austria, 2007, pp.
279-296. DOI: 10.5772/4993
[10] Sai S.V., N.Yu. Sorokin “Search Algorithm and the Dis-
tortion Analysis of Fine Details of Real Images” Pattern
Recognition and Image Analysis. – 2009. – Vol. 19, № 2.
– pp. 257-261. DOI: 10.1134/S1054661809020072
9