Paper Menu >>
Journal Menu >>
 Journal of Software Engineering and Applications, 2012, 5, 46-49 doi:10.4236/jsea.2012.512b010 Published Online December 2012 (http://www.SciRP.org/journal/jsea) Copyright © 2012 SciRes. JSEA Peak Load Modeling for Kingdom of Bahrain Isa S Qam ber Deanship of Scientific Research, University of Bahrain, P. O. Box 32038, Isa Town, Kingdom of Bahrain. Email: iqamber@uob.edu.bh Received 2012 ABSTRACT Deriving some models to estimate the electrical demand for future for the Kingdom of Bahrain is carried out in the present study. The ambient temperature is taken into the account as well as the time factor (Year). The model was de- veloped in away describing the electric power demand during a summer period. The estimated values of the maximum electrical load is obtained and evaluated on actual peak load data of the Kingdom of Bahrain. Keywords: Peak Load; Curve Fitting; Maximum Annual Load 1. Introduction Electricity systems models are software tools used to manage electricity demand and the electricity systems and for generation e xpansion planning purposes. Various portfolios and scenarios mentioned later in the literature review are modeled in order to compare the effects of decision making in policy and on business development plans in electricity systems. The modeling techniques developed to study vertically integrated state monopolies are now applied in liberalized markets where the issues and constraints are more complex. This pa p er r eviews t he modeling response to key developments. The paper pro- vides an overview of electricity systems modeling King- dom of Bahrain. 2. Literatu re Revi ew Through the literature review there are several articles discussing load modeling by using different techniques. Linear regression models have been widely used. Annual maximum power load models are software tools used to manage electrical load demand. These mod- els are used to help the engineers and managers for gen- eration expansion planning purposes. A number of scenarios are tested and modeled in order to be compared and tested to reach a suitable decision. Peik-Herfeh etl al in their article [1] which will be published in the year 1213 present the improvements in renewable energy technologies which are used in the re- sources. A number of factors are considered where por- tions of electrical demand have been met. A virtual pow- er plane is decentralized energy management system tasked to aggregate the capacity of some Distributed Generations, storage facilities, and Dispatchable for the purpose of energy trading and/or providing system sup- port services. Due to the stochastic behavior of the prime sources of some Distributed Generations, such as wind speed and temperature, the steady state analysis of the systems with integration of such Distributed Generation units requires a probabilistic approach. Orlando et al in their paper [2] studied the electric energy prices in Brazil. The electric energy prices are higher during 3 h of peak consumption on working days. However, consumers could use a generator system for partially reducing the electricity costs from utility com- pany during peak hours. T he pr oce s s of sizing a gene rator system begins developing the so called load capacity curve. The acquired building electricity consu mption data was used. This authors in their paper developed two me- thodologies to estimate the curve for every month of the year. The first method use the frequency of occurrence of the measured values of the load power as supplied b y the local utility monthl y bills. Fina lly a generator s ystem was sized, minimizing the e lec tric al ener gy cost supplie d b y it, when the generator meets partially the building load. Kaldellis et al i n their paper [3] considering on the ba- sis of probability distribution of the load demand of a representative Greek island and the corresponding data related to the available wind potential. In their study es- timates the maximum - acceptable by the local grid - wind energy contribution. For that reason, an integrated computational algorithm has been developed from first principles, based on a stochastic analysis. Based on the results obtained, it becomes evident that with the current wind turbine technology, wind energy cannot play a key role in coping with the electrification problems encoun- tered in many Greek island regions, excluding however the case of introducing bulk energy storage systems that 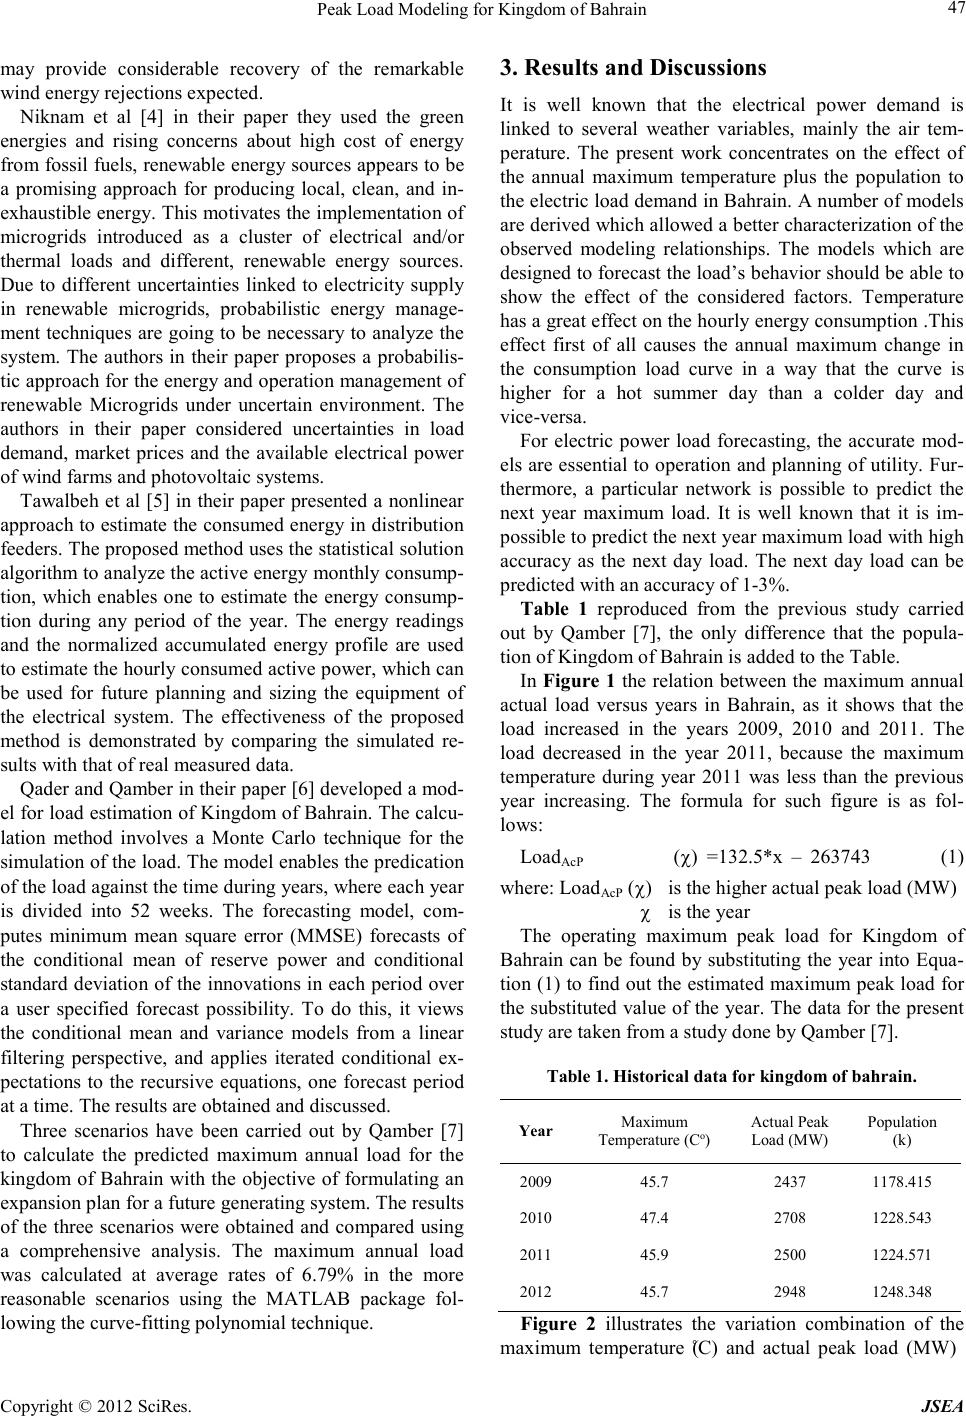 Peak Load Modeling for Kingdom of Bahrain Copyright © 2012 SciRes. JSEA 47 may provide considerable recovery of the remarkable wind energy rejections expected. Niknam et al [4] in their paper they used the green energies and rising concerns about high cost of energy from fossil fuels, renewable energy sources appears to be a promising approach for producing local, clean, and in- exhaustible ener gy. T his motivate s the i mplementatio n of microgrids introduced as a cluster of electrical and/or thermal loads and different, renewable energy sources. Due to different uncertainties linked to electricity supply in renewable microgrids, probabilistic energy manage- ment techniques are going to be necessary to analyze the system. The authors in their paper proposes a probabilis- tic approach for the energy and operation management of renewable Microgrids under uncertain environment. The authors in their paper considered uncertainties in load demand, market prices and the available electrical power of wind farms and photovoltaic systems. Tawalbeh et al [5] in their paper presented a nonlinear approach to estimate the consumed energy in distribution feeders. The proposed method uses the statistical solution algorithm to analyze the activ e energy monthly consump- tion, which enables one to estimate the energy consump- tion during any period of the year. The energy readings and the normalized accumulated energy profile are used to estimate the hourly consumed active power, whic h ca n be used for future planning and sizing the equipment of the electrical system. The effectiveness of the proposed method is demonstrated by comparing the simulated re- sults with that of real measured data. Qader and Qamber in their paper [6] developed a mod- el for load estimation of Kingdom of Bahrain. The calcu- lation method involves a Monte Carlo technique for the simulation of the load. The model enables the predication of the load against the time during years, where each year is divided into 52 weeks. The forecasting model, com- putes minimum mean square error (MMSE) forecasts of the conditional mean of reserve power and conditional stand ard de viation o f the i nnovati ons in e ach per iod ove r a user specified forecast possibility. To do this, it views the conditional mean and variance models from a linear filtering perspective, and applies iterated conditional ex- pectations to the recursive equations, one forecast period at a time. The results are obtained and discussed. Three scenarios have been carried out by Qamber [7] to calculate the predicted maximum annual load for the kingdom of Bahrain with the objective of formulating an expa nsion plan fo r a f uture generatin g sys tem. The results of the three scenarios were obtained and compared using a comprehensive analysis. The maximum annual load was calculated at average rates of 6.79% in the more reasonable scenarios using the MATLAB package fol- lowing the curve -fitti ng pol ynomial tec hnique. 3. Results and Discussions It is well known that the electrical power demand is linked to several weather variables, mainly the air tem- perature. The present work concentrates on the effect of the annual maximum temperature plus the population to the electric load demand in Bahrain. A number of models are derived which allowed a better characterization of the observed modeling relationships. The models which are designed to forecast the load’s behavior should be able to show the effect of the considered factors. Temperature has a gre a t e f fec t o n the hour ly ene rg y c on su mp ti on .This effect first of all causes the annual maximum change in the consumption load curve in a way that the curve is higher for a hot summer day than a colder day and vice-versa. For electric power load forecasting, the accurate mod- els are essential to operation and planning of utility. Fur- thermore, a particular network is possible to predict the next year maximum load. It is well known that it is im- possible to pre dict the next ye ar maximu m load with high accuracy as the next day load. The next day load can be predicted with an accuracy of 1-3%. Table 1 reproduced from the previous study carried out by Qamber [7], the only difference that the popula- tion of Kingdom of Bahrain is added to the Table. In Figure 1 the relation between the maximum annual actual load versus years in Bahrain, as it shows that the load increased in the years 2009, 2010 and 2011. The load decreased in the year 2011, because the maximum temperature during year 2011 was less than the previous year increasing. The formula for such figure is as fol- lows: LoadAcP (χ) =132.5*x – 263743 (1) where: LoadAcP (χ) is the higher actual peak load (MW) χ is the year The operating maximum peak load for Kingdom of Bahrain can be found by substituti ng the year into Equa- tion (1) to find out the estimated maximum peak load for the substituted value of the year. The data for the present study are taken from a study done by Qamber [7]. Table 1. Hist or ical data f or king dom of bahrain. Year Maximum Temperature (Co) Actual Peak Load (MW) Population (k) 2009 45.7 2437 1178.415 2010 47.4 2708 1228.543 2011 45.9 2500 1224.571 2012 45.7 2948 1248.348 Figure 2 illustrates the variation combination of the maximum temperature (˚C) and actual peak load (MW) 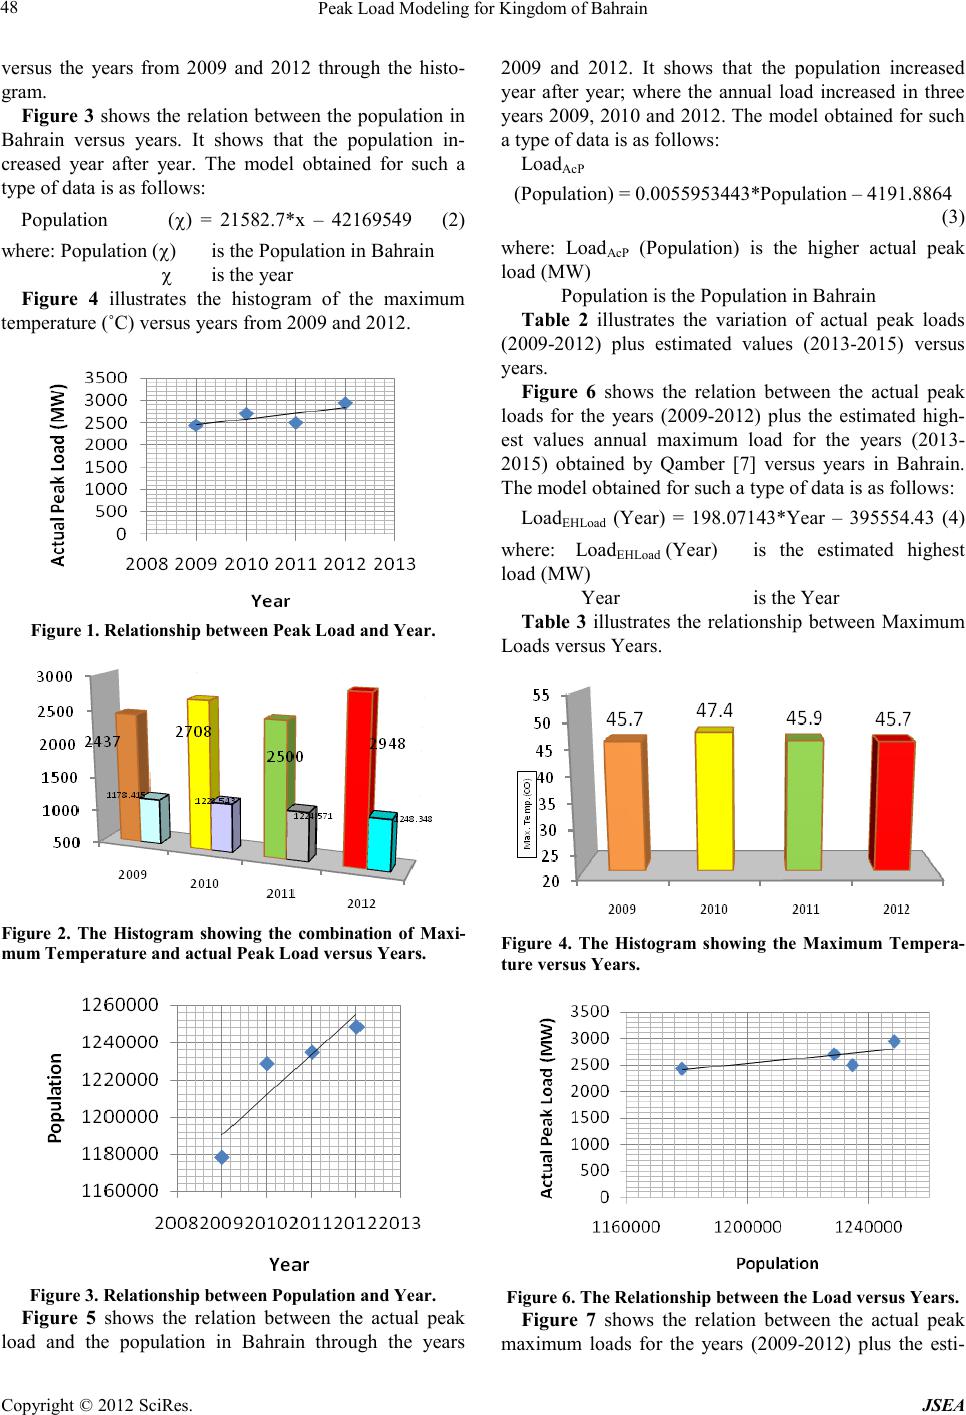 Peak Load Modeling for Kingdom of Bahrain Copyright © 2012 SciRes. JSEA 48 versus the years from 2009 and 2012 through the histo- gram. Figure 3 shows the relation between the population in Bahrain versus years. It shows that the population in- creased year after year. The model obtained for such a type of data is as follows: Populatio n (χ) = 21582.7*x – 42169549 (2) where: Population (χ) is the Populatio n in Bahrain χ is the year Figure 4 illustrates the histogram of the maximum temperature (˚C) versus years from 2009 and 2012. Figure 1. Relationship bet ween Peak L oad and Ye ar. Figure 2. The Histogram showing the combination of Maxi- mum Temperature a nd actual Peak Load versus Years. Figure 3. Relationship be tween Population a nd Year. Figure 5 shows the relation between the actual peak load and the population in Bahrain through the years 2009 and 2012. It shows that the population increased year after year; where the annual load increased in three years 2009, 2010 and 2012. The model obtained for such a type of data is as follows: LoadAcP (Population) = 0.0055953443*Population – 4191.8864 (3) where: LoadAcP (Population) is the higher actual peak load (MW) Populatio n is the Population in B a hra in Table 2 illustrates the variation of actual peak loads (2009-2012) plus estimated values (2013-2015) versus years. Figure 6 shows the relation between the actual peak loads for the years (2009-2012) plus the estimated high- est values annual maximum load for the years (2013- 2015) obtained by Qamber [7] versus years in Bahrain. The model obtained for such a type of data is as follows: LoadEHLoad (Year) = 198.07143*Year – 395554.43 (4) where: LoadEHLoad (Year) is the estimated highest load (MW) Year is the Year Table 3 illustrates the relationship between Maximum Loads versus Years. Figure 4. The Histogram showing the Maximum Tempera- ture versus Years. Figure 6. The Relationship between the Load versus Ye ars. Figure 7 shows the relation between the actual peak maximum loads for the years (2009-2012) plus the esti- 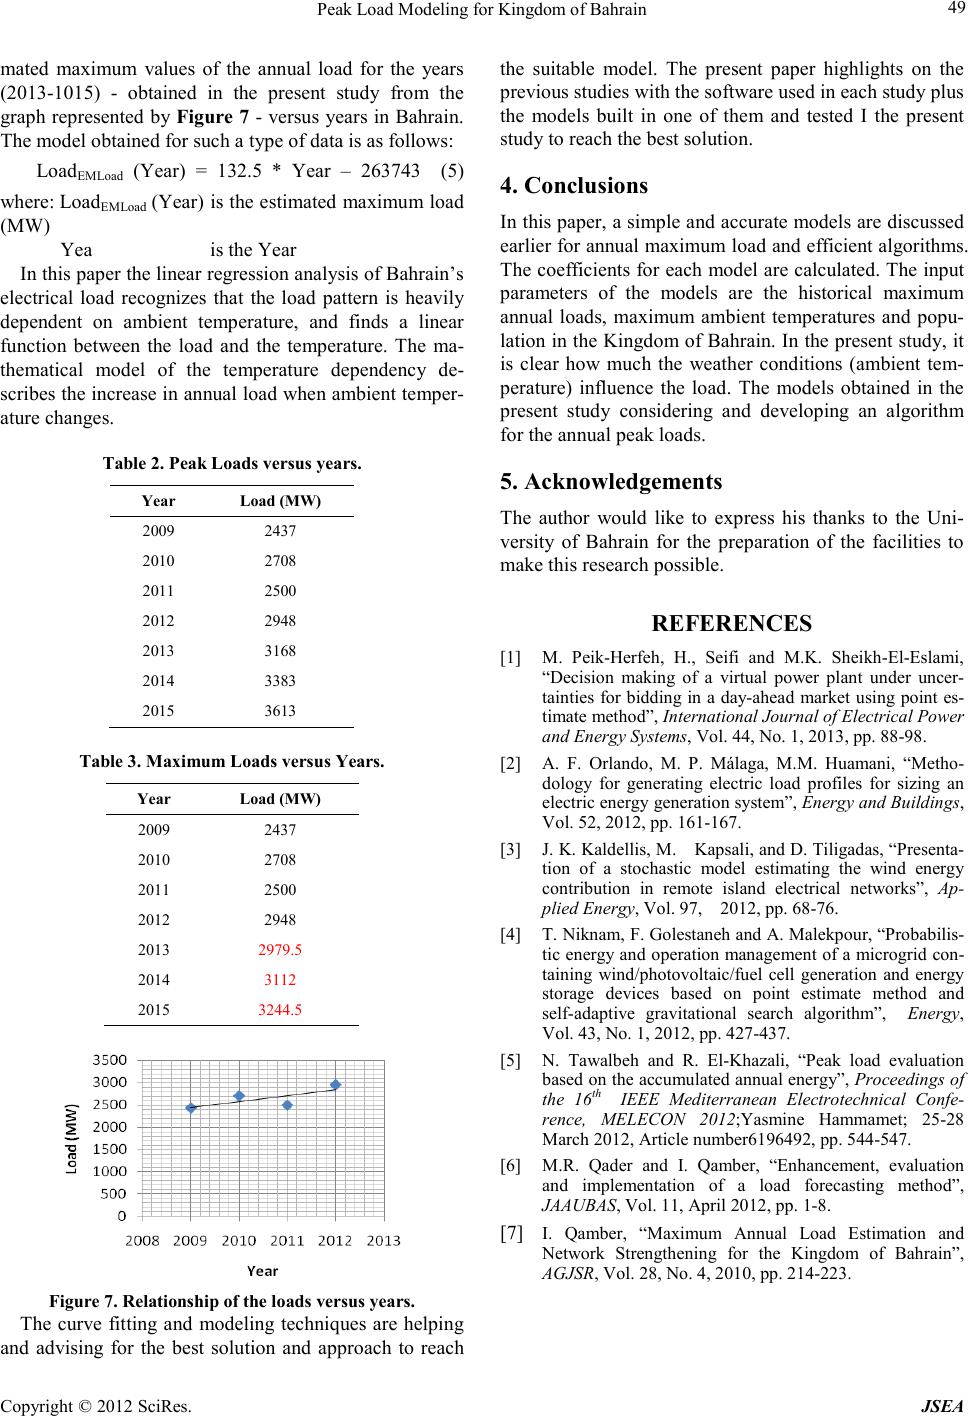 Peak Load Modeling for Kingdom of Bahrain Copyright © 2012 SciRes. JSEA 49 mated maximum values of the annual load for the years (2013-1015) - obtained in the present study from the graph represented by Figure 7 - versus years in Bahrain. The model obtained for such a type of data is as follows: LoadEMLoad (Year) = 132.5 * Year – 263743 (5) where: LoadEMLoad (Year) is the estimated maximum lo ad (MW) Yea is the Year In this p ap er the linear regression analysis of Bahrain’s electrical load recognizes that the load pattern is heavily dependent on ambient temperature, and finds a linear function between the load and the temperature. The ma- thematical model of the temperature dependency de- scribes the increase in annual load when ambient temper- ature changes. Table 2. Peak Loa ds versus y ears. Year Load (MW) 2009 2437 2010 2708 2011 2500 2012 2948 2013 3168 2014 3383 2015 3613 Table 3. Maximum Loads versus Years. Year Load (MW) 2009 2437 2010 2708 2011 2500 2012 2948 2013 2979.5 2014 3112 2015 3244.5 Figure 7. Relationship of the loads v ers us years. The curve fitting and modeling techniques are helping and advising for the best solution and approach to reach the suitable model. The present paper highlights on the previous s tud ies with the software used in each s tudy plus the models built in one of them and tested I the present study to reac h the be st so lution. 4. Conclusions In this paper, a simple and accurate models are discussed earlier for annual maximum load and efficient algorithms. The coefficients for each model are calculated. The input parameters of the models are the historical maximum annual loads, maximum ambient temperatures and popu- lation in the Kingdom of Bahrain. In the prese nt stud y, it is clear how much the weather conditions (ambient tem- perature) influence the load. The models obtained in the present study considering and developing an algorithm for the annual peak loads. 5. Acknowledgement s The author would like to express his thanks to the Uni- versity of Bahrain for the preparation of the facilities to make this research possible. REFERENCES [1] M. Peik-Herfeh, H., Seifi and M.K. Sheikh-El-Esl a mi, “Decision making of a virtual power plant under uncer- tainties for bidding in a day-ahead market using point es- timate method”, International Journal of Electrical Power and Energy Syste m s , Vol. 44, No. 1, 2013, pp. 88-98. [2] A. F. Orlando, M. P. Málaga, M.M. Huamani, “Metho- dology for generating electric load profiles for sizing an electric en erg y gen erati on syste m”, Energy and Buildings, Vol. 52, 20 12, pp. 16 1-167. [3] J. K. Kaldellis, M. Kapsali , and D. Tiligadas, “Presen ta- tion of a stochastic model estimating the wind energy contribution in remote island electrical networks”, Ap- plied Energy, V ol. 97, 2012 , pp. 68-76. [4] T. Niknam, F. Golestaneh and A. Malekpour, “Probabilis- tic energy and operation managemen t of a microgrid con- taining wind/photovoltaic/fuel cell generation and energy storage devices based on point estimate method and self-adaptive gravitational search algorithm”, Energy, Vol. 43, N o. 1, 20 12, pp. 42 7-437. [5] N. Tawalbeh and R. El-Khazali, “Peak load evaluation based o n the accumulated annual energ y”, Proceedings of the 16th IEEE Mediterranean Electrotechnical Confe- rence, MELECON 2012;Yasmine Hammamet; 25-28 March 2012, Article number6196492, pp. 544-547. [6] M.R. Qader and I. Qamber, “Enhancement, evaluation and implementation of a load forecasting method”, JAAUBAS, Vol . 11 , A pri l 2 01 2, pp. 1-8. [7] I. Qamber, “Maximum Annual Load Estimation and Network Strengthening for the Kingdom of Bahrain”, AGJSR, Vol. 28, No. 4, 20 10, pp. 214 -223. |