Journal of Biomaterials and Nanobiotechnology, 2013, 4, 17-21
http://dx.doi.org/10.4236/jbnb.2013.41003 Published Online January 2013 (http://www.scirp.org/journal/jbnb)
17
Effect of Drying Processes on the Texture of Silica Gels
Hamid Satha1*, Kamel Atamnia1, Florence Despetis2
1Laboratoire AIGM, Groupe Matériaux, Université 8 mai 1945, Guelma, Algérie; 2GES, UMR CNRS 5650, Université de Mont-
pellier II, Montpellier, France.
Email: *sathahamid@yahoo.fr
Received September 14th, 2012; revised October 20th, 2012; accepted November 7th, 2012
ABSTRACT
Peculiar xerogels and aerogels constituted by a silica network, made of spherical fully dense silica particles having the
same size, are investigated by adsorption of nitrogen at 77.4 K. Comparison of sorption data between materials dried via
different methods, gentle drying at room temperature, alcohol supercritical drying and CO2 supercritical drying, shows
that the specific surface area is associated to the particle sizes and necks established between them during drying and
not to the sample density. The dissolution-redeposition of silica, which occurs in the alcohol supercritical drying pro-
cess, induces a decrease of specific surface area and consequently an increase in the mechanical properties compara-
tively to CO2 supercritical drying. Investigating pore volume measurements as a function of dwell time, which is the
interval of time allowing a pressure change of 0.01%, we corroborate that for compliant materials the full volume can
not be detected because of capillary stresses. So the time required to perform correct measurements of the pore volume
decreases with sample bulk density increase and elastic properties increase. All these experiments qualitatively cor-
roborate the theory proposed previously.
Keywords: Nitrogen Sorption; Pore Volume; Aerogel; Alcohol Supercritical Drying; CO2 Supercritical Drying
1. Introduction
Silica xerogels and aerogels are materials exhibiting a
high porous volume. They are characterized by pores
having a size smaller than 100 nm. Moreover they are
brittle and the mechanical properties values of some pe-
culiar light aerogels can be considered as the lowest
among the family of inorganic materials.
According to the small pore sizes, gas condensation
easily occurs and induces capillary stresses. These capil-
lary stresses do not have any effect on porous materials
with acceptable mechanical properties. Conversely they
induce significant strain in the case of aerogels whose
elastic modulus is in the range of a few MPa. This strain
is easily evidenced with lightweight aerogels having a
porosity higher than 0.9. During a nitrogen adsorption-
desorption isotherm experiment a length variation results
from the compression of the sample which occurs as ni-
trogen molecules condense within the pores. This length
change has been followed using an optical device [1] and
more recently has been quantified using a linear variable
differential transducer [2]. Thus the porous volume
measured using adsorption technique is far smaller than
the true porous volume of aerogel.
Previously other causes have been evoked to explain
the discrepancy between the true and measured porous
volume. The first one concerns the range of pore size
investigated using nitrogen adsorption technique. If the
dried gel contains pores the size of which is higher than
50 nm, they will not be taken into account in the mea-
surement. This possibility does not agree with permeabil-
ity measurements which indicate that silica gels are
mainly constituted by pores of very small size.
Another possible reason for such a discrepancy comes
from the mean curvature of liquid nitrogen adsorbed on
the material surface [3]. Condensation stops if the cur-
vature reaches a value close to zero and consequently the
true porous volume is not measured [4,5].
In this paper, we investigate the effect of capillary
forces on the porous volume of peculiar gels constituted
by a silica network made of spherical fully dense silica
particles having the same size.
2. Experimental
2.1. Sample Preparation
Silica gels are obtained from a commercial colloidal sil-
ica solution called Ludox LS (Trade mark) consisting of
spherical particles of about 14 nm size. Stabilization at
pH equal to 8.2 is due to Na+ ions which are located at
the surface of dense silica particles. The calculated spe-
*Corresponding author.
Copyright © 2013 SciRes. JBNB
Effect of Drying Processes on the Texture of Silica Gels
18
cific surface area of powder is 195 m2·g1. Gelation is
performed by adding hydrochloric acid aqueous solution.
Different dilutions permit to synthesize two series of gels
at controlled pH. The samples are labeled NX or AX (N
for pH 7 and A for pH 5). X is related to the dilution and
increases when the dilution of the starting gelling solu-
tion increases.
After gelation all the gels are soaked with ethanol.
Three solvent exchanges are performed. The total solvent
exchange requires one month to obtain a gel with pores
mainly filled by ethanol. Traces of water are about 1% as
measured with Karl Fischer method.
Gels are dried using three different processes. The first
one consists in a gentle drying at room temperature. The
resulting material is a conventional xerogel. The second
one is dried in an autoclave by rising the temperature at a
rate of 100˚C/h up to 300˚C. So the pressure increases up
to 15 MPa. The duration of the depressurization step is
four hours. Materials are called alcohol supercritically
dried (SCD) aerogels. The last series of gels is dried us-
ing CO2 instead of alcohol in supercritical drying. This
treatment consists to exchange alcohol with liquid CO2 at
10˚C and 6 MPa for 2 h 30 min then increasing the auto-
clave temperature up to 50˚C and the pressure up to 10
MPa. The time of depressurization is six hours.
2.2. Nitrogen Adsorption-Desorption
Measurements
The bulk densities of samples
a are evaluated from
weight and linear dimensions. Due to the large shrinkage,
the bulk density of xerogels is less accurate than that of
aerogels. The theoretical total porous volume VPth is cal-
culated from the relation:
Pth
as
11
V

where
s is the skeletal density of silica which is 2.2
g·cm3 [6]. The porosity of this material is totally open.
The specific surface area is obtained from nitrogen ad-
sorption-desorption isotherm at 77 K using BET theory
[7]. The accuracy is about 4%. Normally for rigid porous
materials, when the nitrogen relative pressure P/Po ap-
proaches 0.99, the volume of adsorbed nitrogen must
correspond to the porous volume. We have chosen to
estimate the mean pore size using BJH theory applied to
desorption step [8]. Taking the same sample, different
runs are performed by changing the dwell time. The
equilibrium time which is imposed by the investigator, is
the interval of time allowing a pressure change of 0.01%.
It has been varied from 5 to 240 seconds.
According to previous reported recommendations [9]
adsorption nitrogen experiments are performed on small
pieces of monolithic samples. The sample weight varies
between 0.12 to 0.24 g, the lowest weight corresponding
to the lowest density in order to characterize the same
samples volumes. Samples are cut with a razor blade
from a monolithic one to avoid crushing which can result
in a partial densification of lightweight aerogels.
2.3. Young Modulus Measurements
The mechanical behaviors of samples are investigated by
the nanoindentation technique. Indentation experiments
are carried out on samples monoliths exhibiting flat sur-
faces using a home made instrumented microindentor
[10]. Typical force versus penetration depth curves are
obtained. The standard way to determine the elastic
modulus is by using the initial slope of the unloading
curve [11]. Because of the aerogels brittleness difficulties
are encountered to obtain an adjusted surface for inden-
tation, so only a few samples have been characterized.
The bulk modulus K is then calculated making use of the
relation K = E/3(12
) with the Poisson’s ratio taken to
be 0.2 [12].
3. Results
The density of samples dried under conventional condi-
tions (xerogels) varies from 1.15 to 1.3. The bulk density
of aerogels is within the range 0.19 - 0.48 g/cm3 depend-
ing on the dilution in aqueous solution of the starting
silica sol and on the supercritical drying technique. The
shrinkage of xerogels is of great extent even though the
gels analysed here are constituted by an assembly of sil-
ica spherical particles with size and shape not modified
during the drying step. Moreover, since both supercritical
drying procedures are performed on the same gel sam-
ples, it is possible to compare the densities of obtained
aerogels (Table 1). Aerogels obtained from alcohol su-
percritical drying show a slightly lower density than
those issued from CO2 supercritical drying whatever the
dilution of the starting solution allowing to prepare the
gel. This feature is not presently well understood since
CO2 is relatively inert and is expected unreactive versus
silica. We hypothesis that largest pores shrink during the
Table 1. Bulk density in g/cm3 for xerogels and alcohol or
CO2 SCD aerogels. Density values are depending on dilu-
tion and pH of the gelling solution (accuracy on the density
1%).
Alcohol SCD CO2 SCD Xerogels
N1 0.432 0.437 1.16
N2 0.404 0.426 1.15
A1 0.475 0.475 1.30
A2 0.364 0.381 1.28
A3 0.285 0.295 1.21
A4 0.241 0.235 1.22
A5 0.193 0.213 1.18
Copyright © 2013 SciRes. JBNB
Effect of Drying Processes on the Texture of Silica Gels 19
stage of depressurisation because of the previous solvent
exchange stage, between liquid alcohol and liquid CO2,
which is not complete.
The specific surface area of xerogels is nearly constant
(180 m2·g1) as a function of bulk density (Figure 1).
This value, smaller than that of isolated particles (195
m2·g1), obviously corresponds to the formation of the
network which is constituted by linked particles. Con-
cerning aerogels, the evolution of specific surface area
with bulk density exhibits two families (Figure 2). Sur-
face area values of aerogels obtained from CO2 super-
critical drying are close to those obtained for xerogels.
Contrarily aerogels issued from an alcoholic supercritical
drying show a smaller specific surface area (145 m2·g1).
The surface area lost associated to this last supercritical
drying process is about 40 m2·g1. It is worth noting that
for all the investigated series of samples the specific sur-
face area does not depend on the density. This feature
also indicates that the surface is related to the size of par-
ticles while the density mainly acts on the porous vol-
ume.
The pore size distribution of silica gel spans over the
entire range of pores measured using nitrogen adsorption
measurements. So the pore volume corresponds to pores
sizes smaller than 50 nm (mesoporosity) and its mea-
160
170
180
190
200
1.1 1.2 1.3 1.4
Specific surface area (m
2
.g
-1
)
Xerogels
(m
2
·g
-1
)
ρa (g·cm3)
Figure 1. Xerogels specific surface area as a function of
bulk density.
100
140
180
220
0.1 0.2 0.3 0.4 0.5 0.6
Specific surface area (m
2.g-1)
Alcohol SCD
CO2 SCD
CO2SCD
(m2·g-1)
ρa (g·cm3)
Figure 2. Aerogels specific surface area as a function of
bulk density: effect of drying process.
surement needs to choose adjusted adsorption-desorption
parameters.
Figure 3 exhibits the difference between two runs per-
formed on a same sample by changing the dwell time (5 s
and 240 s) between a pressure change of 104. The two
curves superimpose up to a relative pressure of 0.95.
Beyond this P/Po value, the curve characterized by a
dwell time of 240 s, give higher adsorbed volumes and
the hysteresis have different shape close to saturation.
Whereas the adsorbed volumes are different between
adsorption and desorption for the 5 s dwell time, for the
240 s dwell time, volumes are slightly identical (Figure
3(b)).
Two kinds of aerogels have been investigated chang-
ing dwell time (Figure 4). The value of the ratio Vpm/VPth
(where Vpm is the measured porous volume) becomes
constant for alcohol 0.43 sample and for a dwell time of
30 seconds. For CO2 0.44 sample the ratio increases con-
tinuously as a function of dwell time. It seems possible to
assert that equilibrium can be reached with a dwell time
about 120 s.
0
200
400
600
800
1000
00.2 0.40.60.81
Adsorbed Volume (cm
3
.g
-1
STP)
5s
240s
(cm
3
·g
-1
STP)
Relative Pressure (P/PO)
(a)
800
1000
1200
0.92 0.961
Adsorbed Volume (cm
3
.g
-1
STP)
5 s
240 s
(cm
3
·g
-1
STP)
Relative Pressure (P/PO)
(b)
Figure 3. Nitrogen adsorption-desorption isotherm of a
SCD CO2 aerogel. (a) Complete isotherm; (b) Enlargement
of the isotherm ends. Empty symbols are related to a dwell
time of 5 s after a pressure change of 0.01% and full sym-
bols to a dwell time of 240 s.
Copyright © 2013 SciRes. JBNB
Effect of Drying Processes on the Texture of Silica Gels
20
40
60
80
100
050100 150 200 250
Equilibrium time (s)
Vpm/Vpth (%)
0.44 CO2 SCD
0.43 Alcohol SCD
0.44 CO
2
SCD
Figure 4. Relaxation effects versus bulk density (dwell time
120 s). Empty symbols for CO2 SCD-Full symbols for al-
cohol SCD.
In Figure 5, Vpm/VPth is plotted as a function of bulk
density for aerogels issued from the two kinds of super-
critical drying and for a dwell time of 120 s. This figure
displays that these measurements are valid only for
highest densities and express a relaxation phenomenon
which takes place as a function of time. In order to cor-
roborate this effect, Table 2 gives bulk modulus meas-
ured for the two kinds of aerogels. We note that, for a
given density, CO2 SCD samples are less stiff.
4. Discussion
The xerogels dried at room temperature and under air
atmosphere are obtained in the shape of lumps. The spe-
cific surface area is about constant (180 m2·g1). It does
not depend on the pH (5 or 7) at which the gelation is
carried out. CO2 aerogels issued from the same gels dis-
play a surface value in the same order of magnitude. This
fact indicates that the CO2 supercritical drying does not
induce a deep change in surface area. Consequently the
surface can be mainly associated to the size of the parti-
cle keeping in mind that an area is lost between particles
at the location of necks. Moreover nitrogen molecules
cannot reach the entire surface located between linked
particles [6]. This value crudely corresponds to that esti-
mated from simple geometrical arguments [13]. Thus we
can say that the specific surface area of these silica xe-
rogels and CO2 SCD aerogels is mainly associated to the
particle size.
The surface area of alcohol SCD is about 146 m2/g.
The comparison with xerogels or CO2 SCD aerogels in-
dicates that a surface is lost during the alcohol super-
critical stage. The surface decrease is related to the solu-
bility of silica at high temperature (300˚C) and high
pressure (20 MPa) [14]. The dissolution-redeposition of
silica induces a redeposition of silica at the necks be-
tween particles and consequently an increase in the me-
chanical properties as shown in our mechanical results.
Moreover it was previously demonstrated [12] that the
Figure 5. Relaxation effects versus dwell time for two kinds
of aerogels with same bulk density. Empty symbols for CO2
SCD-Full symbols for alcohol SCD.
Table 2. Properties of silica aerogels.
Bulk density
(g·cm3) E (MPa) K (MPa)
A1: Alcohol SCD0.475 233 5 129 3
A3: Alcohol SCD0.285 22 1 12.2 0.5
A5: Alcohol SCD0.193 19 1 10.6 0.5
A1: CO2 SCD 0.475 74 4 41 2
A2: CO2 SCD 0.381 33 2 18 1
microporosity, i.e. porosity due to pores having size
smaller than 2 nm, disappears
The effect of capillary forces arising during the last in-
stants of nitrogen adsorption measurements are now bet-
ter understood [9]. The whole porous volume measured
at a relative pressure P/Po close to 1 should theoretically
correspond to real one. However due to capillary forces
associated to nitrogen condensation inside the pores, the
gel shrinks at the beginning of condensation [8]. Addi-
tionally Reichenauer and Scherer have demonstrated that
when the relative partial pressure approaches 1 an expan-
sion can be observed. It corresponds to the fact that the
capillary stresses become of a smaller extent as the cur-
vature radius of the interface liquid-vapour increases. If
the experiment is performed under usual conditions, the
expansion of gel cannot establish and consequently the
measured pore volume Vpm is much smaller than theo-
retical pore volume VPth calculated from relation (1).
The difference between the measured porous volume
Vpm and the theoretical porous volume VPth depends on
the aerogel geometrical dimensions, on its elastic modu-
lus and on the selected time for experiment. This differ-
ence, which is unequivocally related to a macroscopic
shrinkage of the aerogels, is for a given data acquisition
time obviously higher for aerogels having low density
and consequently displaying the lowest elastic properties.
We observe that for a given equilibrium time the
Vpm/VPth ratio is lower for aerogels issued from CO2 than
from alcohol. This implies that the shrinkage induced by
Copyright © 2013 SciRes. JBNB
Effect of Drying Processes on the Texture of Silica Gels
Copyright © 2013 SciRes. JBNB
21
capillary condensation is higher for CO2 aerogels for
which the network is more connected. Reichenauer and
Scherer have demonstrated that the capillary stresses
operated on the silica backbone can reach 0.1 to 0.8 MPa.
This value is high enough, comparatively to the bulk
modulus of some samples, to induce contraction upon
sorption in mesopores. However, our experiments can
not allow correcting the isotherm according to the uni-
form contraction model.
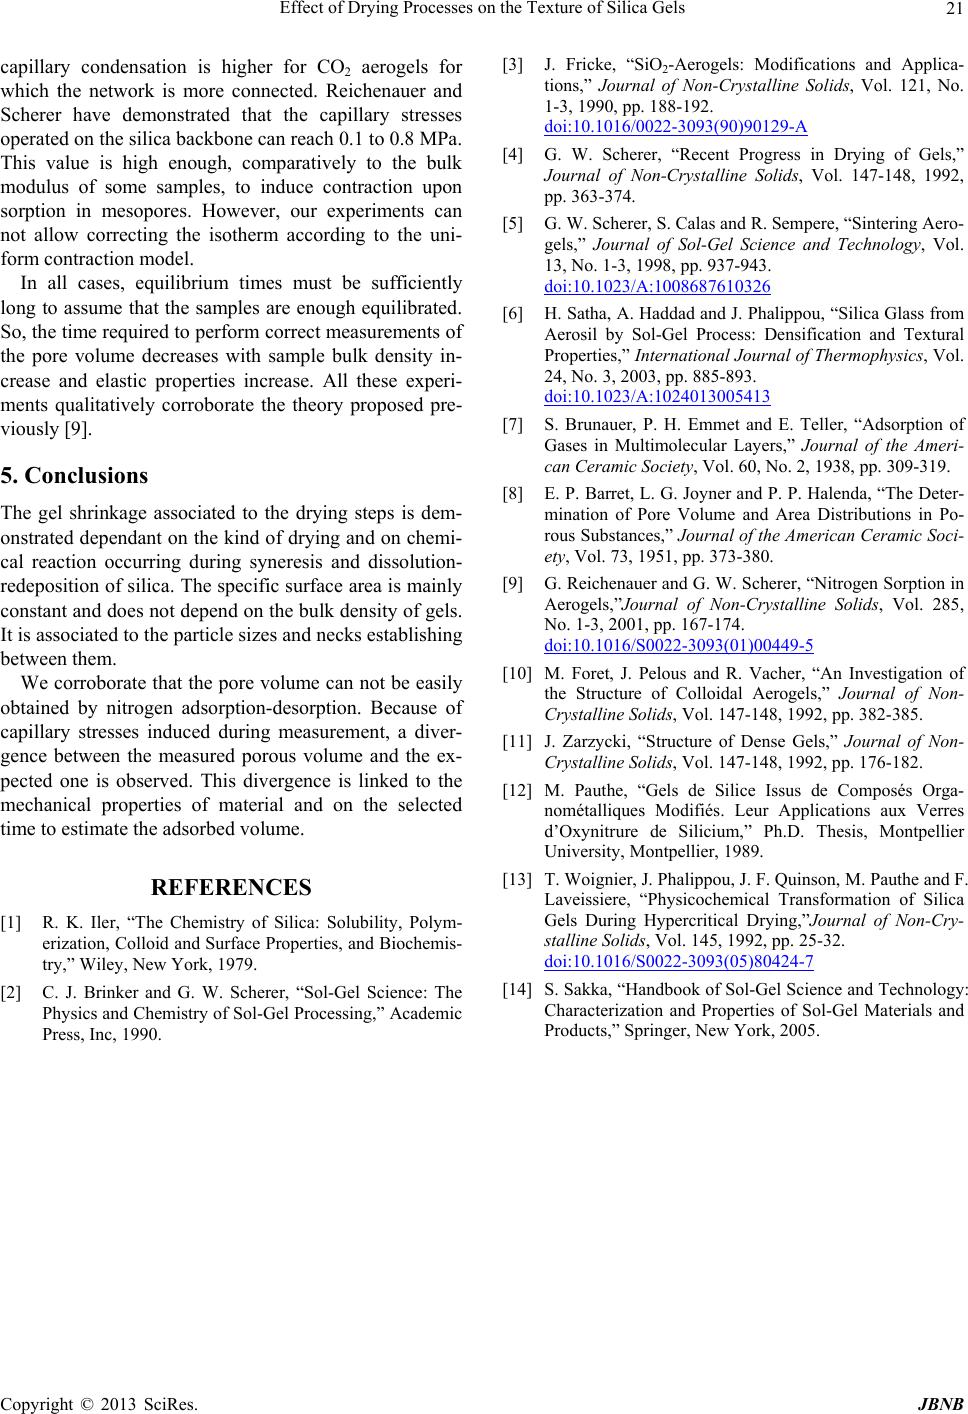
In all cases, equilibrium times must be sufficiently
long to assume that the samples are enough equilibrated.
So, the time required to perform correct measurements of
the pore volume decreases with sample bulk density in-
crease and elastic properties increase. All these experi-
ments qualitatively corroborate the theory proposed pre-
viously [9].
5. Conclusions
The gel shrinkage associated to the drying steps is dem-
onstrated dependant on the kind of drying and on chemi-
cal reaction occurring during syneresis and dissolution-
redeposition of silica. The specific surface area is mainly
constant and does not depend on the bulk density of gels.
It is associated to the particle sizes and necks establishing
between them.
We corroborate that the pore volume can not be easily
obtained by nitrogen adsorption-desorption. Because of
capillary stresses induced during measurement, a diver-
gence between the measured porous volume and the ex-
pected one is observed. This divergence is linked to the
mechanical properties of material and on the selected
time to estimate the adsorbed volume.
REFERENCES
[1] R. K. Iler, “The Chemistry of Silica: Solubility, Polym-
erization, Colloid and Surface Properties, and Biochemis-
try,” Wiley, New York, 1979.
[2] C. J. Brinker and G. W. Scherer, “Sol-Gel Science: The
Physics and Chemistry of Sol-Gel Processing,” Academic
Press, Inc, 1990.
[3] J. Fricke, “SiO2-Aerogels: Modifications and Applica-
tions,” Journal of Non-Crystalline Solids, Vol. 121, No.
1-3, 1990, pp. 188-192.
doi:10.1016/0022-3093(90)90129-A
[4] G. W. Scherer, “Recent Progress in Drying of Gels,”
Journal of Non-Crystalline Solids, Vol. 147-148, 1992,
pp. 363-374.
[5] G. W. Scherer, S. Calas and R. Sempere, “Sintering Aero-
gels,” Journal of Sol-Gel Science and Technology, Vol.
13, No. 1-3, 1998, pp. 937-943.
doi:10.1023/A:1008687610326
[6] H. Satha, A. Haddad and J. Phalippou, “Silica Glass from
Aerosil by Sol-Gel Process: Densification and Textural
Properties,” International Journal of Thermophysics, Vol.
24, No. 3, 2003, pp. 885-893.
doi:10.1023/A:1024013005413
[7] S. Brunauer, P. H. Emmet and E. Teller, “Adsorption of
Gases in Multimolecular Layers,” Journal of the Ameri-
can Ceramic Society, Vol. 60, No. 2, 1938, pp. 309-319.
[8] E. P. Barret, L. G. Joyner and P. P. Halenda, “The Deter-
mination of Pore Volume and Area Distributions in Po-
rous Substances,” Journal of the American Ceramic Soci-
ety, Vol. 73, 1951, pp. 373-380.
[9] G. Reichenauer and G. W. Scherer, “Nitrogen Sorption in
Aerogels,”Journal of Non-Crystalline Solids, Vol. 285,
No. 1-3, 2001, pp. 167-174.
doi:10.1016/S0022-3093(01)00449-5
[10] M. Foret, J. Pelous and R. Vacher, “An Investigation of
the Structure of Colloidal Aerogels,” Journal of Non-
Crystalline Solids, Vol. 147-148, 1992, pp. 382-385.
[11] J. Zarzycki, “Structure of Dense Gels,” Journal of Non-
Crystalline Solids, Vol. 147-148, 1992, pp. 176-182.
[12] M. Pauthe, “Gels de Silice Issus de Composés Orga-
nométalliques Modifiés. Leur Applications aux Verres
d’Oxynitrure de Silicium,” Ph.D. Thesis, Montpellier
University, Montpellier, 1989.
[13] T. Woignier, J. Phalippou, J. F. Quinson, M. Pauthe and F.
Laveissiere, “Physicochemical Transformation of Silica
Gels During Hypercritical Drying,”Journal of Non-Cry-
stalline Solids, Vol. 145, 1992, pp. 25-32.
doi:10.1016/S0022-3093(05)80424-7
[14] S. Sakka, “Handbook of Sol-Gel Science and Technology:
Characterization and Properties of Sol-Gel Materials and
Products,” Springer, New York, 2005.