Technology and Investment, 2013, 4, 18-23
Published Online Febr uary 2013 (http://www.SciRP.org/journal/ti)
Copyright © 2013 SciRes. TI
An Empirical Analysis of Interrelationship between
Income, Health and Entrepreneurship
Shen Shen1, Hexin Wang1, Xin Shi2
1School of Economics and Management Department, Beihang University, Beijing, China
2Business School, Manchester Metropolitan University, Manchester, UK
Email: shenshenbh@gmail.com, wanghexin@buaa.edu.cn, x.shi@mmu.ac.uk
Received 2012
ABSTRACT
This study uses a longitudinal data set from 1991 to 2008 to investigate the relationship between income, health and
entrepreneurship in the long term. Different from previous research based on cross-sectional data, our study finds that
the self-employed do not have an advantage in earnings over the employee, and the interrelation between income and
entrepreneurship is rather small in the long run. This is because incomes of the employee grow steadily over the years
while those of the self-employed fluctuate almost around a constant level. Moreover, the self-employed are in associa-
tion with better subjective well-being but worse objective health condition than the employee, largely because of the
work characteristics of the two employment options. However, the self-employed tend to visit hospital less than the
employee in spite of their poorer physical health. Based on the principal findings in this study, we provide some valua-
ble policy suggestions aimed at promoting entrepreneurship.
Keywords: Entrep re ne ur s hip ; Income; Health; Longitudinal Data
1. Introduction
Entrepreneurship has drawn more attentions from the
policymakers in recent years, due to constantly low em-
ployment rate since the latest economic crisis. In 2011,
British government successively launched two pro-
grammes to provide financial support and mentor support
for people who want to start and grow their own busi-
nesses. As an alternative to paid-employment, entrepre-
neurship could help individuals out of unemployment
status and simultaneously create extra job opportunities
in labor market. Other main advantages of entrepreneur-
ship include: the feeling of achievement, high degree of
independ enc e and potential for greater financial returns
[1]. However, the se l f-employed always have to put
more effort and time into their businesses, and thus ex-
perience more health problems [2]. This study aims to
investigate the relationship between income, health and
personal choice between entrepreneurship and
paid-employment in Britain, and provide some policy
implications for polic ymaker s.
Rees and Shan (1986) are among the earliest to ana-
lyze the relationship between employment status and
earnings, using an econometric model. And they found
that, the probability of entrepreneurship increases in
earnings differential between entrepreneurship and
paid-e mployme nt [3]. Later researches gained the same
result and considered the higher income as one of im-
portant attraction of entrepreneurship [4] [5]. However,
there are also some researchers who provided different
insight. Blanchflower and Shadforth (2007) pointed out
that, the self-em pl oyed have actually lower median in-
come than the employee, and nonpecuniary benefits,
such as job satisfaction, are the main reasons individual
chooses entrepreneurship [6]. The relationship between
health and entrepreneurship has also been discussed in
previous research. Jamal (2007) indicated the
self-empl oyed are positively associated with overall
burnout, largely because entrepreneurship is more de-
manding for personal energy [7]. Lewin-Epstein and
Yuc ht ma n -Yaar (1991) found the sel f-empl oye d have
greater risks in their lifestyle and suffer from more health
problems than the employee [8]. Besides, there are other
studies which highlight the poorer mental health among
the sel f -empl oy ed, due to the higher job stress [9] [10].
Generally, this study has two main differences from
previous research. First, former papers often base their
analysis of entrepreneurship on cross-sectional data.
However, it is more appropriate to build up a life course
model by using longitudinal data, to reflect the long-term
impact of vario us factors on entrepreneurship [11]. In
light of this insight, our study chooses to use a data sam-
ple across 18 years to trace the dynamic process of indi-
viduals in var io us so cio -economic respects. Second,
S. SHEN ET AL.
Copyright © 2013 SciRes. TI
there is little previous research into how income, health
and entrepreneurship are correlated to each other. No-
wadays, fewer and fewer people are willing to earn
higher income at the cost of health status. So it is stra-
tegically important to look into this issue.
The rest of this paper is organized as follows. Section
2 introduces the general profile of our data sample and
the methods we use to impute and model the longitudinal
data. In section 3 and 4, we conduct descriptive statistics
and model analysis respectively, to reveal the interrela-
tionship between income, health and the entrepreneur-
ship. In section 5, we put forward some suggestions on
how to promote the entrepreneurship based on the results
before. Section 6 draws conclusion and provides some
directions of further extensions.
2. Methodology
In this section, we firstly present the profile of our data
sample that is used for our analysis, and explain how we
imputed the missing data in the sample. Then we intro-
duce the statistical approach we applied to handle the
longitudinal data in our research.
2.1. Data Sample and Imputation
We use data from BHPS (British Household Panel Sur-
vey), which is designed as an annual survey since 1991
of each adult member of a nationally representative sam-
ple of more than 5,000 households, making a total of
approximately 10,000 individual interviews. In order to
reflect the long-term relationship between income, health
and self-employment, our sample contains data from
1991 to 2008. Moreover, 67 variables are selected from
BHPS for future modeling. Specifically, we employ the
subject’s employment status as the dependent variable,
which measures the choice between entre p r eneursh i p and
paid-employment. And our dependent variables incorpo-
rate income variables, health variables and other va-
riables, which are included to control for the differences
between the self-employed and the employee in other
respects.
Then we discuss the methods used to impute the
missing data. First, we only reserve the complete cases
for the dependent variables. It means any respondent
who fails to answer his/her employment status in any
year is deleted. Second, missing data on income va-
riables have been imputed in all years by BHPS. Finally,
we use LOCF (Last Observation Carried Forward) and
NOCB (Next Observation Carried Backward) to deal
with missing data on other variables. For each respon-
dent, LOCF use the last observed value of that variable
to replace the missing value, while NOCB use the next
observation. This two imputation techniques are not ex-
pected to bring bias into our statistical analysis, because
the missing data rate is between 0 and 2% on every vari-
able in our data set [12].
2.2. Modeling Approach
Different from cross-sectional data, longitudinal data set
contains repeated observed values on the same variable
for each subject across years. It is necessary to account
for the correlation between the repeated observations in
order to obtain a correct statistical result. Be sid e s, a great
deal of modeling approach only applies to the analysis
when the dependent variable is approximately Gaussian.
But our dependent variable, the choice between entr e-
pre ne urship and paid-e mp l oyme nt, is binary nominal
variable and thus non-Gaus si an.
However, the GEE (Generalized Estimating Equations)
approach could deal with the above two problems [13].
First, GEE introduces a “working ” correlation matrix to
cope with the interrelationship between observed values
within each subject across years. And it is noted that, this
matrix is not expected to be correctly specified to obtain
the consistent estimators. Second, the GEE is developed
from quasi-likelihood theory, which requires few re-
quirement about the distribution of dependent variable.
So the GEE is able to handle a great deal of distribution,
including binary variable.
For model section, we employ the QIC (Qua-
si-likelihood Information Criterion), which is a modifi-
cation to AIC (Akaike Information Criterion) to be the
effective criteria available for GEE [14]. And the best
GEE model is the one with the smallest value in QIC.
3. Descriptive Statistics
Longitudinal data set from 1991 to 2008 is derived from
BHPS. We excluded the respondents with missing data on
the dependent variable, that is the employment status, in
any years. Finally, 1303 responde nts are left in our data
set, and self-employment rate of our sample is between
11% and 16% over the 18 years.
We employ the monthly net payment to measure the
income level. It is noted that, incomes of all years are in
real term and year 2008 is the base year. In figure 1, the
average incomes of the self-employed are higher than the
employee in most of the years before 2000. However, the
income level of the employee grows steadily over time,
largely because they could create more value for their
enterpr ises with enhancement of both personal compe-
tence and social network. On the contrary, incomes of the
self-employed fluctuate around an approximately constant
level over the years. As a result, the average incomes of
the employee become higher since 2001. Figure 2 indi-
cates the self-employed have larger risk on their incomes
19
S. SHEN ET AL.
Copyright © 2013 SciRes. TI
Figure 1. Comparison of average income between the sel f-employed and the employee
Figure 2. Comparison of income uncertainty between the self-employed and the employee
than the employee, since they undertake the market un-
certainty and possibility of failure.
We use subjective well-being and objective health
condition to measure the psychological and physical
health status respectively. Subjective well-being of the
two groups is rated on scale of 0 to 12 by using 12-item
General Health Questionnaire, which is made of ques-
tions like Have you recently felt capable of making deci-
sions about things, Have you recently felt constantly
under strain, etc [15]. It is noted higher score on this
variable means worse subjective well-being. Figure 3
reveals the self-employed are better with respect to sub-
jective health status than the employee. In general, the
self-employed have the chance to make decisions about
their own businesses and confront interesting challenges
themselves. It makes the self-employed easier to have the
felling of achievement and enjoy their daily life. In con-
trast, the employee are subject to subordinate employee
position, where they have to report to their supervisors
and lack opportunity to make decision, and thus are hard-
er to experience subjective happiness.
Objective health condition measures if the subjects
have diseases, such as blood pressure, diabetes and mi-
graine, across 18 years. In figure 4, the illness rate of the
self-employed is higher than that of the employee in most
of the 18 years, and it could be attributed to the work
characteristics of the two sectors. It is generally supposed
the self-employment is associated with longer working
hours and greater job stress. Therefore, the self-employed
are inclined to be less healthy. On the other hand, the em-
ployee have standard working hours and thus, have more
time to take exercise and take care of their own health.
Figure 3. Comparison of subjective well-being between the self-employed and the employee
20
S. SHEN ET AL.
Copyright © 2013 SciRes. TI
Figure 4. Comparison of objective health condition between the self-employed and the employee
4. The Statistical Model
We use the GEE approach to model our longitudinal data
sample, and the best model is shown in table 1. Personal
employment status is used as dependent variable. The
dependent variables include income variable, health-
related variables, and other variables controlling for the
differences between the self-employed and employee in
other aspects. The QIC value of this model is -52510. In
addition, the p-values of all the estimates are less than
0.1. Therefore, all the variables in the model are signifi-
cant and have the explanatory power for the employment
status given 90% confidence.
Table 1. The GEE model
Vari ab les Estimates
Standard
errors
Inter cep t -4.880 ×10
-2
* 2.844×10
-2
Monthly net payment -2.172×10 -5*** 5 .060 ×10 -6
Subjective well-being -0.991×10 -3** 4.551×10⁻⁴
Objective health condition 1.631×10⁻²*** 4.496×10⁻³
Number of visits to hospita l -1.659×10 -2*** 2.220×10⁻³
Age 5.258×10⁻³*** 2.371×10⁻⁴
Number of children in household 1.038×10
-2
*** 2.3 30×1 0
-3
House ownership dummies
Owned outright 7.3 46×10
-2
*** 1.9 10×1 0
-2
Buying mortgage or loan 3.554×10-2* 1.815×10-2
Ren ted 3.805×10⁻²** 1.929×10⁻²
Occupation dummies
Senior officials and managers 9.322×10⁻²*** 8.507×10⁻³
Profession als 7.591×10⁻²*** 8.164×10⁻³
Technicians and associate profes-
siona ls 3.611×10⁻²*** 7.350×10⁻³
Clerk s -6.348 ×10⁻²*** 5.018×10⁻³
Skilled agricultural and fishery
workers 4.191×10⁻¹*** 2.868×10⁻²
Craft and related trades workers 1.292×10
-1
*** 8.769×10
-3
Race dummies
White -6.803×10 -2*** 1.669×10⁻²
Black 1.446×10⁻¹*** 4.290×10⁻²
Chi n ese 6.509×10⁻¹*** 6.952×10⁻²
a. *p-value<0.10; **p-value<0.05; ***p-value< 0. 01.
The coefficient of monthly net payment is negative
and small. It means the self-employed are weakly corre-
lated to lower income over the 18 years. This result is
just the opposite to the previous researches, which con-
sider the higher income is among the most attractive fac-
tors of the entrepreneurship. However, these studies are
always based on cross-sectional data set. As figure 1
shows, incomes of the employee rise steadily over the
years due to enhancement of personal capability and
probable promotion, while those of the self-employed
fluctuate almost around a constant level. This time trend
makes the employee received greater financial return
than the self-employed in the long term, even though the
incomes difference is very small.
For respondents’ health statuses, the final model in-
corporates 3 variables. The coefficient of subjective
well-being is negative. Consider low score on this varia-
ble means high well-being, it implies the self-employed
are in association with better subjective well-being. This
result is consistent with our descriptive statistics before.
Compared with the employee, the self-employed have
high degree of independence and devote themselves into
the jobs they have enthusiasm in. It would lead to better
psychological experience in daily life and hence, better
subjective well-being. In contrast, the employee have
fixed work scope and need to be evaluated by the super-
visor on their performance periodically.
The coefficient of objective health condition is posi-
tive, which reflects the employee are generally in better
shape physically than the self-employed. Previous re-
search always find the entrepreneurship a more demand-
ing status, since individuals have to put a lot of effort and
time into their own businesses, so as to cope with the
market uncertainty and pressure of failure. In the long
term, it is more likely that the self-employed would ex-
perience a decline in physical health.
However, the self-employed are associated with less
visits to hospital in general despite their poorer health
conditions. We could see from this result that, the
self-employed are always willing to make the best of
21
S. SHEN ET AL.
Copyright © 2013 SciRes. TI
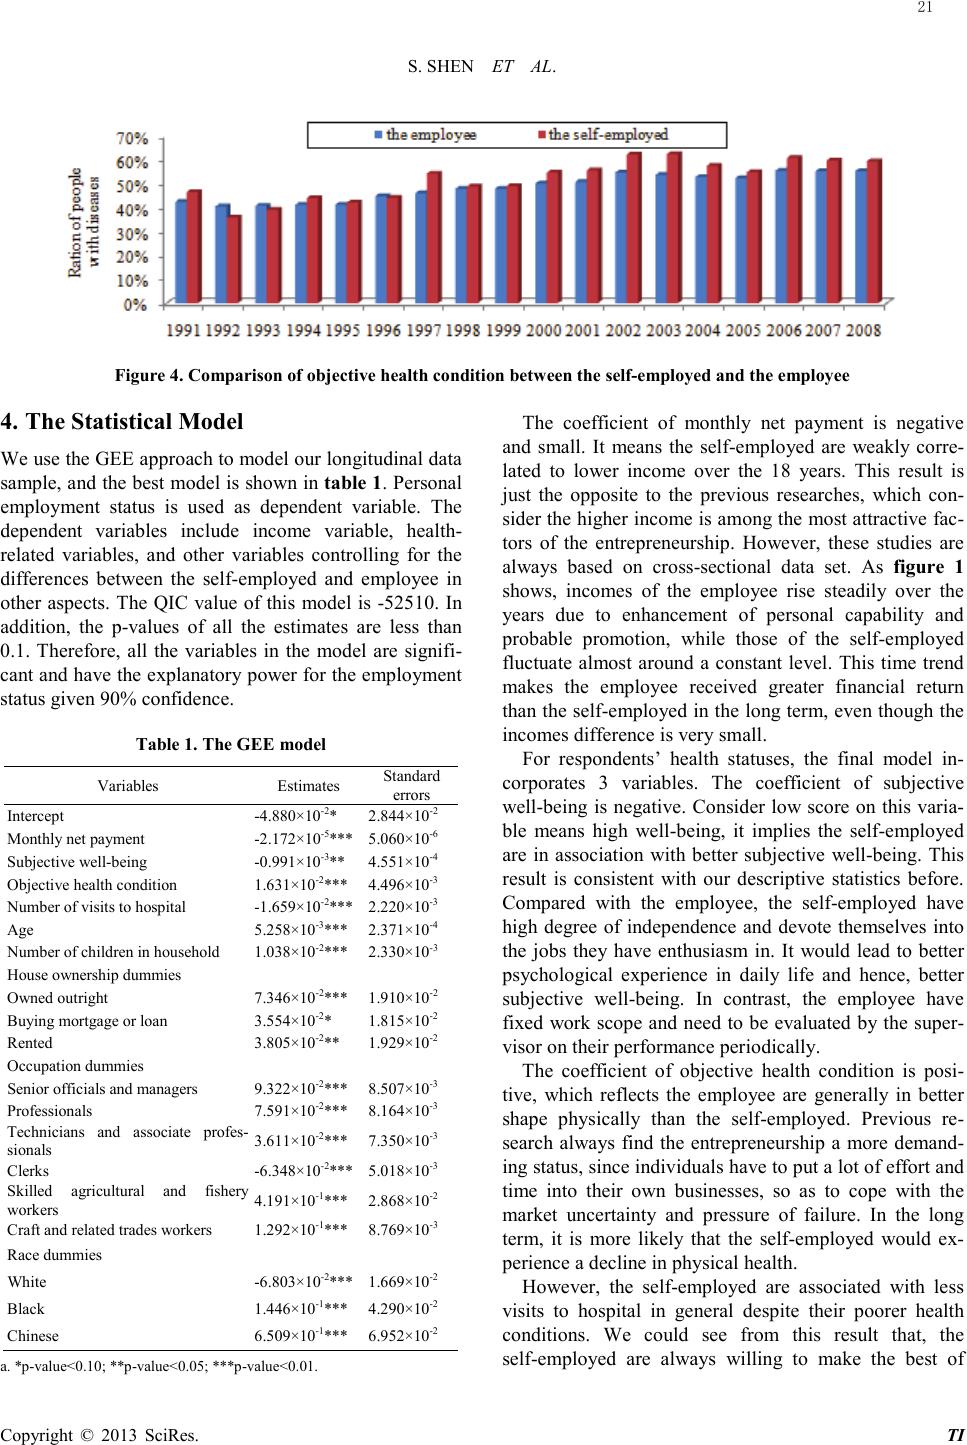
time to promote their own businesses, so they do not
want to spend their time on seeing the doctors as long as
they are able to bear the illness. For the employee, they
could visit the hospital in spare time or take a sick leave.
5. Discussion and Policy Implications
Pr o gr a mme s and policies to promote entrepreneurship
are very common in developed countries like Britain.
They take on various forms to support people with will-
ing to become self-employed, including skill training,
access to financial support and mentor support, the pro-
vision of work place, etc. In this section, we provide
some valuable policy suggestions in promoting entrepre-
neurship, based on results of the present study.
In the long run, the employee tend to get promoted and
obtain a stable growth in earnings, while the actual in-
comes of the self-employed keep almost unchanged. Be-
sides, the self-employed have higher uncertainty in earn-
ings than the employee. Therefore, individuals lack suf-
ficient economic incentives to set up their own business-
es.
To resolve this problem, some adjustments to taxation
system could be conducted, so as to improve the relative
net incomes of the self-employed to the employee. Spe-
cifically, the differences in the tax bases between the
entrepreneurship and paid-employment could be em-
ployed for this purpose [16]. For instance, tax policies
can be established to allow the self-employed to deduct
extra cost and expense from taxable income. In addition,
early research also supported that, higher marginal tax
rates are in association with higher rates of entrepre-
neurship [17]. Apart from legitimate differential in tax
bases between the two employment options, the
self-employed have more opportunities to misreport their
taxable income. And these differences could be amplified
with increase in marginal tax rate.
In terms of heath, our study shows the objective health
conditions of the self-employed are averagely worse than
the employee. However, the self-employed visit the hos-
pital less than the employee. In addition to full schedule
of the self-employed, this observation also results from
the fact that, companies always provide allowance for the
medical expenses of their employees.
Therefore, programmes aimed at improving the health
condition and providing better medical insurance for the
self-employed should be initiated. First, the communities
could run health knowledge lectures and training classes
for registered self-employed, to promote their health
consciousness. And it is also an effective way to provide
well-appointed playground at favorable price or for free,
in order to inspire their willing to take exercises. Second,
the government could provide the self-employed with a
more comprehensive health service system, which in-
cludes but is not limited to: regular physical examination,
extra allowance for medical expenses, and an exclusive
green channel to see the doctor. These measures are ex-
pected to stimulate the self-employed to visit the hospital
when they really fall sick.
6. Conclusion
In summary, our study sheds light on the long-term rela-
tionship between income, health and entr ep r e neurship.
Distinct from previous research based on cross-sectional
data, the self-e m pl oyed do not have greater returns from
work than the employee, and the association between
employment status and income is very small. In terms of
health, the sel f -emp loy ed generally experience better
subjective well-being than the employee, but are in worse
shape with respect to objective health condition. The
reason is that, the sel f-e mp loye d are free from the subor-
dinate employee position and more likely to experience
the feeling of achievement; however, the entrepreneur-
ship requires individuals to put more effort and time into
the businesses, which would result in a decline in physi-
cal health in the long run. To stimulate the entrepreneur-
ship, suggestions about improving the relative incomes
and health conditions for the self -e m pl oyed are made for
the policymakers’ references.
For future research, we find it promising to explore
the entrepreneurship in China based on our methods and
results, since the Chinese government begins to attach
more importance to the self-employment. It is expected
to provide some insights to the Chinese policymakers in
promoting entrepreneurship.
REFERENCES
[1] D. Jayawarna, J. Rouse and J. Kitching, “Entrepreneur
Motivations and Life Course,International Small Busi-
ness Journal, published online before print June 29,
2011. http://dx.doi.org/10.1177/0266242611401444
[2] M. Jamal, “Job Stress, Satisfaction, and Mental Health:
An Empirical Examination of Self-employed and
Non-self-employed Canadians,Journal of Small Busi-
ness Management, Vol. 35, No. 4, 1997, pp.
18-57. http://dx.doi.org/10.1002/jae.3950010107
[3] H. Rees and A. Sh ah, “An Empirical Analysis of
Self-Employment in the UK,Journal of Applied Eco-
nomet r ics, Vol. 1, No. 1, 1986, pp.
95-108. http://dx.doi.org/10.1002/jae.3950010107
[4] I. Bernhardt, “Comparative Advantage in
Self-employment and Paid Work,Canadian Journal of
Economics, Vol. 27, No. 2, 1994, pp.
273–289. http://dx.doi.org/10.2307/135747
[5] M. P. Taylor, “Earnings, Independence or Unemployment:
Why Become Self-employed,Oxford Bulletin of Eco-
nomics and Statistics, Vol. 58, No. 2, 1996, pp.
253–265. http://dx.doi.org/10.1111/j.1468-0084.1996.mp
58002003.x
22
S. SHEN ET AL.
Copyright © 2013 SciRes. TI
[6] D. G. Blanchflower and C. Shadforth, “Entrepreneurship
in the UK,” Foundations and Trends in Entrepreneurship,
Vol. 3, No. 4, 2007, pp.
257–264. http://dx.doi.org/10.1561/0300000017
[7] M. Jamal, “Burnout and Self Employment: A
Cross-Cultural Empirical Study,Stress and Health, Vol.
23, No. 4, 2007, pp.
249-256. http://dx.doi.org/10.1002/smi.1144
[8] N. Lewin-Epstein and E. Yuch tman-Y aar, “Health Risks
of Self-E mploymen t,Work and Occupations, Vol. 18,
No. 3, 1991, pp.
291-312. http://dx.doi.org/10.1177/073088849101800300
3
[9] R. A. Parslow, A. F. Jorm, H. Christensen, B. Rodgers, L.
Strazd ins and R. M. D'Souza, “The Associations between
Work Stress and Mental Health: A Comparison of Orga-
nizationally Employed and Self-employed Workers,
Work & Stress, Vol. 18, No. 3, 2004, pp.
231-244. http://dx.doi.org/10.1080/147497304123313186
49
[10] D. J. Prottas and C. A. Thompson, “Stress, Satisfaction,
and the Work-family Interface: A Comparison of
Self-employed Business Owners, Independents, and Or-
ganizational Employees,Journal of Occupational Health
Psychology, Vol. 11, No. 4, 2006, pp.
366-378. http://dx.doi.org/10.1037/1076-8998.11.4.366
[11] D. Jayawarna, J. Rouse and A. Macpherson, “Modeling
Pathways to Entrepr eneurship: A Life Course Perspec-
tive,” Working Paper, Manchester Metropolitan Univer-
sity Business School, 2011.
[12] J. Scheffer, “Dealing with Missing Data,Research Let-
ters in the Information and Mathematical Sciences, Vol. 3,
No. 1, 2002, pp. 153160.
[13] S. L. Zeger and K. Y. Liang, “Longitudinal Data Analysis
for Discrete and Continuous Outcomes,Biometrics, Vol.
42, No. 1, 1986, pp.
121-130. http://dx.doi.org/10.2307/2531248
[14] W. P an, “Akaike's Information Criterion in Generalized
Estimating Equations,Biom etrics, Vol. 57, No. 1, 2001,
pp.
120-125. http://dx.doi.org/10.1111/j.0006-341X.2001.001
20.x
[15] D. Goldberg and P. Williams, “A user’s guide to the
General Health Questionnaire,” 1st Edition, UK:
NFER-Nelson , Windsor, 1988.
[16] J. E. Long, “Income Taxation and the Allocation of Mar-
ket Labor,Journal of Labor Research, Vol. 3, No. 3,
1982, pp.
259-276. http://dx.doi.org/10.1007/BF02685189
[17] D. M. Blau, “A Time-Series Analysis of
Self-Employment in the United States,Journal of Polit-
ical Economy, Vol. 95, No. 3, 1987, pp.
445-467. http://dx.doi.org/10.1086/261466
23