Paper Menu >>
Journal Menu >>
 Creat ive Educati on 2012. Vol.3, Supplement, 86-89 Published Online December 2012 in SciRes (http://www.SciRP.org/journal/ce) DO I:10.4236/ce.2012.38b019 Copyright © 2012 SciRes. 86 Information Visualization (IV) Applic a tion for Information Acquisition based on Visual Perception Norasiki n Fabil1, Zawawi Ismail2, Zarina Shukur3, Shahrul Azman Mohd. Noah3, Juhana Sa li m3 1Islamic Science University of Malaysia 2University of Malaya, Malaysia 3National University of Malaysia Email: norasikinfabil@yahoo.com, zawawiismail@um.edu.my, za@ftsm.ukm.my, samn@ftsm.ukm.my js@ftsm.ukm.my Received 20 1 2 Information Visualization (IV) is a current field that has the potential to develop methods of accessing, proc essing and mana ging of infor mation (Chen & C zerwinski , 2000 ). IV applica tions are develop ed as a learning tool due to the t echnique of IV being capable of imp roving the understanding proces s through the use of vis uals. In addit ion, IV applic ations are al so abl e to manage the several dat a sources and comp lex concepts in learning activities. IV techniq ues are useful for information a cquisition a nd learni ng activit ies. Based on t he theor y of visual per cepti on, this study pr oduces a des ign of IV appli cation. The design sup- port s a partic ular unders tanding of the visua l acc ordance wit h data of the hadith en vironment . Bala nce to the vis ual design c an build a good human per ceptua l syst em to unders tand the concepts and interp ret in- format i on mor e eas i ly and a c c urat ely. The f i ndings of the s tud y sho w t he good i nt erp r eta t ion a nd t he high scor e of resp ondent s’ a chi evement t owar d us ing t he a p pli ca tion. This res ult indi c ates t hat t he c ontr ib uti on of visual perception theory as the design of the IV application can create a better visual perception and enhance the quality and q uantity of the information. Key words: Visual; Visual Perception Theory; Information Visualization (IV) Introduction Visuals have become important in communicating informa- tion in various fields. The field of advertising uses visuals as an agent to convey information effectively. Similarly, the fields of medicine, management and business are using visual materials as a tool in their operations. Similarly, in education, visuals play a ver y important role in teaching and learning as a tool for information, motivation and explanation. In the past, the use of visual was limited to printed materials; technology is a catalyst for change and development in the visual presentation of information and knowledge. Technology makes visual communication devices impart information and knowledge more quickly and effectively. The technology exists to build an environment that is more interesting and interactive in order to increase the ability of sensory points to identify rapidly and easily scan through a visual display with visual characteristics of good shape, color and composition. This introduction shows the growing use of visuals to fulfill various needs and interests. Visuals are not only seen as inter- esting, they facilitate the acquisition and understanding of in- formation in a shorter period. Use of visual is built on the theory that supports the use of faster and more effective processing. This paper discusses the study of using Information Visualization (IV) application based on visual perception theory that supports a better acquisition of information in teaching and learning purposes. Purpose o f Study The aimed of this study is to study the usability of IV appli- cation for using in Science of Hadith and to eval uate the effect of visual perception towards using of the application. Background of the Study The visuals advantages and requirements for information acquisition in Science of Hadith are discusses as the back- ground of study. The visuals contribute the design of IV appli- cation and create a better visual perception and understanding of the information inside of the application. Visuals Ability Visuals play a leading role in the dissemination of informa- tion and knowledge. Visuals can be used to convey an existing idea or to create, produce and cover new ideas. Visuals also enabl e abstract information to be conveyed more cle ar ly. Based on the use of visuals to represent and present informa- tion, visuals are usually used to describe visual concepts, ideas and processes. Even the visual splendor can be used to stimu- late in terest and effective under s tan ding. Spence (2001) gave a few ideas to state the advantages of visuals, including: • Visuals are tools for exploiting human perception. • Visual perception is a powerful and rapid exploitation. • Visual able to chan ge t he structur e of the task. • Visual cognitive change can happen to a perception by perception. • Perception by the perception that happens involves interac- tion between peop le and to create a visual rep resentatio n of the  N. FABIL ET AL. Copyright © 2012 SciRes. 87 internal view and develop an understanding of information and knowledge to be transferred. • Visual is a crystallization of information. Visual Represent the Data of Applicat ion In this study, visual ability is adapted to the environment of science of hadith. The focus is on the narrators of Hadith who present material (content of Hadith) and the sanad or chain of transmission or link between the narrators of Hadith (Atikullah, 2005; Nawer, 2003; Subhi Salih, 1993). At present, knowledge of hadith related information may be obtained in writing or electronically. But technology use in hadith sciences is still relatively limited. Material is relatively easily avail able in el ectronic for m. Source of d ata on th e narra- tor is still limited. Information can be obtained on a variety of narrators in the dictionary of narrators. While the relationship with the Hadith is something to be achieved through the Hadith books such as Sahih Muslim and Sahih al-Bukhari, information and chain of transmission (sanad) occurs through many narra- tors and their relationship is quite complex. The complex process of data acquisition took a long time. But in this study, the use of visual presentation of information is designed to reflect the knowledge of Hadith transmission. Borner et al. (2003) states that the traditional method makes it difficult for members of that knowledge to sort data based on the literature. Traditional methods involve time and increase errors and data duplication. Small (2000) also stated that the intersection of disciplines shows sensitivity to the wider review of the creative imagination and manipulation of external infor- mation or information in other fields to solve an existing prob- lem. The effort in the acquisition of knowledge of hadith is seen as an effort to preserve the well-protected sanad based on love for the traditions of the Prophet (blessings and peace be upon him). This stu dy suggests t hat each image of th e obj ect is seen with its own set of visual features. Differences in feature set of ob- jects have great impact on the identification of an object. Ob- jects that have different features to help the identification are proces sed much faster. Th e resea rcher b elieves th at in l ine with the view of Healey (2007), development of information visua- lization application need to take into account the interests of Theory of Visual Perception that show a high contribution in influencing the process of identifying visual images seen. This study suggests that appropriate visual design can assist in the identification and perception of visual information via the visualization application. Visual design can affect components of the human visual system capable of low level visual identi- fication on a regular and accurate rate of visual basic characte- ristics such as color, shape and line. Methodology The usability testing of heuristic (Hui, 2002) are the metho- dology of this study. According to Hui (2002), usability is a part of system acceptability however usability is more focused on the interface of system. Meanwhile, heuristic is one of the methods of system evaluation bases on expert evaluation that focus on the system design with the usability principles. This study uses the adaptation of usability testing and heuristic as suggested by Hui that mentioned adaptation of evaluation me- thod is needed to evaluate the applicat ion. There are 8 metrics of heu ristic evaluation whi ch are system interaction, conciseness, retention, coherence, consistency, comprehensibility, fit for audience and fit for purpose. For this study, the evaluation basis on the visual design is stated in the 5 metrics o f heurist ic which are co n ciseness, retent ion, coher ence, consistency, comprehensibility as shown in Table 1. There are t wo types o f instru ments which are surve y tow ar d s the visual design of the application after using the application and observation form towards the reflection on their learning process using the application. This study involves 241 students as respondents to respond on the metric of heuristic. Meanwhile, 20 of them are selected by randomly as respondents to respond on the effect of visual design toward learning science of hadith knowledge. Application Design of Visual Perception Theory The application design images be used to help people com- pare the target i mage with t he image environment. Humans also make comparisons based on the characteristics belonging to a visibl e image. Ther e are visual in terp retatio n process es that can be done more quickly and effectively based on the design of image development. This study suggests that appropriate design be developed to suit the type of data in the field of Hadith. The appl ication u ses a different image and in l ine with th e objecti ve of development of the application it can help identify and make reference in the interpretation of the narrator and the chain of transmission sanad as example shows in Fig ure 1 . Findings This paper discusses two types of finding. The first finding discusses on the usability of the Hadith visualization applica- tion basis on the 5 metrics of heuristic which are conciseness, retention, coherence, consistency, comprehensibility. The second finding discusses on the effect of learning science of hadith knowledge using the Hadith visualization application. Tabl e 1. Metrics of heuristic for usability evaluations. No Metrics of Heuristic Desc ription 1. Conciseness The chain of the narrator s stated prec i se l y although na r r a tor have ove r l a p sanad an d hadit h. Information displayed naturally according to hadith narrated. 2. Retention Information displayed use a simple representati on for example showing relationship between narrators use initial name, arrow mark and colou r to facilitate data mapping in mind. 3. Coherence Different window have the continuity of information. This continuity facilitates data a chievement , u nd e rstan dable, clear and easy to get overall ide a from the display. 4. Consistency Icon us age and the same features of data representation fa cilita t e u se r u n de rstan d application without any confusion. 5. Comprehensi bility Interface of application is readily understandable. Visual design support comprehension process and cha in pattern of the sa nad in ha dith dom ain. 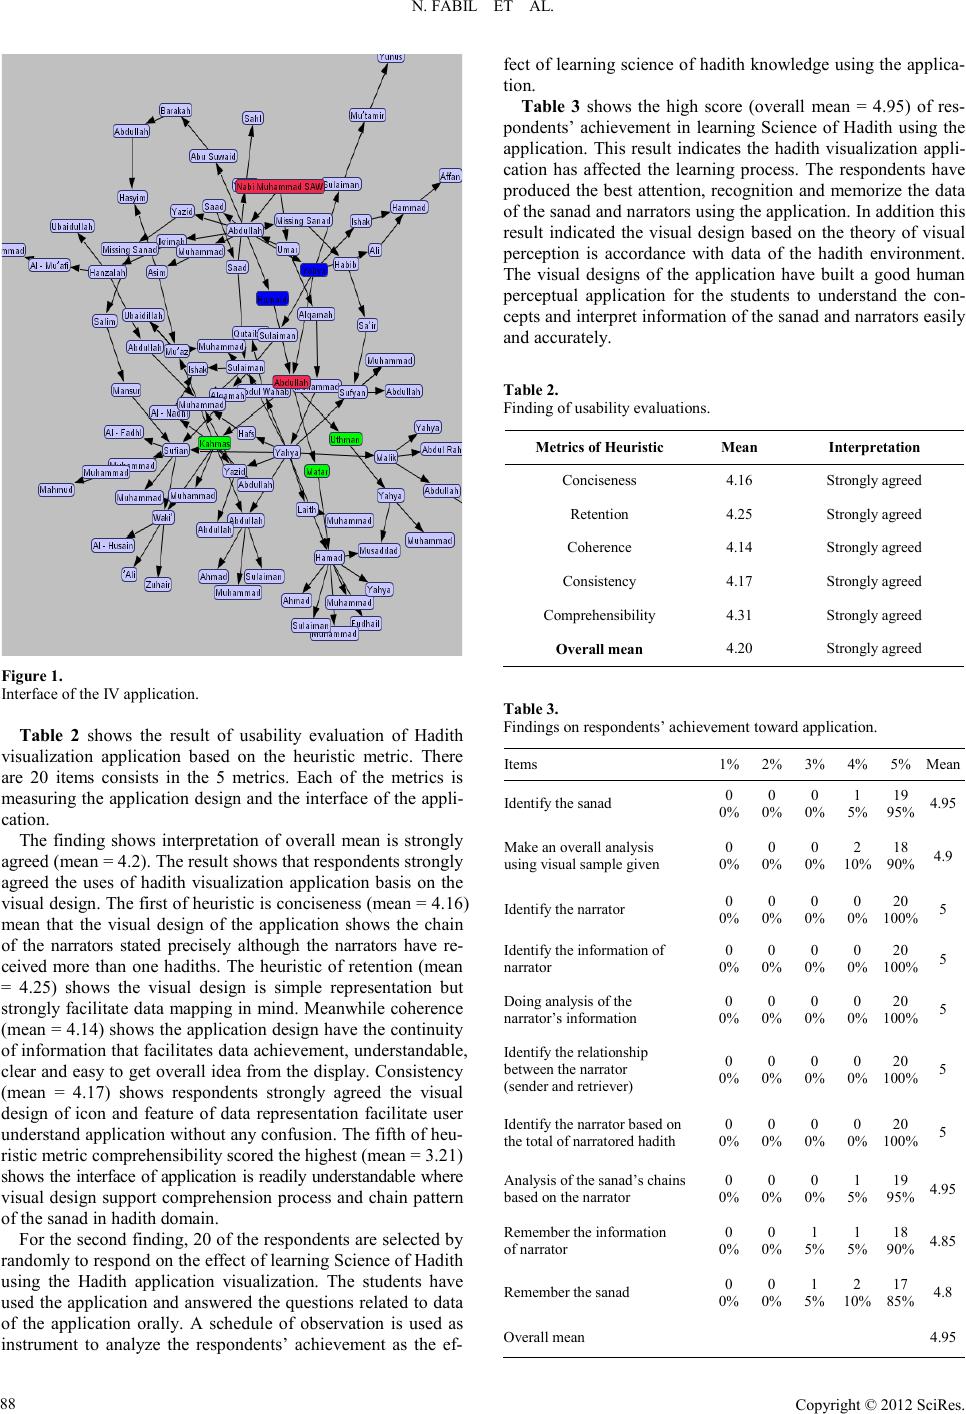 N. FABIL ET AL. Copyright © 2012 SciRes. 88 Figure 1. Inter f ace of the IV application. Table 2 shows the result of usability evaluation of Hadith visualization application based on the heuristic metric. There are 20 items consists in the 5 metrics. Each of the metrics is measuring the application design and the interface of the appli- cation. The finding shows interpretation of overall mean is strongly agreed ( mean = 4.2). The result shows that respondents strongly agreed the uses of hadith visualization application basis on the visual d esign. Th e first of heu ristic is co ncisen ess (mean = 4.16) mean that the visual design of the application shows the chain of the narrators stated precisely although the narrators have re- ceived more than one hadiths. The heuristic of retention (mean = 4.25) shows the visual design is simple representation but strongly facilitate data mapping in mind. Meanwhile coherence (mean = 4.14) shows the application design have the continuity of information that facilitates data achievement, understandable, clear and easy to get overall id ea fro m the display. Consistency (mean = 4.17) shows respondents strongly agreed the visual design of icon and feature of data representation facilitate user understand application without any confusion. The fifth of heu- ristic met r ic compreh ensibility scored the highest (mean = 3.21) shows the int erface o f applic ation is readily understandable where visual design support comprehension process and chain pattern of the sanad in hadith domain. For the second finding, 20 of the respondents are selected by randomly to respond on the effect of learning Science of Hadith using the Hadith application visualization. The students have used the application and answered the questions related to data of the application orally. A schedule of observation is used as instrument to analyze the respondents’ achievement as the ef- fect of le arning science of hadith knowledge using the applica- tion. Table 3 shows the high score (overall mean = 4.95) of res- pondents’ achievement in learning Science of Hadith using the application. This result indicates the hadith visualization appli- cation has affected the learning process. The respondents have produced the best attention, recognition and memorize the data of the sanad and narrators using the application. In addition this result indicated the visual design based on the theory of visual perception is accordance with data of the hadith environment. The visual designs of the application have built a good human perceptual application for the students to understand the con- cepts and interpret information of the sanad and narrators easily and accurately. Tabl e 2. Findin g of usability evaluations. Metrics of Heuristic M ean Interpretation Conciseness 4.16 Strongly agreed Retention 4.25 Strongly agreed Coherence 4.14 Strongly agree d Consistency 4.1 7 Strongly agreed Comprehensibility 4.31 Strongly agreed Overall mea n 4.20 St rongly agreed Tabl e 3. Findings on respondents’ achievement toward application. Items 1% 2% 3% 4% 5% Me an Identify the sanad 0 0% 0 0% 0 0% 1 5% 19 95% 4.95 Make an overall analysis using visual sample given 0 0% 0 0% 0 0% 2 10% 18 90% 4.9 Identify the narrator 0 0% 0 0% 0 0% 0 0% 20 100% 5 Identify the informa tion of narrato r 0 0% 0 0% 0 0% 0 0% 20 100% 5 Doing analysis of the narrator’s information 0 0% 0 0% 0 0% 0 0% 20 100% 5 Identify the relationship betw e en the narrato r (sender and retriever) 0 0% 0 0% 0 0% 0 0% 20 100% 5 Identify the narrator based on the total of narratored hadith 0 0% 0 0% 0 0% 0 0% 20 100% 5 Analysis of the sanad’s chains based on the nar rator 0 0% 0 0% 0 0% 1 5% 19 95% 4.95 Remember the inf o rmation of narrator 0 0% 0 0% 1 5% 1 5% 18 90% 4.85 Remember the sana d 0 0% 0 0% 1 5% 2 10% 17 85% 4.8 Overall mean 4.95 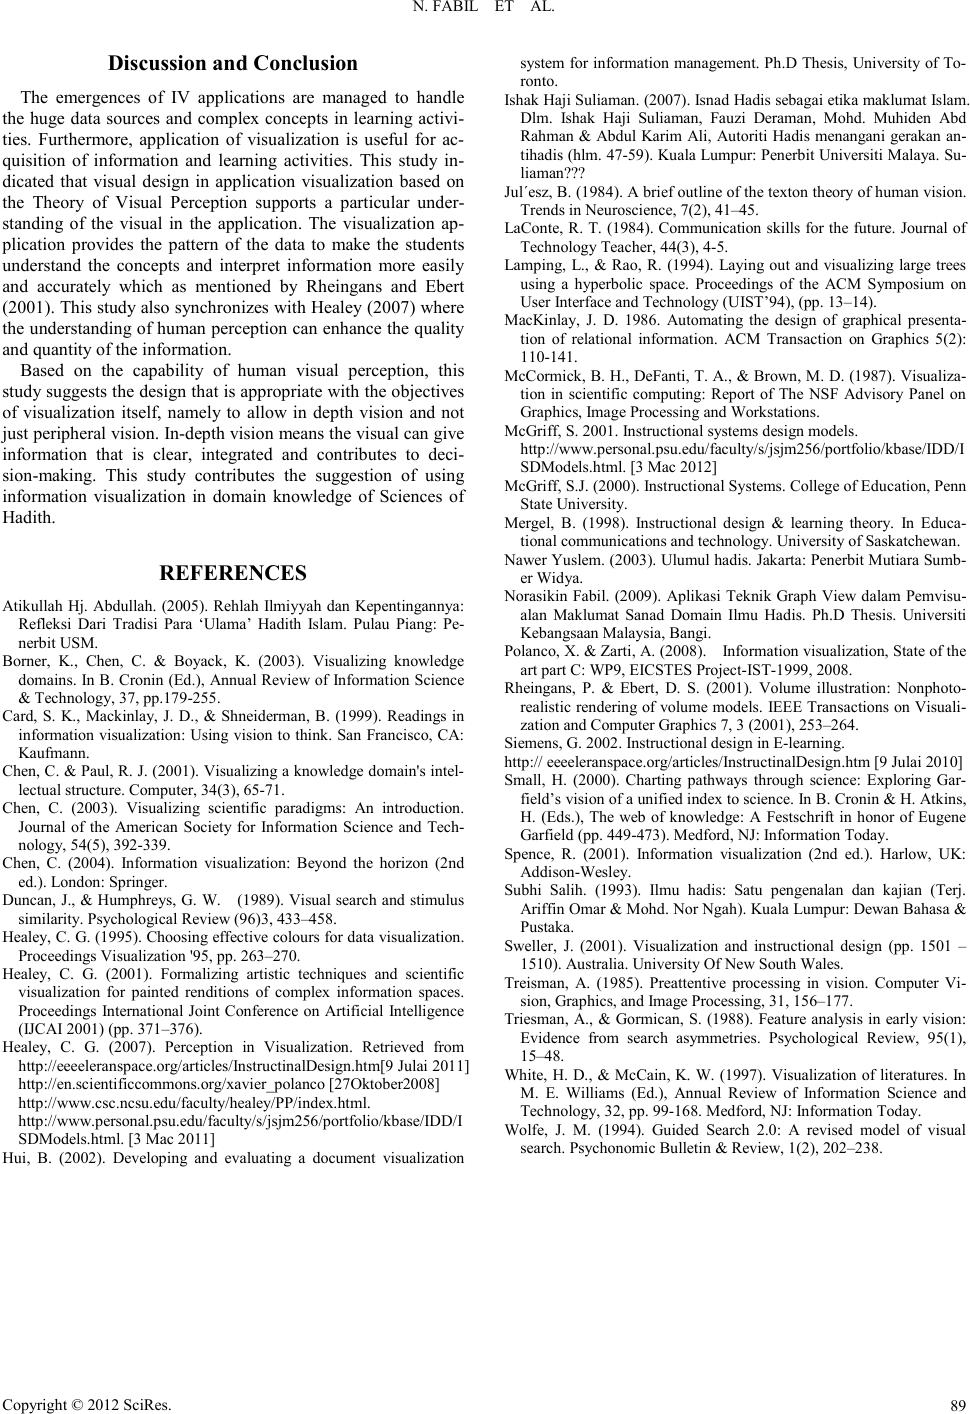 N. FABIL ET AL. Copyright © 2012 SciRes. 89 Discussion and Conclusion The emergences of IV applications are managed to handle the huge data sources and complex concepts in learning activi- ties. Furthermore, application of visualization is useful for ac- quisition of information and learning activities. This study in- dicated that visual design in application visualization based on the Theory of Visual Perception supports a particular under- stand ing of the visual in the application. The visualization ap- plication provides the pattern of the data to make the students understand the concepts and interpret information more easily and accurately which as mentioned by Rheingans and Ebert (2001). This study also synchronizes with Healey (2007) where the understanding of human perception can enhance the quality and quantity of the information. Based on the capability of human visual perception, this study suggests the design that is appropriate with the objectives of visualization itself, namely to allow in depth vision and not just peripheral vision. In-depth vision means the visual can give information that is clear, integrated and contributes to deci- sion-making. This study contributes the suggestion of using information visualization in domain knowledge of Sciences of Hadith. REFERENCES Atikullah Hj. Abdullah. (2005). Rehlah Ilmiyyah dan Kepentingannya: Refleksi Dari Tradisi Para ‘Ulama’ Hadith Islam. Pulau Piang: Pe- nerbi t U S M. Borner, K., Chen, C. & Boyack, K. (2003). Visualizing knowledge domains. In B. Cronin (Ed.), Annual Review of Information Science & Technology, 37, pp.179-255. Card, S. K., Mackinlay, J. D., & Shneiderman, B. (1999). Readings in inform ation visua lization: Using vi sion to thi nk. San Francisco, CA: Kaufmann. Chen, C. & Paul, R. J. (2001). Visualizing a knowledge domain's intel- le ctu al structure. Co m p u te r, 34(3 ) , 65-71. Chen, C. (2003). Visualizing scientific paradigms: An introduction. Journal of the American Society for Information Science and Tech- nology, 54(5), 392-339. Chen, C. (2004). Information visualization: Beyond the horizon (2nd ed.). London: Springer. Duncan, J., & Humphreys, G. W. (1989). Visual search and stimulus similarity. Psychological Review (96)3, 433–458. Healey, C. G. (1995 ). Choosi ng effect ive colou rs for dat a visuali zati on. Proceedings Visualization '95, pp. 263–270. Healey, C. G. (2001). Formalizing artistic techniques and scientific visualization for painted renditions of complex information spaces. Proceedings International Joint Conference on Artificial Intelligence (IJCAI 2001) (pp. 371–376). Healey, C. G. (2007). Perception in Visualization. Retrieved from http://eeeeleranspace.org/articles/InstructinalDesign.htm[9 Julai 201 1] http://en.scientificcommons.org/xavier_polanco [27Oktober2008] http://www.csc.ncsu.edu/faculty/healey/PP/index.html. http://www.personal.psu.edu/faculty/s/jsjm256/portfolio/kbase/IDD/I SDModels.html. [3 Mac 2011] Hui, B. (2002). Developing and evaluating a document visualization system for informa tion managemen t. Ph.D Thesis, Uni versity of To- ronto. Ishak Haji Suliaman. (2007). Isnad Hadis sebagai etika maklumat Islam. Dlm. Ishak Haji Suliaman, Fauzi Deraman, Mohd. Muhiden Abd Rahman & Abdul Karim Ali, Autoriti Hadis menangani gerakan an- tihadis (hlm. 47-59). Kuala Lumpur: Penerbit Universiti Malaya. Su- liaman??? Jul´esz, B. (1984). A brief outline of the texton theory of human vision. Tre nds in Neuroscie nce, 7( 2) , 41–45. LaConte, R. T. (1984). C ommunication skills for the future. Journal of Te c hno logy Teache r , 44( 3) , 4-5. Lamping, L., & Rao, R. (1994). Laying out and visualizing large trees using a hyperbolic space. Proceedings of the ACM Symposium on User Interface and Technology (UIST’94), (pp. 13–14). MacKinlay, J. D. 1986. Automating the design of graphical presenta- tion of relational information. ACM Transaction on Graphics 5(2): 110-141. McCormick, B. H., DeFanti, T. A., & Brown, M. D. (1987). Visualiza- tion in scientific computing: Report of The NSF Advisory Panel on Graphics, Image Processing and Workstations. McGriff, S. 2001. Instructional systems design models. http://www.personal.psu.edu/faculty/s/jsjm256/portfolio/kbase/IDD/I SDModels.html. [3 Mac 2012] McGriff, S.J. (2000). Instructional Systems. College of Education, Penn State University. Mergel, B. (1998). Instructional design & learning theory. In Educa- tional communic ations and technology. Uni vers ity of Sask atchewan. Nawer Yuslem. (2003). Ulumul hadis. Jakarta: Penerbit Mutiara Sumb- er Widya. Norasikin Fabil. (2009). Aplikasi Teknik Graph View dalam Pemvisu- alan Maklumat Sanad Domain Ilmu Hadis. Ph.D Thesis. Universiti Kebangsaan Malaysia, Bangi. Polanco, X. & Zarti, A. (2008). In formation visualization, State of the art part C: WP9, EICSTES Project-IST-1999, 2 008. Rheingans, P. & Ebert, D. S. (2001). Volume illustration: Nonphoto- realisti c renderin g of volume models. IEEE Transa ctions on Visuali- zation and Compute r G r a phic s 7, 3 (2 00 1) , 2 53 –264. Siemens, G. 2002. Instructional design in E-learning. http:// eeeeleranspace.org/articles/InstructinalDesign.htm [9 Julai 2010] Small, H. (2000). Charting pathways through science: Exploring Gar- field’s vi si on of a uni fied ind ex to science. In B. Croni n & H. Atkins , H. (Eds.), The web of knowledge: A Festschrift in honor of Eugene Garfield (pp. 449-473). Medford, NJ: Informat ion Today. Spence, R. (2001). Information visualization (2nd ed.). Harlow, UK: Addison-Wesley. Subhi Salih. (1993). Ilmu hadis: Satu pengenalan dan kajian (Terj. Ariffin Omar & Mohd. Nor Ngah). Kuala Lumpur: Dewan Bahasa & Pustaka. Sweller, J. (2001). Visualization and instructional design (pp. 1501 – 1510). Australia. University Of New South Wales. Treisman, A. (1985). Preattentive processing in vision. Computer Vi- sion , Graphics, and Image Processin g, 31, 156–177. Trie sman, A., & Gormican, S. (1988). Feature analysis in early vision: Evidence from search asymmetries. Psychological Review, 95(1), 15–48. White, H. D., & McCain, K. W. (1997). Visualization of literatures. In M. E. Williams (Ed.), Annual Review of Information Science and Te c hno logy, 32, pp. 99-168. Medford, NJ: Informa tion Tod ay. Wolfe, J. M. (1994). Guided Search 2.0: A revised model of visual search. Psychonomic Bulletin & Review, 1(2), 202–238. |