Paper Menu >>
Journal Menu >>
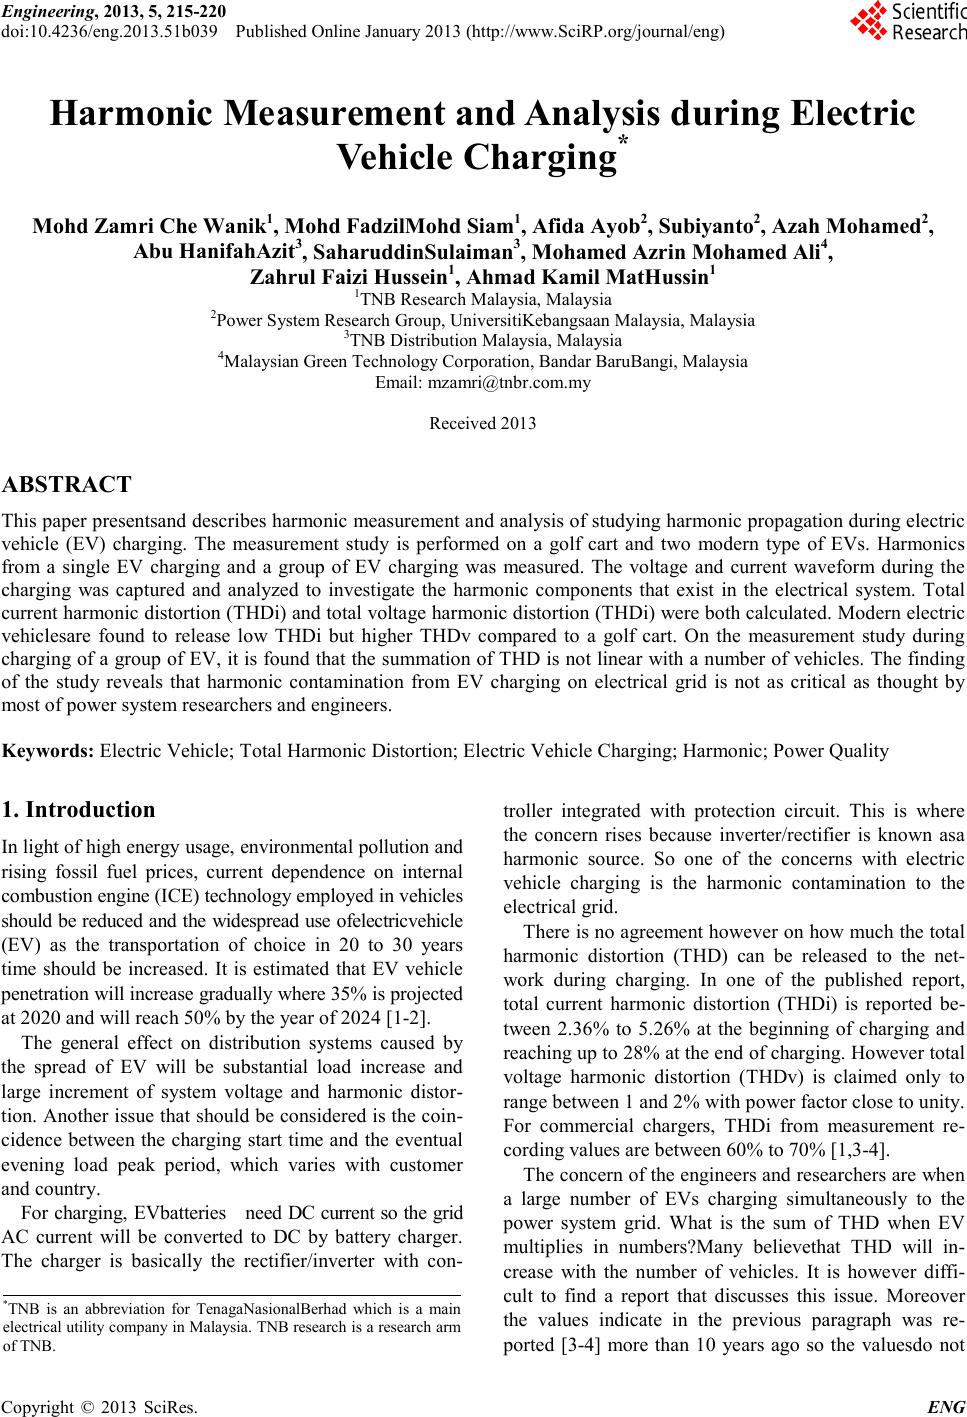 Engineering, 2013, 5, 215-220 doi:10.4236/eng.2013.51b039 Published Online January 2013 (http://www.SciR P.org/journal/eng) Copyright © 2013 SciRes. ENG Harmonic Measurement and Analysis during Electric Vehicle Char ging* Mohd Zamri Che Wanik1, Mohd FadzilMohd Siam1, Afida Ayob2, Subiyanto2, Azah Mohamed2, Abu HanifahAzit3, SaharuddinSulaiman3, Mohamed Azrin Mohamed Ali4, Zahrul Faizi Hussein1, A h mad Kamil MatHussin1 1TNB Research Malaysia, Mala ysia 2Power System Research Grou p, Universi tiKebangsaan Malaysia, Malaysia 3TNB Distribution Malaysia, Malaysia 4Malaysian Green Technology Corporation, Bandar BaruBangi, Malaysia Email: mzamri@tnbr.co m.my Received 2013 ABSTRACT This paper presentsand describes harmonic measurement and analysis of studying harmonic propagation during electric vehicle (EV) charging. The measurement study is performed on a golf cart and two modern type of EVs. Harmonics from a single EV charging and a group of EV charging was measured. The voltage and current waveform during the charging was captured and analyzed to investigate the harmonic components that exist in the electrical system. Total current har monic distortio n (THDi) and total volta ge harmo nic distortion (T HDi) were both calc ulated. Mod ern electric vehiclesare found to release low THDi but higher THDv compared to a golf cart. On the measurement study during charging of a group of EV, it is found that the summation of THD is not linear with a number of vehicle s. T he finding of the study reveals that harmonic contamination from EV charging on electrical grid is not as critical as thought by most of power system researchers and engineers. Keywords: Electric Vehicle; Total Harmonic Distortion; Electric Vehicle Charging; Harmonic; Power Quality 1. Introduction In l igh t o f hi gh e ner gy usa ge, e nvir on me ntal po llut io n a nd rising fossil fuel prices, current dependence on internal combustion engine (ICE) technology employed in vehicles should be red uced and t he widespread use ofelectricvehic le (EV) as the transportation of choice in 20 to 30 years time should be increased. It is estimated that EV vehicle penetration will increa se gradually where 35% is proj ected at 2020 and will reach 50% by the year of 2024 [1-2]. The general effect on distribution systems caused by the spread of EV will be substantial load increase and large increment of system voltage and harmonic distor - tion. Anot her is sue t hat s hould be co nsider ed is t he coi n- cidence between the charging start time and the eventual evening load peak period, which varies with customer and c ountry. For charging, EVbatteries need DC current so the grid AC current will be converted to DC by battery charger. The charger is basically the rectifier/inverter with con- troller integrated with protection circuit. This is where the concern rises because inverter/rectifier is known asa harmonic source. So one of the concerns with electric vehicle charging is the harmonic contamination to the electrical grid . The re is no agreeme nt howe ver on how muc h the to tal harmonic distortion (THD) can be released to the net- work during charging. In one of the published report, total current harmonic distortion (THDi) is reported be- tween 2.36% to 5.26% at the beginning of charging and reaching up to 28% at the end of charging. However total voltage harmonic distortion (THDv) is claimed only to range between 1 and 2% with power factor close to unity. For commercial chargers, THDi from measurement re- cording values are between 60% to 70% [1,3-4]. The concern of the engineers and researchers are when a large number of EVs charging simultaneously to the power system grid. What is the sum of THD when EV multiplies in numbers?Many believethat THD will in- crease with the number of vehicles. It is however diffi- cult to find a report that discusses this issue. Moreover the values indicate in the previous paragraph was re- ported [3-4] more than 10 years ago so the valuesdo not * TNB is an abbreviation for TenagaNasionalBerhad which is a main electrical utility company in Malaysia. TNB research is a research arm of TNB.  M. Z. C. WANIK ET AL. Copyright © 2013 SciRes. ENG 216 represent the actual amount ofharmonic generated from state-of-the-art charger technologies that is used in mod- ern electric vehicles. The study re port ed in this p aper tries to investigate the harmonic distortion from a single EV and a group of EVs. The measurement was performed on an older type of EV and two modern types of EV. The results of the study is usef ul in und ersta nding t he ha rmonic d istor tion co ntri bu- tion from EV connected to t he grid for charging. This pap er is organized as follo w. First EV technolo gy is briefly reviewed.The harmonic distortion limit then highlighted. Harmonic measurement during a single ve- hicle charging is then presented. Finally the harmonic distortion during charging of a group of EV is discussed and commented. 2. Electric Vehicle Technology Electric vehicle that will be seen creating issues on the power system gridwill be of two types. First type is plug in hybrid where there is a combinat ion o f IC E a nd b atter y. The second type will be all electric vehicle where this vehicle depends solely on battery. For both types of EV, electrical power is needed from the grid for charging. Example of typical PHEV hardware arrangement is depicted in Figure 1. This is for parallel type of PHEV. There is also series type of PHEV but the focus of this paper is on the grid connection issue so it is not impor- tant if the EV is of parallel or series type. For all electric vehicle, the components in the light green dash lines are not needed and removed leaving only batteries, charger, po wer electronic drive and propulsion electric motor. When EV is charging, the only active compo nents are charger and battery because EV is not moving. For grid inter fac i n g st ud ies, the EV can be represented electrically as depicted in Figure 2. Battery charger is basically a rectifier which converts AC current from the grid to DC current to charge the battery. The rectifier is normally of active type where the power electronic devices are em- ployed for switching devices. In this diagram power electronic devices are IGBT. Figure 1. PHEV typical layout [5]. Figure 2 . Battery charg er circ uit diagram [6]. EV charger is normally of conductive type eventhough inductive type is available. Conductive chargers have direct plug-in connection to the supply e.g. using an ex- tension power cord to plug form the wall outlet into the EV. Inductive charger on the other hand use magnetic coupling as a mode of energy transfer. Comparing these two types, conductive charger is simpler to design, hav- ing higher efficiency and more popular. 3. Harmonics Distortion Limit Harmonicsdistortion has detrimental effects on elec- trical equipment inside power system.Severity of har- monic is determined by the percentage of total harmonic voltage distortion. Harmonic voltage is referred to as a sinusoidal voltage having frequency equal to an integer multiple of the fundamental frequency of 50/60 Hz supply. Total harmonic distortion is calculated as fol- lows[7]: 40 2 2 1 () h h u U THD U = = ∑ (1) 40 2 2 1 () h h i I THD I = = ∑ (2) In Ma la ysi a, t he ma in uti l it y co mpa n y, T enaga Na sional Berhad, has set a limit on total harmonic voltage distor- tion according to voltage level as tabulated in Table 1. For current there is no distortion li mit set. 4. Harmonic Measurement A few field measurement activities were conducted in- vestigatethe har monic d uri ng E V cha rgi ng. T he mea sure - ment is performed using Fluke power quality meter. The picture of the meter is portrayed in Figure 3. The meter has the ca pa bi lit y t o d ir ect ly d i spl a y th e vol ta ge a nd cur re nt waveforms in real time. In addition, the measurement 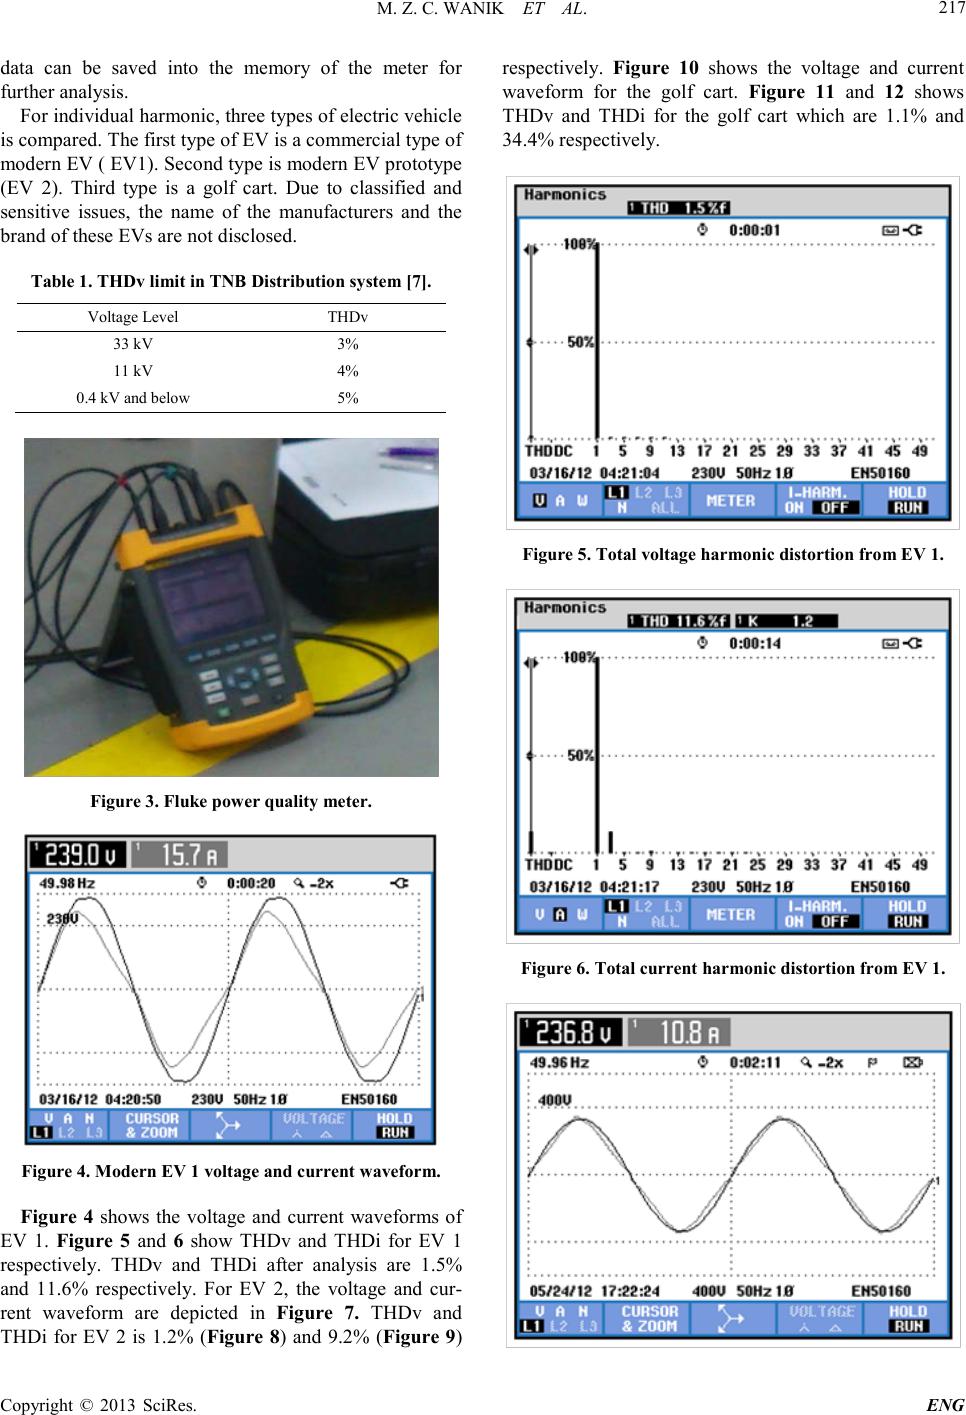 M. Z. C. WANIK ET AL. Copyright © 2013 SciRes. ENG 217 data can be saved into the memory of the meter for further a nalysis. For individ ual har monic, thre e types of electric vehicle is compared. The first type of EV is a commercial type of modern EV ( EV1). Second type is modern EV prototype (EV 2). Third type is a golf cart. Due to classified and sensitive issues, the name of the manufacturers and the brand of these EVs are not disclosed. Table 1. THDv limit in TNB Distribution system [7]. Volta ge Lev el THDv 33 kV 3% 11 kV 4% 0.4 kV and bel ow 5% Figure 3 . Fluke power quality met er. Figure 4 . Modern EV 1 voltage and current waveform. Figure 4 shows the voltage and current waveforms of EV 1. Figure 5 and 6 show THDv and THDi for EV 1 respectively. THDv and THDi after analysis are 1.5% and 11.6% respectively. For EV 2, the voltage and cur- rent waveform are depicted in Figure 7. THDv and THDi for EV 2 is 1.2% (Figure 8) and 9.2% (Figure 9) respectively. Figure 10 shows the voltage and current waveform for the golf cart. Figure 11 and 12 shows THDv and THDi for the golf cart which are 1.1% and 34.4% respectively. Figure 5. Total voltag e harmonic distortion from EV 1. Figure 6 . Total current harmon ic distorti on from EV 1.  M. Z. C. WANIK ET AL. Copyright © 2013 SciRes. ENG 218 Figure 7 . Modern EV 2 voltage and current waveform. Figure 8. Modern EV 2 total voltage harmonic distortion. Figure 9. Modern EV 2 total voltage harmonic distortion. Figure 1 0. Gol f cart voltage and current waveform. The measurement results reveal that the THDi from chargers is low for modern EV but for THDv, modern EV is releasing higher distortion. The lower THDv fro m golf cart can be explained due to lower current magni- tude drawn during the charging. For modern EV, even though THD i is lower, T HDv i s hig her than measured for golf cart. This is due to higher current magnitude drawn by modern EV. 5. Harmonic From a Group of EV In the previous sectio n, THDv measured from a single EV was presented. The value was recorded lower than limit set b y utility. B ut the concern o n harmonic is when a group of EVs connected to the grid simultaneously for char ging. T here a re many eng ineer s who tho ught tha t the summation of THD from a group of EVs is linear with the sum of EV.To find out the answer, a measurement is performed to measure THD from a group of EVs. In Malaysia, modern EV is not yet commercialized so the study cannot be performed on the commercial EVs. But there are many golf carts available which can be used i n the st udy. T he resul ts wil l not re prese nt the mod- ern EV harmonic but the main objective is to investigate the sum of THD from a single EV and a group of [EV]. Figure 11. Golf cart total voltage harmonic distortion.  M. Z. C. WANIK ET AL. Copyright © 2013 SciRes. ENG 219 Figure 12. Golf cart total current harmonic distortio n. The measurement was performed at a golf club at Universiti Kebangsaan Ma laysia. The measurement was car ried out o n a worki ng day. O n that day, it was ra ining from early morning until 10:00 am. But the golfing activi- ties were active where all golf carts left the charging point by 9.00 am. The first golf cart returned to charging station after 11 am. The time, number of vehicle, and the line where they are connected are detailed in Table 2. The measured quant iti es ar e voltage a nd cur rent harmoni cs distortion. The measurement data was recorded initially every one hour interval until 6:00 pm. Starting at 7:00 pm, the golf cart start to arrive more often so the measure- ment was taken for every 15 minut es. The data are visualized through a graph as shown in Figure 14 for TH Dv a nd Fig ure 15 for THDi. Instead of time, the number of vehicles is used for x-axis to facili- tate the pattern of consumption from these EV. The line where these golf carts are connected were also identified. The consumption starts to increase substantially starting from 6:30 pm (18:30 hrs) when golfers start to return the golf cart to the pick-up point. Figure 13. Golf Club distr ibution Circuit. Table 2. Time, number of vehicl e and conne ction. Tim e Number of Ve- hicle Connection L1 L2 L3 11:00 0 0 0 0 12:00 1 1 0 0 13:00 1 1 0 0 14:00 1 1 0 0 15:00 1 1 0 0 16:00 2 2 0 0 17:00 3 3 0 0 18:00 0 0 0 0 18:30 6 4 2 0 18:45 12 4 4 4 19:00 16 8 4 4 19:15 18 8 6 4 19:30 20 8 8 4 19:45 22 8 8 6 Figure 14. Measure d THD v dur i ng moni t ori ng . Figure 15. Measured THDi duri ng charging. The T HD is also measur ed b oth for voltage a nd c urrent as shown respectively in Figure 14 and Figure 15. Event hough T HDv for e ach single vehicle was measured 1.1% but a PCC, the value is only 0.7% for onevehicle. With the increaseof vehicles connected, the THDv stea- dily increase. For eight vehicles on L1, the recorded THDv is only 1.9%. For THDi of one vehicle, THDi 34.4% is recorded but at PCC, THDi is recorded 47.8%. With the increment of golf cart charging the THDi value at PCC decrease to 16.6% for 3 vehicles but increase again for12 vehicles. Surprisingly THDi do not increase much when vehicle increase from 16 to 22 on L1. 6. Conclusion In thi s paper, the harmonic measurement study and anal- ysis during electric vehicle charging is presented. The measurement is performed on golf carts and two modern types of EV. T he meas ureme nt result shows t hat mod ern EV release lower THDi compared to a golf cart which i s expected. Unfortunately for THDv, modern EV cause higher percentage of distortion. For a group of EV char gin g, THD fo r both voltage and current are found not  M. Z. C. WANIK ET AL. Copyright © 2013 SciRes. ENG 220 to be the dir ect summation o f the TH D fro m a single ve- hicle . The re sults o f the stud y areus eful in underst anding the harmonic distortion contribution from EV connected to the grid for charging. 7. Acknowledgements Thi s inve s ti ga tio n st udy is part of a project jointl y carried out by TNB Research Malaysia, UniversitiKebangsaan Malaysia, TNB Distribution Malaysia and Malaysian Gree n Tec hnolog y Corp orat ion. T he proj ect i s funded by TNB Research Malaysia through funding TNBR/RD55/ 2012 and partly supported by UniversitiKebangsaan Ma- laysia via research grant GGPM-2011-071. REFERENCES [1] R. Liu, L. Dow and E. Liu, “A survey of PEV Impact on Electric Utilities,”IEEE PES Innovative Smart Grid Technologies Conference, January, 17-19, 2011, Anaheim, CA, USA [2] EPRI, “Environmental Assessment of Plug-In Hybrid Electri c Vehi cles,” Techn ical Report 1015325, July 2007. [3] J. Or r, et al, “Curren t Harmoni cs, Voltage Disto rtion, and Powers Associated with Electric Vehicle Battery Charg- ers Distributed on the Residential Power System,” IEEE Trans. On Industry Applications, Volume: IA-20, Issue 4,1984 [4] J. Gomez and M. Morcos, “Impact of EV Battery Charg- ers on the Power Quality of Distribution Systems,” IEEE Power E ngineering Review, October 2002. [5] Emadi, A., “Transportation 2.0.,” IEEE Power and Ener- gy, Vol. 9, No. 4, July/ Aug. 2011. [6] W.Kramer, S. Chakraborty, B. Kroposki and H. Thomas, "Advanced power electronic interfaces for distributed en er gy s yst e ms - part 1: system and topologies," National Renewable Energy Laboratory, Golden, Colorado, Tech. Rep. NREL/TP-581-42672, Mar.2008. [7] Malaysian Energy Commision, The Malaysian Distribu- tion Code , http://www.tnb.com.my/tnb/application/uploads/uploaded /the%20malaysian%20grid%20code.pdf |