Paper Menu >>
Journal Menu >>
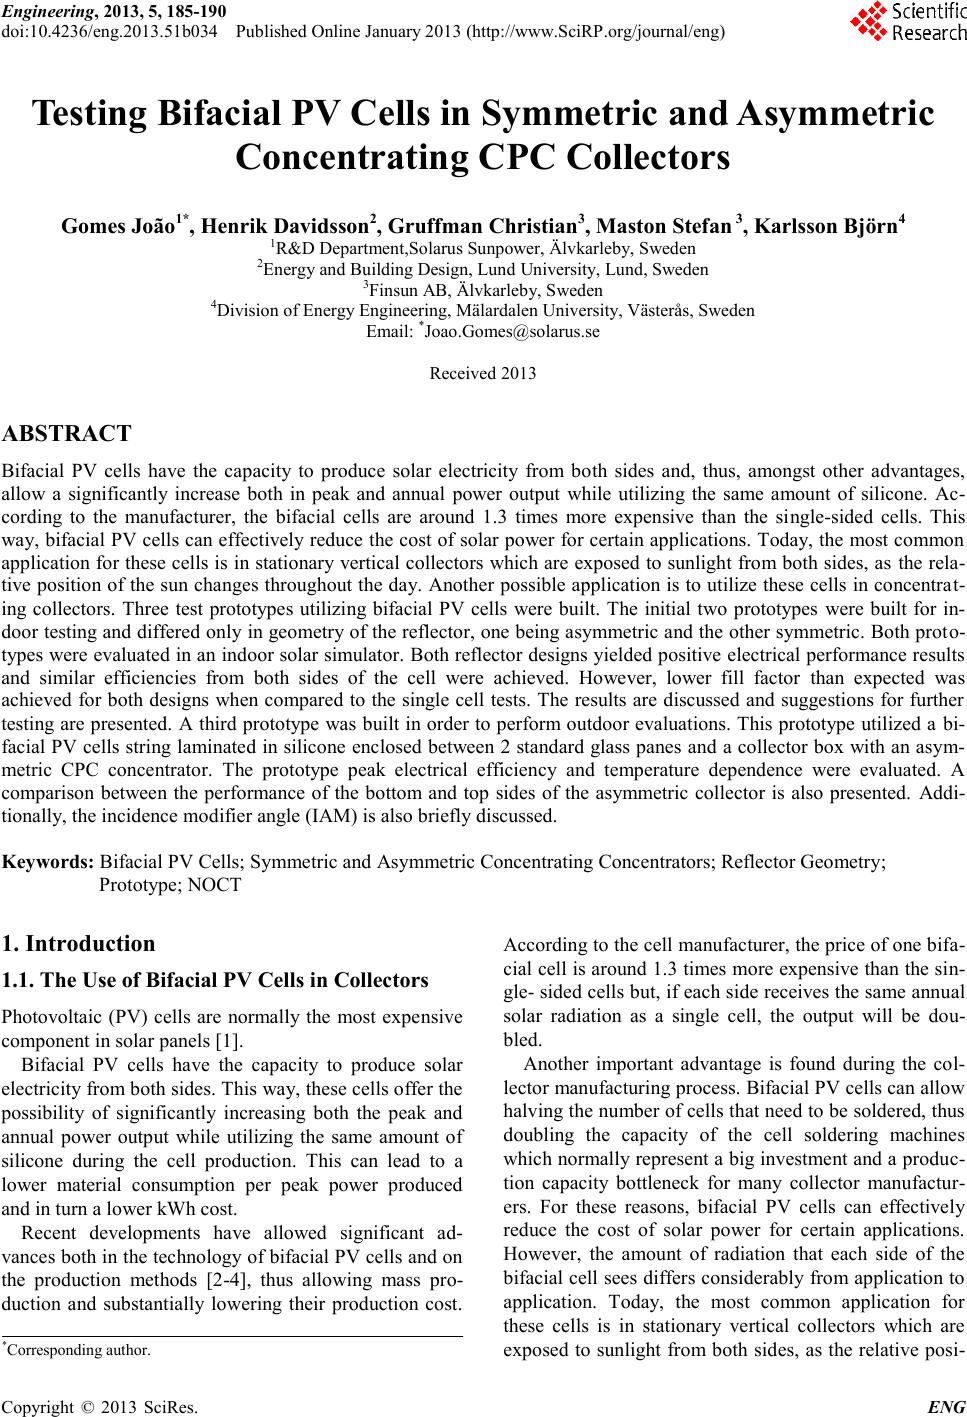 Engineering, 2013, 5, 185-190 doi:10.4236/eng.2013.51b034 Published Online January 2013 (http://www.SciRP.org/journal/eng) Copyright © 2013 SciRes. ENG Testing Bifacial PV Cells in Symmetric and Asymmetric Concentrating CPC Collectors Gomes João1*, Henrik Davidsson2, Gruffman Christian3, Maston Stefan 3, Karlsson Björn4 1R&D Department,Solarus Sunpower, Älvkarleby, Sweden 2Energy and Building Design, Lund University, Lund, Sweden 3Finsun AB, Älvkarleby, Sweden 4Division of Energy Engineering, Mälardalen University, Västerås, Sweden Email: *Joao.Gomes@solarus.se Received 2013 ABSTRACT Bifacial PV cells have the capacity to produce solar electricity from both sides and, thus, amongst other advantages, allow a significantly increase both in peak and annual power output while utilizing the same amount of silicone. Ac- cording to the manufacturer, the bifacial cells are around 1.3 times more expensive than the single-sided cells. This way, bifacial PV cells can effectively reduce the cost of solar power for certain applications. Today, the most common application for these cells is in stationary vertical collectors which are exposed to sunlight from both sides, as the rela- tive position of the sun changes throughout the day. Another possible application is to utilize these cells in concentrat- ing collectors. Three test prototypes utilizing bifacial PV cells were built. The initial two prototypes were built for in- door testing and differed only in geometry of the reflector, one being asymmetric and the other symmetric. Both proto- types were evaluated in an indoor solar simulator. Both reflector designs yielded positive electrical performance results and similar efficiencies from both sides of the cell were achieved. However, lower fill factor than expected was achieved for both designs when compared to the single cell tests. The results are discussed and suggestions for further testing are presented. A third prototype was built in order to perform outdoor evaluations. This prototype utilized a bi- facial PV cells string laminated in silicone enclosed between 2 standard glass panes and a collector box with an asym- metric CPC concentrator. The prototype peak electrical efficiency and temperature dependence were evaluated. A comparison between the performance of the bottom and top sides of the asymmetric collector is also presented. Addi- tionally, the incidence modifier angle (IAM) is also briefly discussed. Keywords: Bifacial PV Cells; Symmetric and Asymmetric Concentrating Concentrators; Reflector Geometry; Prototype; NOCT 1. Introduction 1.1. The Use of Bifacial PV Cells in Collectors Photovoltaic (PV) cells are normally the most expensive component in solar panels [1]. Bifacial PV cells have the capacity to produce solar electricity from both sides. This way, these cells offer the possibility of significantly increasing both the peak and annual power output while utilizing the same amount of silicone during the cell production. This can lead to a lower material consumption per peak power produced and in turn a lower kWh cost. Recent developments have allowed significant ad- vances both in the technology of bifacial PV cells and on the production methods [2-4], thus allowing mass pro- duction and substantially lowering their production cost. According to the cell manufacturer, the price of one bifa- cial cell is around 1.3 times more expensive than the sin- gle- sided cells but, if each side receives the same annual solar radiation as a single cell, the output will be dou- bled. Another important advantage is found during the col- lector manufacturing process. Bifacial PV cells can allow halving the number of cells that need to be soldered, thus doubling the capacity of the cell soldering machines which normally represent a big investment and a produc- tion capacity bottleneck for many collector manufactur- ers. For these reasons, bifacial PV cells can effectively reduce the cost of solar power for certain applications. However, the amount of radiation that each side of the bifacial cell sees differs considerably from application to application. Today, the most common application for these cells is in stationary vertical collectors which are exposed to sunlight from both sides, as the relative posi- *Corresponding author. 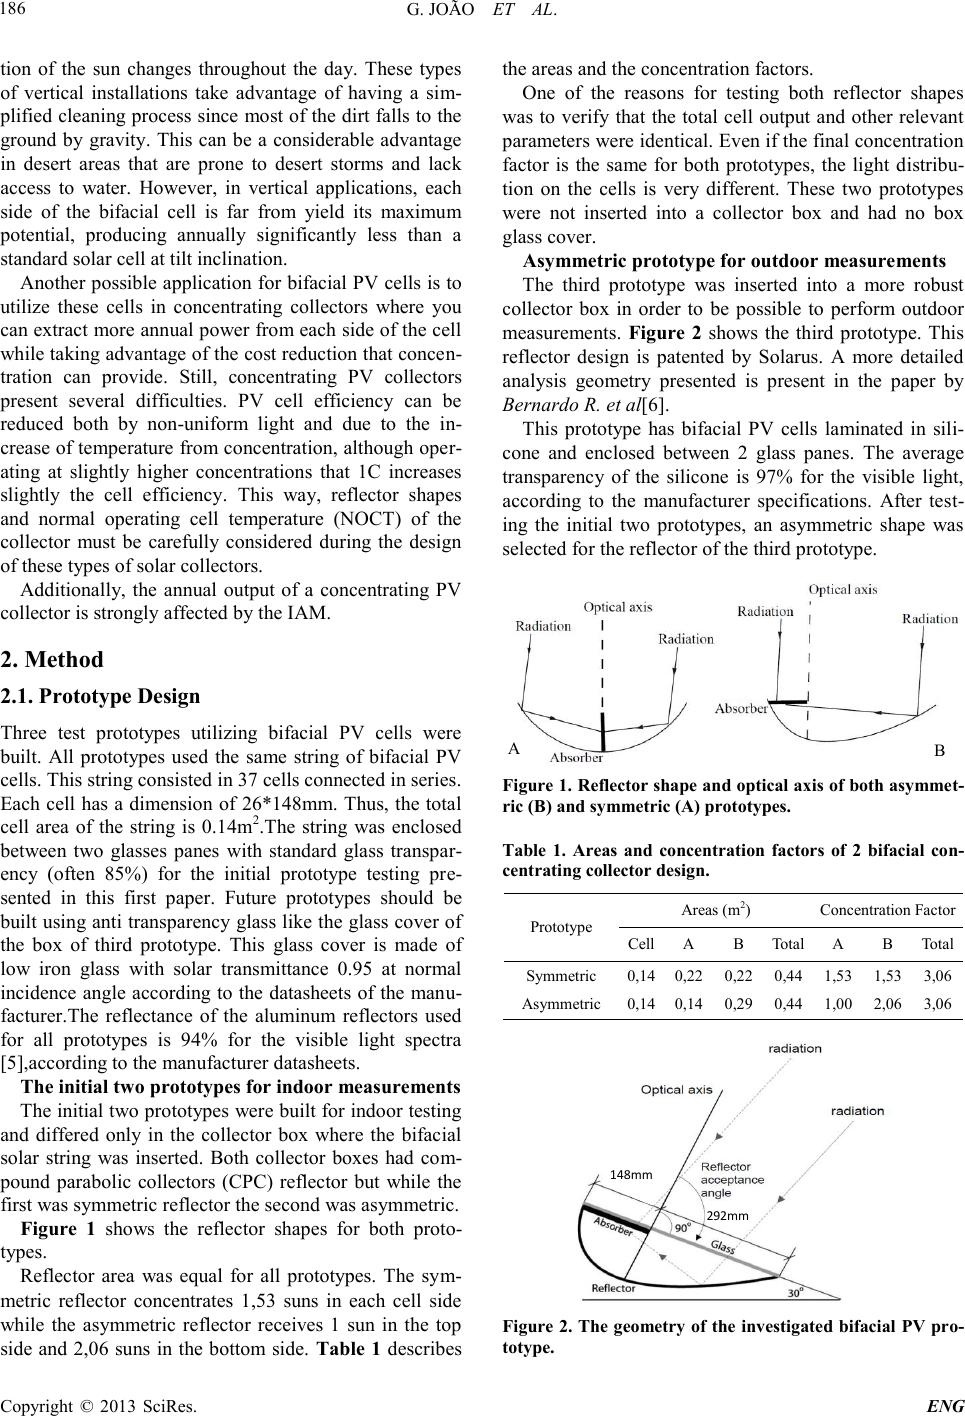 G. JOÃO ET AL. Copyright © 2013 SciRes. ENG 186 tion of the sun changes throughout the day. These types of vertical installations take advantage of having a sim- plified cleaning process since most of the dirt falls to the ground by gravity. This can be a considerable advantage in desert areas that are prone to desert storms and lack access to water. However, in vertical applications, each side of the bifacial cell is far from yield its maximum potential, producing annually significantly less than a standard solar cell at tilt inclination. Another possible application for bifacial PV cells is to utilize these cells in concentrating collectors where you can extract more annual power from each side of the cell while taking advantage of the cost reduction that concen- tration can provide. Still, concentrating PV collectors present several difficulties. PV cell efficiency can be reduced both by non-uniform light and due to the in- crease of temperature from concentration, although oper- ating at slightly higher concentrations that 1C increases slightly the cell efficiency. This way, reflector shapes and normal operating cell temperature (NOCT) of the collector must be carefully considered during the design of these types of solar collectors. Additionally, the annual output of a concentrating PV collector is strongly affected by the IAM. 2. Method 2.1. Prototype Design Three test prototypes utilizing bifacial PV cells were built. All prototypes used the same string of bifacial PV cells. This string consisted in 37 cells connected in series. Each cell has a dimension of 26*148mm. Thus, the total cell area of the string is 0.14m2.The string was enclosed between two glasses panes with standard glass transpar- ency (often 85%) for the initial prototype testing pre- sented in this first paper. Future prototypes should be built using anti transparency glass like the glass cover of the box of third prototype. This glass cover is made of low iron glass with solar transmittance 0.95 at normal incidence angle according to the datasheets of the manu- facturer.The reflectance of the aluminum reflectors used for all prototypes is 94% for the visible light spectra [5],according to the manufacturer datasheets. The initial two prototypes for indoor measurements The initial two prototypes were built for indoor testing and differed only in the collector box where the bifacial solar string was inserted. Both collector boxes had com- pound parabolic collectors (CPC) reflector but while the first was symmetric reflector the second was asymmetric. Figure 1 shows the reflector shapes for both proto- types. Reflector area was equal for all prototypes. The sym- metric reflector concentrates 1,53 suns in each cell side while the asymmetric reflector receives 1 sun in the top side and 2,06 suns in the bottom side. Table 1 describes the areas and the concentration factors. One of the reasons for testing both reflector shapes was to verify that the total cell output and other relevant parameters were identical. Even if the final concentration factor is the same for both prototypes, the light distribu- tion on the cells is very different. These two prototypes were not inserted into a collector box and had no box glass cover. Asymmetric prototype for outdoor measurements The third prototype was inserted into a more robust collector box in order to be possible to perform outdoor measurements. Figure 2 shows the third prototype. This reflector design is patented by Solarus. A more detailed analysis geometry presented is present in the paper by Bernardo R. et al[6]. This prototype has bifacial PV cells laminated in sili- cone and enclosed between 2 glass panes. The average transparency of the silicone is 97% for the visible light, according to the manufacturer specifications. After test- ing the initial two prototypes, an asymmetric shape was selected for the reflector of the third prototype. A B Figure 1. Reflector shape and optical axis of both asymmet- ric (B) and symmetric (A) prototypes. Table 1. Areas and concentration factors of 2 bifacial con- centrating collector design. Prototype Areas (m2) Concentration Factor Cell A B Total A B Total Symmetric 0,14 0,22 0,22 0,44 1,53 1,53 3,06 Asymmetric 0,14 0,14 0,29 0,44 1,00 2,06 3,06 148mm 292mm Figure 2. The geometry of the investigated bifacial PV pro- totype.  G. JOÃO ET AL. Copyright © 2013 SciRes. ENG 187 In order to monitor cell temperature, a K-type sensor was installed inside the silicone in between the two glass panes in a location very close to the cells but without creating shading. Picture 1 shows the location of the K-type sensor. The idea with the construction of the third prototype was to provide initial testing results before the construc- tion of a full collector with the dimensions shown in Figure 3. This collector will have 38 series connected cut cells per string. The strings will be connected in par- allel between them and also between receiver sides, as shown in Figure 3. 2.2. Experimental Testing Setup The three collector prototypes were measured both in- doors and outdoors. The electricity was measured using an IV tracer connected to a laptop. Data was retrieved from the IV tracer using software designed by Christian Gruffman at Finsun Inresol. This software is able to per- form both single and continuous measurements. In the indoor measurement only the single measurement func- tion was used while for the outdoor measurements both functions were utilized. The IV tracer draws an IV-curve based on 100 values at different currents and voltages, while the software retrieves this data and records the values of Imp, Isc, Vmp, Voc, Pmax, FF and cell effi- ciency. The electricity produced by the cells was not be- ing continuously extracted during the measurements which may lead to cell overheating and consequent pow- er reduction due to cell temperature dependence. Picture 1.Location of the K-type sensor and aspect of the bifacial cell prototype. Figure 3.Top view of the future bifacial collector. The red lines show the electrical connections. Indoor test set-up The indoor solar simulator was designed to simulate solar radiation and consists of two rows of 8halogen light bulbs each with 1000W of power. As in many solar sim- ulators, the light distribution is the drawback, since it is far from perfect and it depends strongly on the position of the cells within the simulator. (Picture 2) Outdoor test set-up The outdoor set-up consisted in a tilt adjustable wooden stand where the collector was facing the sun. The select- ed tilt was the best for maximizing output for the location and the time of the year in which the measurements took place, March, May, June and July of 2011. Location was Älvkarleby, Sweden. Picture 3 shows the test set-up. The solar radiation was measured utilizing 3 sensors type SRS1000produced by the company Finsun Inresol. This pyranometer uses a sensing element made in a single crystal Si-cell. The output voltage is 100 mV when ex- posed to 1000 W/m2 solar radiation [8]. The 3 pyranome- ters mounted on the stand were calibrated against two other pyranometers. One of the 3 pyranometers was cov- ered by a diffuser ring in order to obtain the diffuse radi- ation, as shown in Picture 3. Beam radiation is obtained by subtracting diffuse to global radiation. In Picture 3, only the top reflector trough is related to the bifacial PV prototype. The bottom reflector trough contains a collector prototype of a PVT for another ex- periment and is not related to this paper. Picture 2.The solar simulator for the indoor measurements. Picture 3.The measured bifacial collector (top trough) and the solar radiation sensors. 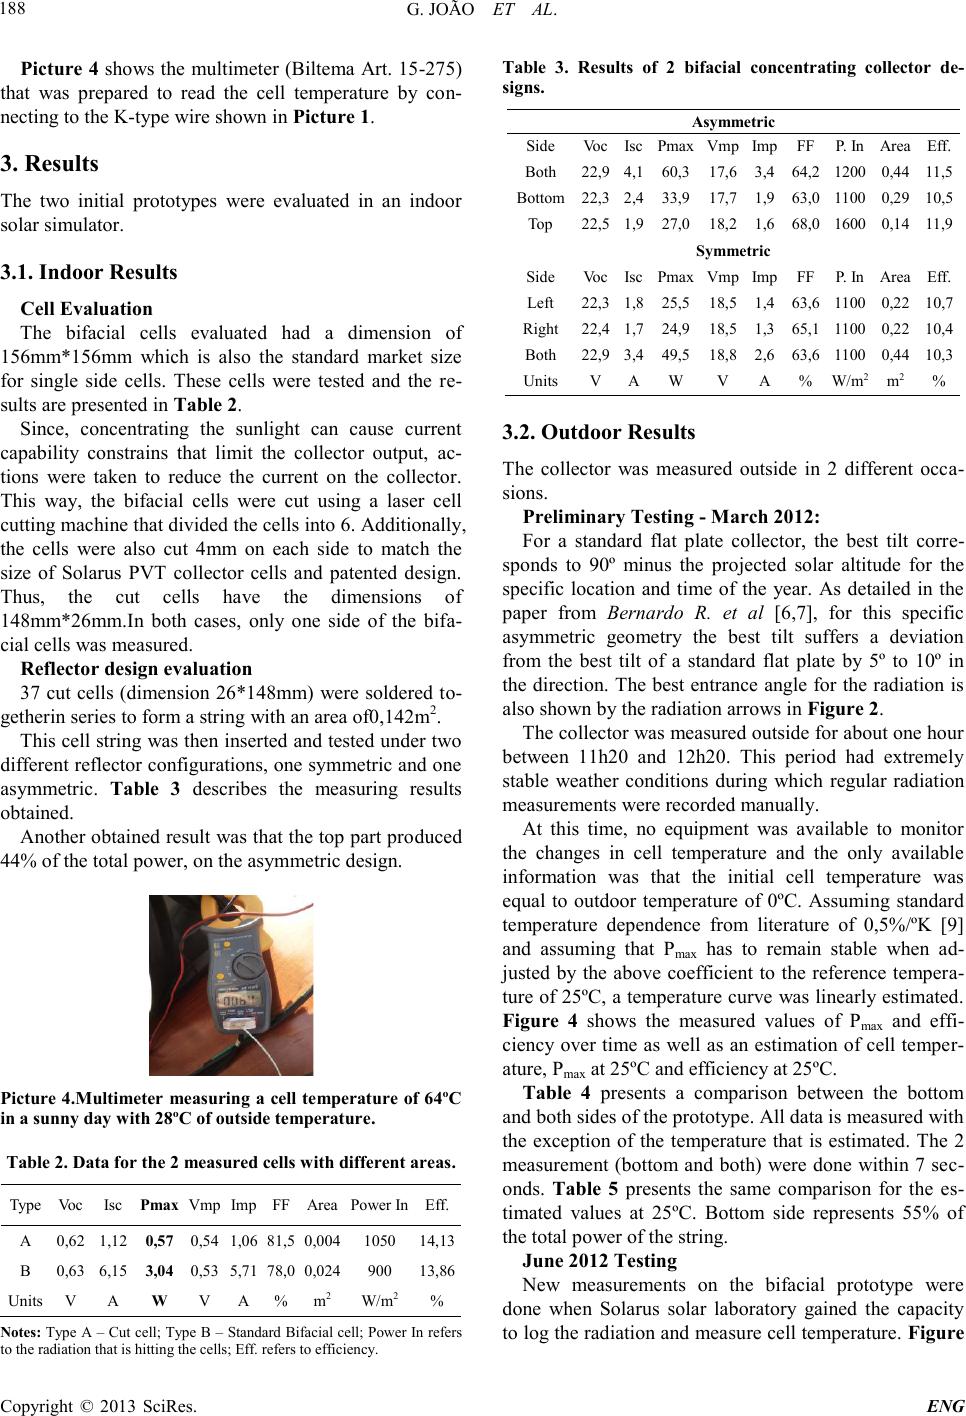 G. JOÃO ET AL. Copyright © 2013 SciRes. ENG 188 Picture 4 shows the multimeter (Biltema Art. 15-275) that was prepared to read the cell temperature by con- necting to the K-type wire shown in Picture 1. 3. Results The two initial prototypes were evaluated in an indoor solar simulator. 3.1. Indoor Results Cell Evaluation The bifacial cells evaluated had a dimension of 156mm*156mm which is also the standard market size for single side cells. These cells were tested and the re- sults are presented in Table 2. Since, concentrating the sunlight can cause current capability constrains that limit the collector output, ac- tions were taken to reduce the current on the collector. This way, the bifacial cells were cut using a laser cell cutting machine that divided the cells into 6. Additionally, the cells were also cut 4mm on each side to match the size of Solarus PVT collector cells and patented design. Thus, the cut cells have the dimensions of 148mm*26mm.In both cases, only one side of the bifa- cial cells was measured. Reflector design evaluation 37 cut cells (dimension 26*148mm) were soldered to- getherin series to form a string with an area of0,142m2. This cell string was then inserted and tested under two different reflector configurations, one symmetric and one asymmetric. Table 3 describes the measuring results obtained. Another obtained result was that the top part produced 44% of the total power, on the asymmetric design. Picture 4.Multimeter measuring a cell temperature of 64ºC in a sunny day with 28ºC of outside temperature. Table 2. Data for the 2 measured cells with different areas. Type Voc Isc Pmax Vmp Imp FF Area Power In Eff. A 0,62 1,12 0,57 0,54 1,06 81,5 0,004 1050 14,13 B 0,63 6,15 3,04 0,53 5,71 78,0 0,024 900 13,86 Units V A W V A % m2 W/m2 % Notes: Type A – Cut cell; Type B – Standard Bifacial cell; Power In refers to the radiation that is hitting the cells; Eff. refers to efficiency. Table 3. Results of 2 bifacial concentrating collector de- signs. Asymmetric Side Voc Isc Pmax Vmp Imp FF P. In Area Eff. Both 22,9 4,1 60,3 17,6 3,4 64,2 1200 0,44 11,5 Bottom 22,3 2,4 33,9 17,7 1,9 63,0 1100 0,29 10,5 Top 22,5 1,9 27,0 18,2 1,6 68,0 1600 0,14 11,9 Symmetric Side Voc Isc Pmax Vmp Imp FF P. In Area Eff. Left 22,3 1,8 25,5 18,5 1,4 63,6 1100 0,22 10,7 Right 22,4 1,7 24,9 18,5 1,3 65,1 1100 0,22 10,4 Both 22,9 3,4 49,5 18,8 2,6 63,6 1100 0,44 10,3 Units V A W V A % W/m2 m2 % 3.2. Outdoor Results The collector was measured outside in 2 different occa- sions. Preliminary Testing - March 2012: For a standard flat plate collector, the best tilt corre- sponds to 90º minus the projected solar altitude for the specific location and time of the year. As detailed in the paper from Bernardo R. et al [6,7], for this specific asymmetric geometry the best tilt suffers a deviation from the best tilt of a standard flat plate by 5º to 10º in the direction. The best entrance angle for the radiation is also shown by the radiation arrows in Figure 2. The collector was measured outside for about one hour between 11h20 and 12h20. This period had extremely stable weather conditions during which regular radiation measurements were recorded manually. At this time, no equipment was available to monitor the changes in cell temperature and the only available information was that the initial cell temperature was equal to outdoor temperature of 0ºC. Assuming standard temperature dependence from literature of 0,5%/ºK [9] and assuming that Pmax has to remain stable when ad- justed by the above coefficient to the reference tempera- ture of 25ºC, a temperature curve was linearly estimated. Figure 4 shows the measured values of Pmax and effi- ciency over time as well as an estimation of cell temper- ature, Pmax at 25ºC and efficiency at 25ºC. Table 4 presents a comparison between the bottom and both sides of the prototype. All data is measured with the exception of the temperature that is estimated. The 2 measurement (bottom and both) were done within 7 sec- onds. Table 5 presents the same comparison for the es- timated values at 25ºC. Bottom side represents 55% of the total power of the string. June 2012 Testing New measurements on the bifacial prototype were done when Solarus solar laboratory gained the capacity to log the radiation and measure cell temperature. Figure  G. JOÃO ET AL. Copyright © 2013 SciRes. ENG 189 5 plots the global radiation in Älvkarleby on the 22nd of June. The tilt was the most adequate for maximizing the output for this collector at this latitude and time of year. Vmp, Isc, Pmax and cell temperature are shown in the Figure 6. The cell temperature was taken at 6 different times and then extrapolated using a 3rd order polynomial equation matching the measured data with an R2 of 0,999. Highest measured cell temperature was 88ºC at 14h30 after con- stant perfect radiation day with an ambient temperature of 32ºC. Figure 7 shows the measured electrical efficiency de- pendence on cell temperature expressed both in total area and cell area. The dependence of electrical efficiency on temperature is -0.51 %/K. Figure 4. Pmax and efficiency over time (measured at a temperature represented by T curve); Pmax and efficiency at 25ºC (estimated)and cell temperature. Table 4. Comparison bottom vs both sides at 36ºC. Side Voc Isc Vmp Imp FF Bottom 18,1 V 1,7 A 13,3 V 1,4 A 57,8% Both 18,9 V 2,9 A 13,9 V 2,3 A 58,5% Side Cell T. Pmax Eff/Total area Eff/Cell area Bottom 36ºC 18,0W 7,2% 14,9% Both 36ºC 32,5W 8,8% 13,4% Table 5. Comparison bottom vs both sides at 25ºC. Side Cell T. Pmax Eff/Total area Eff/Cell area Bottom 25ºC 19,0W 7,6% 15,6% Both 25ºC 34,3W 9,2% 14,1% Figure 5. Global radiation on 22th of June of 2012. 4. Conclusions 4.1. Indoor Testing Cell Evaluation Two sizes of cells were evaluated. As expected, a smaller cell size presented a higher FF even when ex- posed to a high radiation level and thus a slightly higher efficiency. The value of 14% efficiency from the manufacturer was confirmed. The cell manufacturer stated that these efficiencies will be raised in the near future to signifi- cantly higher levels. Reflector design evaluation Both geometries yielded similar results in terms of FF, efficiency and Voc. The difference in proximity to the light source due to the asymmetric reflector led to dif- ferent light intensities which in turn lead to different Isc, Imp and Pmax. Nevertheless, these values remain con- sistent. However, a significant decrease in FF and cell efficiency was observed for both geometries when com- pared to the single side cell testing. While the single cell shows a FF of 80% and an efficiency of 14%, the string measurements for both geometries shows a FF of 65% and around 11% of efficiency. This decrease is due to the losses from the reflector reflectance and possibly a cur- rent capability constrains may also occur due to the con- centration of light. Additionally, at least a part of the decrease can also be attributed to non-uniform cell dis- tribution from the solar simulator and thus further out- door testing is required. Figure 6. Pmax, Imp, Vmp and cell temperature for the day of 22th of June. The (R) and (L) symbolizes right or left axis. Figure 7. Electrical efficiency dependence on cell tempera- ture - measured  G. JOÃO ET AL. Copyright © 2013 SciRes. ENG 190 The Solarus PVT reflector geometry was selected for outdoor testing both for practical reasons and since there were no relevant constrains verified during this step. Current capability seems to be equal for both designs since FF is similar. Thus another conclusion is that the side of the solar cell from where the current is flowing into the busbar does not impact the current capability. In the asymmetric reflector geometry, the top part was producing 44% of the total power. Since top part repre- sents 33% of the area, it should produce also 33% of the power, if there were no losses due to reflector reflection. This decrease is again due to the reflector losses and non-uniform light distribution. Additionally, it is im- portant to notice that the solar simulator gives more than 1000w/m2 and that its radiation spectra is not equal to the solar radiation which further motivates performing out- door testing. 4.2. Outdoor Testing Bottom side represents 55% of the total power of the string which is consistent with the indoor testing. This is below the theoretical maximum and can be improved. The obtained FF values seem to imply that there is a cur- rent capability constrain. 58% outdoor and 64% indoors are low values in comparison to standard PV modules, according to literature [9]. At 36ºC, Imp /Isc is 0,83 while Vmp/Voc is 0,72 signaling that shunt resistance is more significant than series resistance. As expected, the bot- tom side presents a higher efficiency per cell area due to the concentration factor of 2 while a lower efficiency per total area due to the extra losses with reflector reflec- tance. The dependence of electrical efficiency on temperature is -0.51 %/K, in good agreement with the common value for solar cells described in literature [9]. At 25ºC and 1000w/m2, the electrical efficiency ex- pressed per total area is 8,4%. If expressed per cell area, this value is12,9%. The IAM is an important parameter for any non-track- g concentrating collector and for the asymmetric bifacial PV as well. Figure 6 shows that for bifacial PV, an out- put increase starts at 11h30 under steady weather condi- tions. Comparing to the PVT measured Bernardo R. et al [6],the tested bifacial PV has a bigger time period unaf- fected by shading since the string is one cell smaller and closer to the center, the prototype. The afore mentioned figure also shows how the voltage drops in the bifacial PV prototype with the temperature increase. Since the crystalline solar cells are translucid, it was expected that the solar radiation would go through the cells and that high operating cell temperature would not be reached. However, this did not happen. It is recom- mended that a new prototype is built where: 1) Only anti reflectance glasses are used. 2) Placing the absorber in contact with the top glass should have a big increase im- pact in NOCT of the collector by greatly increasing the heat losses. REFERENCES [1] International Renewable Energy Agency, “Renewable Energy Technologies: Cost Analysis Series - Solar Pho- tovoltaic”, Volume 1: Power Sector Issue 4/5, June 2012. [2] A. Kränzl, R. Kopecek, K. Peter, P. Fath “Bifacial Solar Cells on Multi-Crystalline Silicon with Boron BSF and Open Rear Contact”. Proceedings of the 4th World Con- ference on Photovoltaic Energy Conversion. May 2006 Vol. 1, pp 968 – 971. [3] V. D. Mihailetchi et al. “Screen Printed N-Type Silicon Solar Cells for Industrial Applications”. 25th European Photovoltaic Solar Energy Conference and Exhibition, 6-10 September 2010, Valencia, Spain DOI: 10.4229/25thEUPVSEC2010-2DO.2.2 [4] C. Duran et al. “Bifacial Solar Cells with Selective B-BSF by Laser Doping”. 24th European Photovoltaic Solar Energy Conference, 21-25 September 2009, Ham- burg, Germany. DOI: 10.4229/24thEUPVSEC2009-2CV.5.19 [5] Alanod, reflector manufacturer, 2012. http://alanod.com. [6] Bernardo R. et al., “Measurements of the Electrical Incidence Angle Modifiers of an Asymmetrical Photovoltaic/ Thermal Compound Parabolic Concentrating-Collector,” Power and Energy Engineering Conferenceand Engineer- ing, Sanya, China, Dec 31, 2012 - Jan 2, 2013, un- published [7] Bernardo, L.R et al. Performance evaluation of low concentrating photovoltaic/thermal systems: A case study from Sweden. Solar Energy2011, 85, 1499-1510 [8] N. Gentile et al., "Construction of a small scale laboratory for solar collectors and solar cells in a developing coun- try", Power and Energy Engineering Conferenceand Engineering, Sanya, China, Dec 31, 2012 - Jan 2, 2013, unpublished [9] S. Wenham et al, "Applied Photovoltaics", 2nd edition, Earthscan, London, 2007, ISBN 978-1844074013. Nomenclature CPC Compound Parabolic Collector (-) IAM Incidence Angle Modifier (-) NOCT Normal Operating Cell Temperature (ºC) IV Curve Current and Voltage Curve (-) Imp Maximum Power Current (A) Isc Short Circuit Current (A) Vmp Maximum Power Voltage (V) Voc Open Circuit Voltage (V) Pmax Maximum Power (W) FF Fill Factor (%) |