 Psychology 2013. Vol.4, No.1, 19-32 Published Online January 2013 in SciRes (http://www.scirp.org/journal/psych) http://dx.doi.org/10.4236/psych.2013.41003 Copyright © 2013 SciRes. 19 Children Cautious Strategy and Variable Maturation Time Window for Responding in a Visual Search Task María Ángeles Rojas-Benjumea1, Eliana Quintero-Gallego 2, Laura Zozaya1, Catarina I. Barriga-Paulino1, Carlos M. Gómez 1* 1Human Psychobiology Lab, Experimental Psychology Department, University of Seville, Seville, Spain 2Instituto Ortopedia Infantile Roosvelt Sección Neuropsicologia, Bogot a, Colombia Email: manrojben@alum.us.es, eliana_quintero@yahoo.es, lzozaya@us.es, cbarriga@us.es, *cgomez@us.es Received October 8th, 20 12; revised November 6 th, 2012; accepted December 3rd, 2012 Present study evaluates the changes and developmental trajectories of the attentional serial visual search and pre-attentional parallel search (pop-out) in situations in which a fast response is required. The hy- pothesis of present study are 1) that pre-attentional selection mechanisms develop before than serial atten- tional processes; 2) in the most difficult tasks, children prefer to adopt a non-responding strategy to an impulsive response patters; and 3) in speeded difficult discrimination tasks young children arrives to the criteria of correct performance in a broad temporal window. The results showed an inverse relationship between the age and the RTs and the different type of errors. For the present set of stimuli which produces an overcrowded scene and required a fast response, the behavioural trend of normal children is to the non-response pattern rather than to impulsive incorrect responses pattern. It can be suggested that young normal children present a broad temporal window to obtain the perceptual, motor and/or cognitive skills needed for responding adequately in a fast speeded discrimination task. Keywords: Development, Pop-Out; Visual Search; RTs; Error Analysis; Attention Introduction One of the most fruitful approaches trying to understand at- tention is the visual search paradigm. This experimental proce- dure permits to understand the subject’s ability to detect a target stimulus in an array of distractors (Treisman, 1986; Treisman & Gormican, 1988). In this paradigm subjects are presented with a target stimulus in a random spatial position in an array of dis- tracters, which differentiates from targets in one or several vis- ual features. If the distracters differentiate from the target in one single feature, the search occurs in parallel (pop-out) and there is not an increase of RTs as the number of distractors items in the display increases. If the target stimuli differentiate from distractors in more than one dimension there is an increase in the RTs invested in the detection of the target stimuli. The most prevalent theory about visual search, the feature integration theory (Treisman & Gelade, 1980), proposes that when a single feature must be discriminated the search occurs in parallel and corresponds to a pre-attentional selective me- chanism (pop-out), while in the features conjunction search the searching process must occur item by item, and a serial proc- essing of items occurs (visual search). In the single feature case, the object would be processed in a single visual map while in the conjunction feature the internal visual maps involved in the different features would be bound through the spatial position map, and the neural representations of the different maps would be analyzed serially by using attentional resources. These types of models have a strong biological inspiration given the exis- tence of feature analysis maps in the early stages of visual processing (Van Essen & Gallant, 1994). As not all types of features follow this increase in slope with the number of dis- tractors, the theory has been updated to the group scanning hypothesis (Treisman & Gormican, 1988), in which the subjects can scan groups of items, as a function of the search difficulty and practice with the items. Another model for visual search is the “stimulus similarity model”, in which the factor determin- ing the RTs is the similarity/dissimilarity between target and distracters (Duncan & Humphrey, 1989). These views have been challenged considering that both type of tasks: pop-out and visual search use attentional resources. Therefore, in pop-out there are more available attentional re- sources than in visual search, which is a more complicated task, but both tasks (pop-out and visual search) require a certain amount of attentional allocation. For instance, if a pop-out task is concurrently presented with a visual search task, the RTs in the pop-out task increase with the number of items presented in the visual search task, indicating that the amount of attentional available resources influences the so-called “pre-attentive search” (Joseph et al., 1997). These results suggested changing the terms of parallel and serial search to efficient (pop-out) and inefficient (visual search) searches. The latter ideas would be related to the “Guided search model”, which integrates many of the previous ideas (Cave & Wolfe, 1990). In this model a cer- tain balance between bottom-up and top-down processes are guiding the search. A great difference in features between target and distractors would permit an efficient bottom-up search, while in difficult discrimination top-down attentional mecha- nisms are needed and it would produce inefficient searches. During childhood, and as in many other cognitive functions, attention is following a certain developmental trajectory in which RTs and errors decrease with age (Plude et al., 1994). The development of visual search and pop-out has been exten- sively studied. There is a consensus that while pop-out search *Corresponding author.  M. Á. ROJAS-BENJUMEA ET AL. emerges in the earliest months of life, possibly around three months of life, visual parallel search would appear much later in life (Plude et al., 1994). Using saccadic latencies to target arrays in which a single feature was differentiating the target from the distractors, chil- dren with three months of age behaved similarly to young adults, producing the same RTs independently of the number of distracters, confirming the early maturation of the pop-out search system (Adler & Orprecio, 2006). Parallel visual search in which the target object differs in more than one dimension from the distractors develops later than pop-out search. Reductions in responses latencies and errors to targets from early childhood to adolescence have been obtained in features conjunction search. In general, in conjunc- tion search studies, the RTs have been much more extensively studied that the different type of errors (Forsman, 1967; Day, 1978; Thomson & Massaro, 1989; Ruskin & Kaye, 1990; Lo- baugh et al., 1998; Trick & Enns, 1998; Klemberg et al., 2001; Gerhardstein & Rovee-Collier, 2002; Hommel et al., 2004, Baranov-Krylov et al., 2009; Dy e & Bavelier, 201 0). Day (1978) showed a decrease in search times from seven to 12 years old, and around a 10% of missing targets were obtained for the conjunction of color and shape search, although not limit for response time window was imposed. Ruskin & Kate (1990) did show a decrease of search time with age. Klemberg et al. (2001) using images of cats as targets in a background of other figures found that visual search, measured as a compound index of accuracy and RTs, was not steady until 10 years old. Trick & Enns (1998) found a decrease in RTs with age in conjunction search task, however the error rate was very low and no differ- ences between age groups were obtained in accuracy. A similar result was obtained by Thompson & Massaro (1989) in pre- sch oolers of 4 - 5 y ears old. Gerhardstein & Rovee-Collier (2002) demonstrated the presence of feature conjunction search as early as 18 months old. Lobaugh et al. (1998) showed that chil- dren in the 7 - 8 age range already presented a features con- junction search similar to adults when the RTs were analyzed (only statistical trends in the slopes were found). With respect to accuracy, they found a similar accuracy to adults only in the 11 - 12 years old group, while the youngest children presented a marked decrease with respect to adults in accuracy during con- junction search for the “present targets” condition. The main reason for this lack of accuracy was due to the high proportion of misses in young children for the large number of distractors condition in the displays (10 seconds of response time window). They did not quantitatively study the variability in errors and RTs in children and young adults. Hommel et al. (2004) only found modest improvements in conjunction visual search from chi ld hood to adult periods. Baranov-Kry lov et al. (2009) showed a decrease in RTs and a decrease in the number of misses and false alarms with increasing age (200 ms of response time window). They suggested that misses were due to immaturity of occipito-temporal pathways and false alarms to immaturity in the behavioral inhibition system. The variability with age of errors was not explicitly studied. Conceptually, if the parallel-serial search account is taken it would imply that some neurophysiological mechanisms allow- ing the binding of the different visual maps have to emerge with maturation, while if the efficient-inefficient view is taken it would imply that visual attention is developing slowly and while with a few months there is enough developed capacity to extract a single feature item, the attention resources needed to extract a more complex target would need more time to be in place, i.e. the availability of attentional resources would be following a certa i n developmental tr a jectory. A general trend of the short review of visual search matura- tion presented here would be that conjunction visual search capacities are in place around 18 months old, and they continue maturing until 10 - 11 years old. However, most of these stud- ies found a high accuracy and no differences with age in accu- racy probably due to a floor effect in the percentage of errors. In the few cases in which these differences arose they were due to missing targets. The latter result would suggest that in com- plicated stimulus discrimination tasks, in which a limited time for inspecting the display is permitted, the young subjects would deploy a low response bias strategy in order to avoid impulsive inaccurate responses and avoid incorrect responses. Anyway, a systematic study of the different types of possible errors as anticipations, false alarms, incorrect responses and misses during the developmental trajectory of visual search has not been fully developed in the scientific literature on this topic. In general, in conjunction search studies, the RTs have been much more extensively studied that the different type of errors. The analysis of errors would be able to highlight processes which are not yet mature in children, and that the analysis of RTs and total errors would not be able to demonstrate. In pre- sent experiment pop-out and visual search tasks would be per- formed by chil dren be twee n 6 - 16 years o ld. The hy pothe sis of present study are 1) that pre-attentional selection mechanisms develop before than serial attentional processes and 2) in speeded difficult discrimination tasks young children arrives to the criteria of correct performance in a broad temporal window. A careful analysis of errors would provide some information about the possible strategies and processes implicated in the visual search task and its developmental trajectory, but also if this maturation occurs at different ages in normal children. One consequence of the first hypothesis is that for the most difficult tasks the children would take a more cautious response bias and therefore a high amount of misses would be obtained in the more difficult tasks. As a control, to support the strategic re- striction in young children, a stop task was also presented to the same group of subjects. If a higher number of omissions and a reduced number of impulsive responses (responses to stop stimuli) were obtained in young children with respect to pre- adolescents and/or adolescents, it would reinforce the proposed hypothesis of a strategic cautious attitude in speeded complex tasks in young children. Methods Participants The sample consisted of 69 subjects; all of them were stu- dents of a middle-class neighborhood belonging to a subsidized school in Seville (Spain) from a local Seville school (Spain). The age range was between 6 and 16 years old (mean age: 9.884 ± 3.1461). The group was composed by 38 girls and 31 boys. The experimental subjects had no vision problems or were corrected. The selected students did not present difficul- ties in learning and scholar achievements. The experiments were conducted with the informed and written consent of par- ents or tutors following the rules of the Helsinki Convention. The Ethics Committee of the University of Seville approved the study. Copyright © 2013 SciRes. 20  M. Á. ROJAS-BENJUMEA ET AL. Apparatu s a nd Procedure The e-prime 1.0 software was used to present stimuli a nd re- cord behavioral responses. The behavioral tests were the pop- out with 2, 4 and 6 stimuli to induce parallel search of subjects and visual-search tests with 2, 4 and 6 stimuli to examine serial search. The type of experimental procedure was somehow dif- ferent to the most usual visual search paradigms (i.e. Lobaugh, 1998), in which the subject have to respond to the presence (target YES response) or the absence (target absent NO re- sponse). In present experimental paradigm, the subjects re- sponded to the location of targets, and they did not respond to the absence of targets, being these trials considered as catch trials. The results confirmed that the experimental procedure used induced the same type of search phenomena than the more classic paradigm, and present certain ecological advantages as orienting and responding to the location of targets, and not responding to the absence of targets. In fact, visual search stud- ies in very young children between 1 - 3 years use experimental paradigms in which only responses to the targets are used (Gerhardstein & Rovee-Collier, 2002). Therefore, the use of compatible responses to the location of targets, and not re- sponding to the catch trials, was easily understood by the youngest children in the experiment. The stimuli were presented on the computer screen. The ex- periments were performed individually in a room of the school center, with privacy and relative noise isolation and free of distracting elements. Subjects were situated at 40 cm of a 17" computer screen. For the parallel visual search the stimuli were rectangles half blue (RGB code: navy 000080) and half red (RGB code: red FF0000). Red and blue colors were isolumi- nant. The size of single items was .6 cm (.85˚ of visual ang l e) in the horizontal meridian and of 1.2 cm (1.7˚ of visual angle) in the vertical meridian. The distracter items have blue color in the superior portion and target item have red color in the upper position (Figure 1(a)). For pop-out the target stimulus was the presence of a red rectangle item surrounded by blue rectangles (Figure 1(b)). The stimular set was presented in the center of the screen with a size of 7 cm (9.9˚ of visual angle) in the hori- zontal meridian and of 4.5 cm (6.4˚ of visual angle) in the ver- tical meridian. The distracters alone, in absence of targets, were presented in catch trials for the visual search (Figure 1(c)) and for the pop-out condition (Figure 1(d)). The set sizes were 2, 4 and 6 items. There was a central fixation cross constantly pre- sented during the whole block. The numbers of items were the same in each side of the fixation point and presentation order was randomized. The subjects pressed the right button for tar- gets located in the right side of the fixation point, and pressed the left button of the mouse for targets located in the left side of the fixation point and, they were instructed not to press to the distracters stimuli during catch trials. For pop-out and visual search tasks there was a total 180 trials presented in two blocks: 30 for each condition (2, 4 and 6 items), 80% were target stim- uli (72 stimuli, 24 for each condition) and 20% (18 stimuli, 6 for each condition) distracter stimuli (catch trials). Pop-out and visual search stimular sets were presented in two different blocks, the total number of trials per block was 90. The blocks were presented to all the subjects in the same order: first the pop-out block and then the visual search block. Stimuli were presented for 1500 ms and the ISIs were ran- domly chosen between 500 - 700 ms. The subjects received the instruction of searching the different stimuli (red in pop-out and (c) (d) (a) (b) Figure 1. Examples of the visual search and pop-out conditions. (a) Exam- ple of the visual search condition with one distracter (item blue in the upper position) and one target (blue in the lower position); (b) Example of the pop-out condition with one distracter (item blue) and one target (item red); (c) Example of a six distracters catch trial in the visual search condition; (d) Example of a six distrac- ters catch trial in the pop-out condition. rectangle with the lower part in blue for the visual search task) and press the corresponding button, and not to press if there were no targets in the display. The recorded variables for the pop-out were: the number of errors and RTs to two, four and six items display. When the subject responded to the distracters in which there was not any target item, the responses were categorized as false alarms. Anticipations were considered the responses faster than 150 ms. Omission corresponded to these trials in which there was not recorded responses during the 1500 ms in which the stimulus was present. When the subject responded to the opposite side to the target, the error was categorized as incorrect responses. The errors were analyzed as percentages. For the visual search the same variables than for pop-out condition were recorded. Stop Signal Task This paradigm is characterized by the presentation of a target stimulus that the subject has to respond as fast as possible (go signal). In a low quantity of essays and immediately later of the target, an auditory stimulus appears which indicates to suppress the response (stop signal). This task assesses attentional flexi- bility and inhibition skill. In the stop task the subjects had to inhibit a prepared prevalent motor response. The go signal was a toucan bird and was presented for 750 ms (Figure 2). In the stop trials a tone of 500 Hz and 300 ms was presented at 150 ms or 250 ms after the bird appearance, the tone indicates that no response should be done. The re- sponse window was 750 ms. The ISI was randomly chosen between 750 and 1000 ms. 100 trials were presented, 70 for the GO signal and 30 for the STOP signal. The recorded variables were: The number of omission errors and RTs in the GO signal and the number of responses to the stop signal (false alarms). This particular experiment was only Copyright © 2013 SciRes. 21  M. Á. ROJAS-BENJUMEA ET AL. Copyright © 2013 SciRes. 22 Figure 2. Stop task. The figure shows the proportions of the conditions. 70% of the trials were go signals. On the other hand, the 30% of the trials were the stop signal distributed in 15% of trials with the stop signal (sound) 150 ms before the visual go stimuli and the other 15% with the stop signal appearing 250 ms before the visual go stimuli. was not applied to anticipations and false alarms responses given the low number of cases from these two types of errors (see below). planned in order to check the ability of children preadolescents and adolescents to cancel an ongoing response, and by no means would it pretend to analyze the stop signal response time as defined by Logan (1984). The only objective is to test if young children have a tendency to have a cautious strategy for responding. This strategy would be demonstrated by a lower number of responses to the stop trials in young children with respect to the other age groups. The interaction between the effects of number of items and experimental condition was particularly important for confirm- ing that serial visual search strategies were used, given that in visual search there is an increase in RTs and errors when the number of presented items increases, while in pop-out these variables would be independent of the number of items. The triple interaction with the age factor would permit to prove if the effects of visual search condition are stronger in the young- est group than in the oldest group. Statistical Analysis Visual Sea rch In order to study the developmental trajectories of RTs, per- centage of hits and percentage of omissions and incorrect re- sponses, different regression models were proved with the age. The better adjustment was obtained for the inverse model which is reported in the results session, except for incorrect responses which required for the visual search with six items a quadratic model. Statistical analysis was performed using SPSS 17.0. An in- ter-group ANOVA (3 × 2 × 3) repeated measurements were computed to analyze the effects of the age groups (3 age levels) the experimental condition (pop-out and visual search) and the number of presented items (2, 4 and 6 items) and the possible interactions of the effects of these three factors. The categorized age levels were young children (6 - 8 years, 31 subjects, 16 fe- males), pre-adolescents (9 - 12 years, 26 subjects, 14 females) and adolescents (14 - 16 years, 12 subjects, 8 females). These analyses were applied independently for RTs, percentage of total errors, omission errors and incorrect responses. The ANOVA The developmental trajectories showed and increased vari- ability in the errors committed by youngest children. In order to demonstrate this possible increased variability, the Levene test for homogeneity of variance was applied to the different age groups. 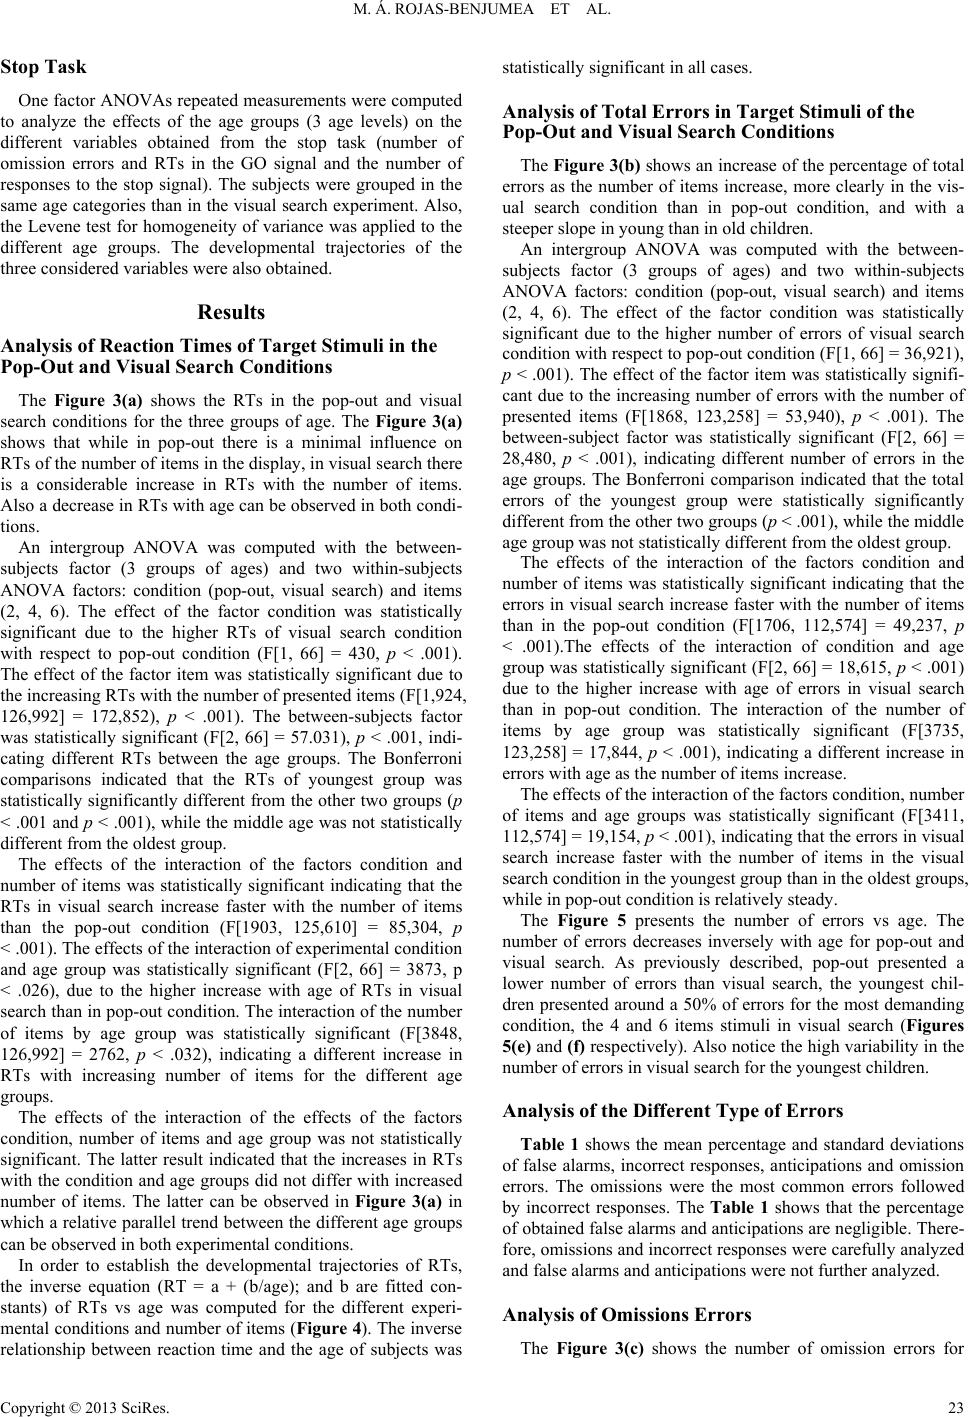 M. Á. ROJAS-BENJUMEA ET AL. Stop Task One factor ANOVAs repeated measurements were computed to analyze the effects of the age groups (3 age levels) on the different variables obtained from the stop task (number of omission errors and RTs in the GO signal and the number of responses to the stop signal). The subjects were grouped in the same age categories than in the visual search experiment. Also, the Levene test for homogeneity of variance was applied to the different age groups. The developmental trajectories of the three considered variables were also obtained. Results Analysis of Reaction Times of Target Stimuli in the Pop-Out and Visual Searc h Conditions The Figure 3(a) shows the RTs in the pop-out and visual search conditions for the three groups of age. The Figure 3(a) shows that while in pop-out there is a minimal influence on RTs of the number of items in the display, in visual search there is a considerable increase in RTs with the number of items. Also a decrease in RTs with age can be observed in both condi- tions. An intergroup ANOVA was computed with the between- subjects factor (3 groups of ages) and two within-subjects ANOVA factors: condition (pop-out, visual search) and items (2, 4, 6). The effect of the factor condition was statistically significant due to the higher RTs of visual search condition with respect to pop-out condition (F[1, 66] = 430, p < .001). The effect of the factor item was statistically significant due to the increasing RTs with the number of presented items (F[1,924, 126,992] = 172,852), p < .001). The between-subjects factor was statistically significant (F[2, 66] = 57.031), p < .001, indi- cating different RTs between the age groups. The Bonferroni comparisons indicated that the RTs of youngest group was statistically significantly different from the other two groups (p < .001 and p < .001), while the middle age was not statistically different from the oldest group. The effects of the interaction of the factors condition and number of items was statistically significant indicating that the RTs in visual search increase faster with the number of items than the pop-out condition (F[1903, 125,610] = 85,304, p < .001). The effects of the interaction of experimental condition and age group was statistically significant (F[2, 66] = 3873, p < .026), due to the higher increase with age of RTs in visual search than in pop-out condition. The interaction of the number of items by age group was statistically significant (F[3848, 126,992] = 2762, p < .032), indicating a different increase in RTs with increasing number of items for the different age groups. The effects of the interaction of the effects of the factors condition, number of items and age group was not statistically significant. The latter result indicated that the increases in RTs with the condition and age groups did not differ with increased number of items. The latter can be observed in Figure 3(a) in which a relative parallel trend between the different age groups can be observed in both experimental conditions. In order to establish the developmental trajectories of RTs, the inverse equation (RT = a + (b/age); and b are fitted con- stants) of RTs vs age was computed for the different experi- mental conditions and number of items (Figure 4). The inverse relationship between reaction time and the age of subjects was statistically significant in all cases. Analysis of Total Errors in Target Stimuli of the Pop-Out and Visual Searc h Conditions The Figure 3(b) shows an increase of the percentage of total errors as the number of items increase, more clearly in the vis- ual search condition than in pop-out condition, and with a steeper slope in young than in old children. An intergroup ANOVA was computed with the between- subjects factor (3 groups of ages) and two within-subjects ANOVA factors: condition (pop-out, visual search) and items (2, 4, 6). The effect of the factor condition was statistically significant due to the higher number of errors of visual search condition with respect to pop-out condition (F[1, 66] = 36,921), p < .001). The effect of the factor item was statistically signifi- cant due to the increasing number of errors with the number of presented items (F[1868, 123,258] = 53,940), p < .001). The between-subject factor was statistically significant (F[2, 66] = 28,480, p < .001), indicating different number of errors in the age groups. The Bonferroni comparison indicated that the total errors of the youngest group were statistically significantly different from the other two groups (p < .001), while the middle age group was not statistically different from the oldest group. The effects of the interaction of the factors condition and number of items was statistically significant indicating that the errors in visual search increase faster with the number of items than in the pop-out condition (F[1706, 112,574] = 49,237, p < .001).The effects of the interaction of condition and age group was statistically significant (F[2, 66] = 18,615, p < .001) due to the higher increase with age of errors in visual search than in pop-out condition. The interaction of the number of items by age group was statistically significant (F[3735, 123,258] = 17,844, p < .001), indicating a different increase in errors with age as the number of items increase. The effects of the interaction of the fac tors condition, number of items and age groups was statistically significant (F[3411, 112,574] = 19,154, p < .001), indicating that the errors in visual search increase faster with the number of items in the visual search condition in the youngest group than in the oldest groups, while in pop-out condition is relatively steady. The Figure 5 presents the number of errors vs age. The number of errors decreases inversely with age for pop-out and visual search. As previously described, pop-out presented a lower number of errors than visual search, the youngest chil- dren presented around a 50% of errors for the most demanding condition, the 4 and 6 items stimuli in visual search (Figures 5(e) and (f) respectively). Also notice the high variability in the number of errors in visual search for the youngest children. Analysis of the Different Type of Errors Table 1 shows the mean percentage and standard deviations of false alarms, incorrect responses, anticipations and omission errors. The omissions were the most common errors followed by incorrect responses. The Table 1 shows that the percentage of obtained false alarms and anticipations are negligible. There- fore, omissions and incorrect responses were carefully analyzed and false alarms and anticipations were not further analyzed. Analysis of Omissions Errors The Figure 3(c) shows the number of omission errors for Copyright © 2013 SciRes. 23  M. Á. ROJAS-BENJUMEA ET AL. Copyright © 2013 SciRes. 24 (d) (c) (b) (a) Figure 3. RTs and errors in the different age groups and conditions. (a) Relationship between RTs for pop-out conditions and visual search in the three age groups as a function of the number of items. Notice the decrease of RTs with the age in both conditions, and the increase of RTs with the number of items in the visual search task; (b) Relationship between the percentage of total errors for pop-out conditions and visual search in the three age groups as a function of the number of items. Notice the increase of errors with the age in both conditions and with the number of items in the visual search task; (c) and (d) Idem to B for omission and incorrect responses, respec- tively. Table 1. Mean and standard deviations of the percentage of the different type of errors: omissions, anticipations, incorrect responses and false alarms for visual search and pop-out conditions with 2, 4 and 6 items. Pop-out 2 items Pop-out 4 items Pop-out 6 items Visual search 2 items Visual search 4 items Visual search 6 items Mean 1.8116 1.7512 2.2946 3.8647 11.2319 18.7198 Omission erro r s (% ) SD 4.43258 4.92000 4.54945 7.90307 15.88717 20.21917 Mean .1208 .0000 .0604 .3019 .3019 .1812 Anticipation e rrors (%) SD .70415 .0000 .50161 1.30179 1.08814 .85617 Mean 1.4493 1.2681 1.0870 1.3285 1.9324 3.8043 Incorrect re spo nses (%) SD 2.93117 2.40255 2.22005 2.52554 3.46991 5.09004 Mean .0145 .0870 .0435 .1449 .1014 .0870 False Alarms (%) SD .12039 .28384 .26760 .39390 .38900 .28384  M. Á. ROJAS-BENJUMEA ET AL. (f) (e) (d) r 2 = .640 p < .001 r 2 = .648 p < .001 r 2 = .730 p < .001 (a) (b) (c) r 2 = .711 p < .001 r 2 = .734 p < .001 r 2 = .498 p < .001 Figure 4. Relationship of age of the subjects vs reaction times (ms) taking in account the number of items in each stimulus for the two experimental conditions (pop-out and visual search). The upper row shows the pop-out condition and the lower row the visual search condition. (a) and (d) correspond to 2 items, (b) and (e) correspond to four items and (c) and (f) correspond to 6 items. The values of the determination coefficient (r2) and the significance value (p) are displayed. Notice the high statistically significant relationship of the inverse regression model for the six tasks. (f) (e) (d) r 2 = .498 p < .001 r 2 = .332 p < .001 r 2 = .167 p < .001 (a) (b) (c) r 2 = .230 p < .001 r 2 = .221 p < .001 r 2 = .615 p < .001 Figure 5. Relationship between the age of subjects vs the percentage of total errors and number of stimuli for the two ex- perimental conditions (pop-out and visual search). The upper row shows the pop-out condition, and the lower row shows the visual search condition. (a) and (d) correspond to the presentation of 2 stimuli, (b) and (e) corre- spond to four stimuli and (c) and (f) correspond to 6 stimuli. Notice the high variability in the young children for the visu al search four and six items (e) and (f). The values of the determination coefficient (r2) and the significance value (p) are displayed. Notice the high statistically significant relationship of the inverse regression model for the six tasks. Copyright © 2013 SciRes. 25  M. Á. ROJAS-BENJUMEA ET AL. Copyright © 2013 SciRes. 26 the different conditions and age groups. The omission errors increased with the number of items in the visual search condi- tion, particu larly in the youngest g roup. The effects of the interaction of the fac tors condition, number of items and age group was statistically significant (F[3423, 112,957] = 19,423, p < .001), indicating that the omission er- rors increase faster in the younger group with the number of items in the visual search condition than in the other groups, while in pop-out condition the number of omission errors is relatively steady in the different age groups. An intergroup ANOVA was computed with the between- subjects factor (3 groups of ages) and two within-subjects ANOVA factors: condition (pop-out, visual search) and items (2, 4, 6). The effect of the factor condition was statistically significant due to the higher number of omission errors of vis- ual search condition with respect to pop-out condition (F[1, 66] = 34,675), p < .001). The effect of the factor item was statistic- cally significant due to the increasing number of errors with the number of presented items (F[1884, 124,349] = 44,048), p < .001). The between subject factor was statistically significant (F[2, 66] = 25.977, p < .001), indicating different number of errors in the age groups. The Bonferroni comparison indicated that omission errors of youngest group were statistically sig- nificantly different from the other two groups (p < .001 and p < .001), while the middle age was not statistically different from the oldest group. The developmental trajectory of omission errors also showed an inverse relationship between age and omission errors in both conditions (Figure 6). This trend was much more marked in the more demanding visual search task with four and six items (Figures 6(e) and (f)), which also showed a high variability in the number of errors in the youngest children. Analysis of Incorrect Responses The Figure 3(d) shows the number of incorrect responses in the two experimental conditions. In visual search there was a slight increase in the number of errors with the number of pre- sented items. The effects of the interaction of the factors condition and number of items was statistically significant indicating that the omission errors in visual search increase faster with the number of items than in the pop-out condition (F[1711, 112,957] = 36,592), p < .001). The effects of the interaction of condition and age group was statistically significant (F[2, 66] = 20,671), p < .001) due to the higher increase with age of omission errors in visual search than in pop-out condition. The interaction of the number of items with the age group was statistically sig- nificant (F[3,768, 124,349] = 18,316), p < .001), indicating a decrease in omission errors with age. An intergroup ANOVA was computed, the between-subjects factor (3 groups of ages, see Figure 3(d)) and two within-sub- jects ANOVA factors: condition (pop-out, visual search) and items (2, 4, 6). The effect of the factor condition was statisti- cally significant due to the higher number of incorrect re- sponses in the visual search condition with respect to pop-out condition ((F[1, 66] = 5204), p < .026). The effect of the fac- tor number of items was statistically significant due to the in- creasing number of incorrect responses with the number of presented items (F[1850, 122,088] = 3918), p < .025). The (f) (e) (d) r 2 = .584 p < .001 r 2 = .498 p < .001 r 2 = .300 p < .001 r 2 = .194 p < .001 r 2 = .146 p < .001 r 2 = .275 p < .001 (a) (b) (c) Figure 6. Relationship between the age of the subjects with the percentage of omission errors and number of stimuli for the two experimental conditions (pop-out and visual search). The upper row shows the pop-out condition, and the lower row shows the visual search condition. (a) and (d) correspond to the presentation of 2 stimuli, (b) and (e) correspond to four stimuli and (c) and (f) correspond to 6 stimuli. Notice the high variability in the young children for the visual search four and six items ((e) and (f)). The values of the determination coefficient (r2) and the sig- nificance value (p) are displayed. Notice the high statistically significant relationship of the inverse regression model for the six tasks.  M. Á. ROJAS-BENJUMEA ET AL. between subjects factor was statistically significant (F[2, 66] = 4.336), p < .017), indicating different number of errors in the age groups. The Bonferroni comparisons indicated that incur- rect responses of the youngest group was not statistically sig- nificantly different from the middle age group but was statisti- cally significantly different from the oldest groups (p < .016), while the middle age was not statistically significantly different from the oldest group. The effects of the interaction of the factors condition and number of items was statistically significant indicating that the incorrect responses in visual search increase faster with the number of items than the pop-out condition (F[1984, 130,936] = 5272), p < .006). The effects of age did not interact with the effects of the other factors. The Figure 7 shows the inverse relationship between the age and the percentage of incorrect responses. However, this relationship was less statistically significant in most cases. For the six items visual search condition, the inverse model di d not fit the data and a quadratic model (a*age2 + b*age + c = 0) fitted developmental trajectory in a statistically significant manner. Variability in the RTs and Error Responses The developmental trajectories showed an apparent increase of variability in the percentage of errors in the youngest groups of children with respect to the oldest groups (Figures 5-7) in the most demanding conditions of visual search with four items (Figures 5(e), 6( e ) and 7(e)) and six items (Figures 5(f), 6(f) and 7(f)). Although for the less difficult conditions as pop-out and the two items visual search, a floor effect can be argued, for the most difficult tasks as visual search with four and six items, the 0% errors is only reached by a few subjects. The Figure 8 shows the variability of RTs and the different type of errors for the visual search condition with 6 items. The displayed histo- grams are in a year by year basis (left column) or in categorized age groups (right column). Variability for the RTs was not very different in the different age groups (Figure 8(a)). For the er- rors, the variability of young children is considerably higher than for older children. The histograms show that the floor effect cannot be argued to justify the increase in variability of the youngest children. This argument is particularly clear for the comparisons between the youngest and middle age groups, in which only a minimal part of the middle age group reach the 0% level in the total and omission errors (Figures 8(b) and (c)) . The Levene test for homogeneity of variances was applied to the comparison between the different groups (Table 2) for the visual search four and six items condition. The Table 2 shows that for RTs, there were not differences in variance in any of the groups, however in the youngest group there was an in- crease in variability of all type of errors with respect to the oldest group, and also of the youngest group with the middle group in total and omission errors, except for incorrect re- sponses in visual search with six items. The statistically sig- nificant differences in variances for the comparisons between the middle and oldest age groups were restricted to the omis- sion errors and incorrect responses in the visual search with six items task. (f) (c) (b) (a) r 2 = .100 p < .031 r 2 = .044 p < .084 r 2 = .052 p < .060 r 2 = .070 p < .028 r 2 = .025 p < .193 r 2 = .041 p < .095 (e) (d) Figure 7. Relationship between the age of the subjects vs the error rate of incorrect responses, taking in account the number of pre- sented items, for the two experimental conditions (pop-out and visual search). The upper row shows the pop-out condition and the lower row the visual search condition. (a) and (d) correspond to the presentation of 2 stimuli, (b) and (e) correspond to four stimuli and (c) and (f) correspond to 6 stimuli. The values of the determination coefficient (r2) and the significance value (p) are displayed. Copyright © 2013 SciRes. 27  M. Á. ROJAS-BENJUMEA ET AL. (d) (c) (b) (a) Figure 8. Histograms of reaction times (a), percentage of total errors (b), perc entage of omission err ors (c) and percentage of incorrect responses (d). The left column present the frequency histo- grams for each year, and the right column categorized by age groups. Stop Task The one-factor ANOVA (age groups) showed significant sta- tistically differences in reaction times to Go signal (F[2, 65] = 13.219, p < .001); omissions to Go signal (F[2, 65] = 9.673, p < .001) and responses to stop signal (F[2, 65] = 10.862, p < .001). The Bonferroni comparisons indicated that the reaction times to Go signal of the youngest group was statistically sig- nificant different from the pre-adolescent group (p < .001) and from the oldest groups (p < .011). The RTs of the youngest group were larger (mean: 517.29; SD: 41.28) compared to the RTs of pre-adolescents (mean: 447.92; SD: 64.27) and adoles- cent groups (mean: 463.45; SD: 46.17), while the preadoles- cent and the adolescent groups were not significantly different. The omissions to the Go signal of the youngest group was statistically significant different from the pre-adolescent group (p < .001) and from the oldest group (p < .002), while the pre-adolescents and the adolescent groups were not signifi- cantly different. The percentage of omissions of the youngest group were higher (mean: 25.52; SD: 13.80) comparing with the percentage of omissions of pre-adolescent (mean: 12.36; SD: 14.54) and adolescent groups (mean: 9.65; SD: 6.45). The percentage of responses to stop signal of the youngest group was statistically different from the pre-adolescent group (p < .001), with a reduced number of responses (mean: 13.22; SD: 10.15) with respect to pre-adolescents (mean: 29.36; SD: 15.49), while the comparisons between the other groups did not present significant statistically differences between each other. Developmental Trajectories The developmental trajectories (Figure 9) showed that there was an inverse relationship with age of the RTs (Figure 9(a)) and in the percentage of omissions to the Go responses (Figure Copyright © 2013 SciRes. 28 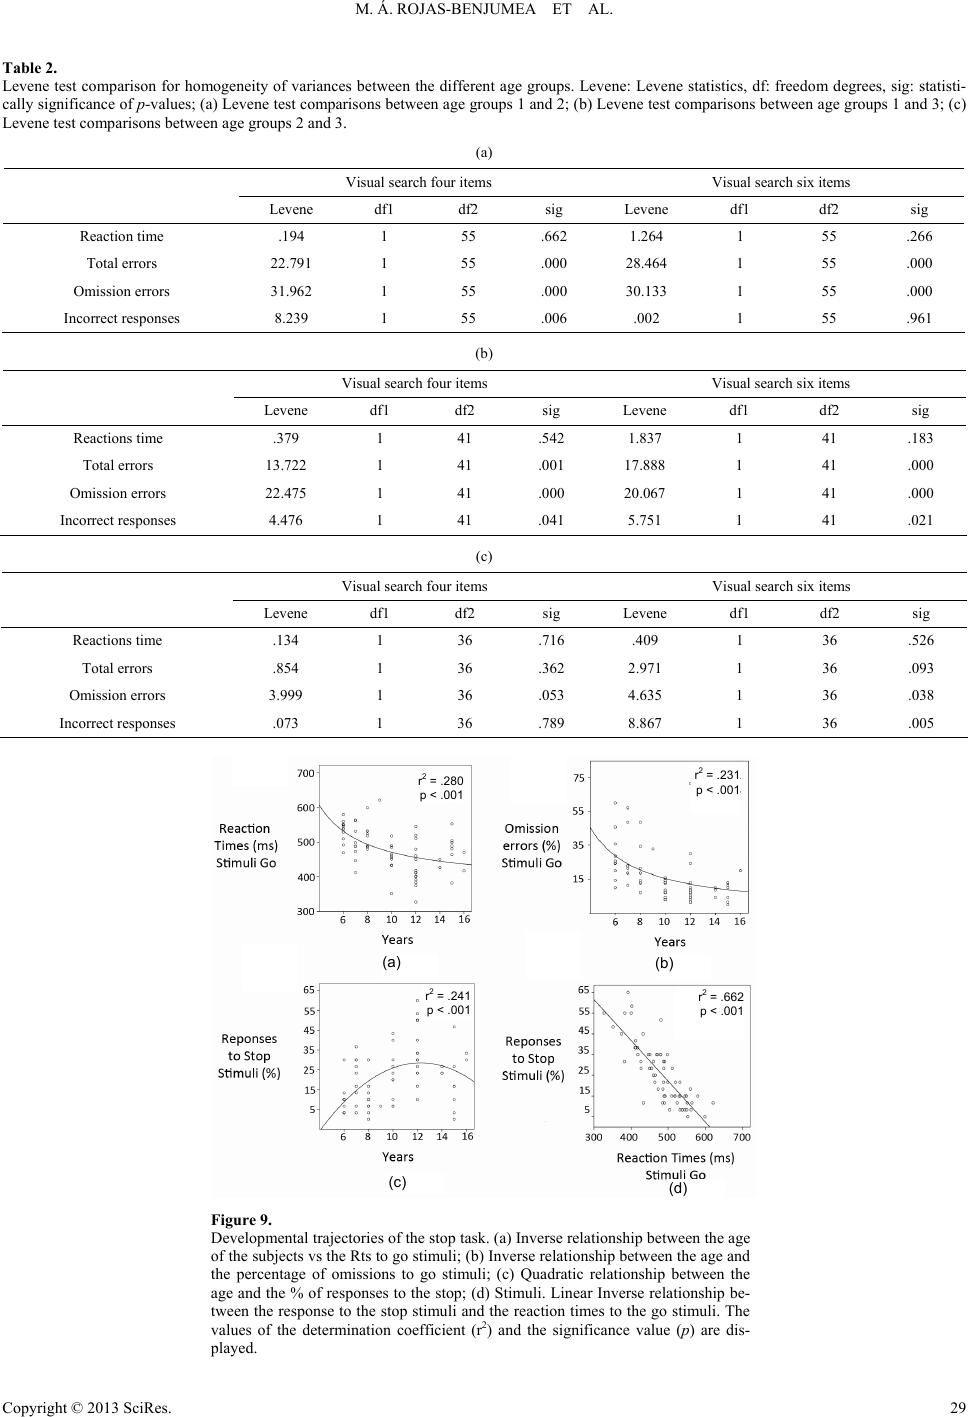 M. Á. ROJAS-BENJUMEA ET AL. Table 2. Levene test comparison for homogeneity of variances between the different age groups. Levene: Levene statistics, df: freedom degrees, sig: statisti- cally significance of p-values; (a) Levene test comparisons between age groups 1 and 2; (b) Levene test comparisons between age groups 1 and 3; (c) Levene test comparisons between age groups 2 and 3. (a) Visual search four items Visual search six items Levene df1 df2 sig Levene df1 df2 sig Reaction time .194 1 55 .662 1.264 1 55 .266 Total errors 22.791 1 55 .000 28.464 1 55 .000 Omission errors 31.962 1 55 .000 30.133 1 55 .000 Incorrect responses 8.239 1 55 .006 .002 1 55 .961 (b) Visual search four items Visual search six items Levene df1 df2 sig Levene df1 df2 sig Reactions time .379 1 41 .542 1.837 1 41 .183 Total errors 13.722 1 41 .001 17.888 1 41 .000 Omission errors 22.475 1 41 .000 20.067 1 41 .000 Incorrect responses 4.476 1 41 .041 5.751 1 41 .021 (c) Visual search four items Visual search six items Levene df1 df2 sig Levene df1 df2 sig Reactions time .134 1 36 .716 .409 1 36 .526 Total errors .854 1 36 .362 2.971 1 36 .093 Omission errors 3.999 1 36 .053 4.635 1 36 .038 Incorrect responses .073 1 36 .789 8.867 1 36 .005 (b) (a) (d) (c) r 2 = .662 p < .001 r 2 = .280 p < .001 r 2 = .231 p < .001 r 2 = .241 p < .001 Figure 9. Developmental trajectories of the stop task. (a) Inverse relationship between the age of the subjects vs the Rts to go stimuli; (b) Inverse relationship between the age and the percentage of omissions to go stimuli; (c) Quadratic relationship between the age and the % of responses to the stop; (d) Stimuli. Linear Inverse relationship be- tween the response to the stop stimuli and the reaction times to the go stimuli. The values of the determination coefficient (r2) and the significance value (p) are dis- played. Copyright © 2013 SciRes. 29 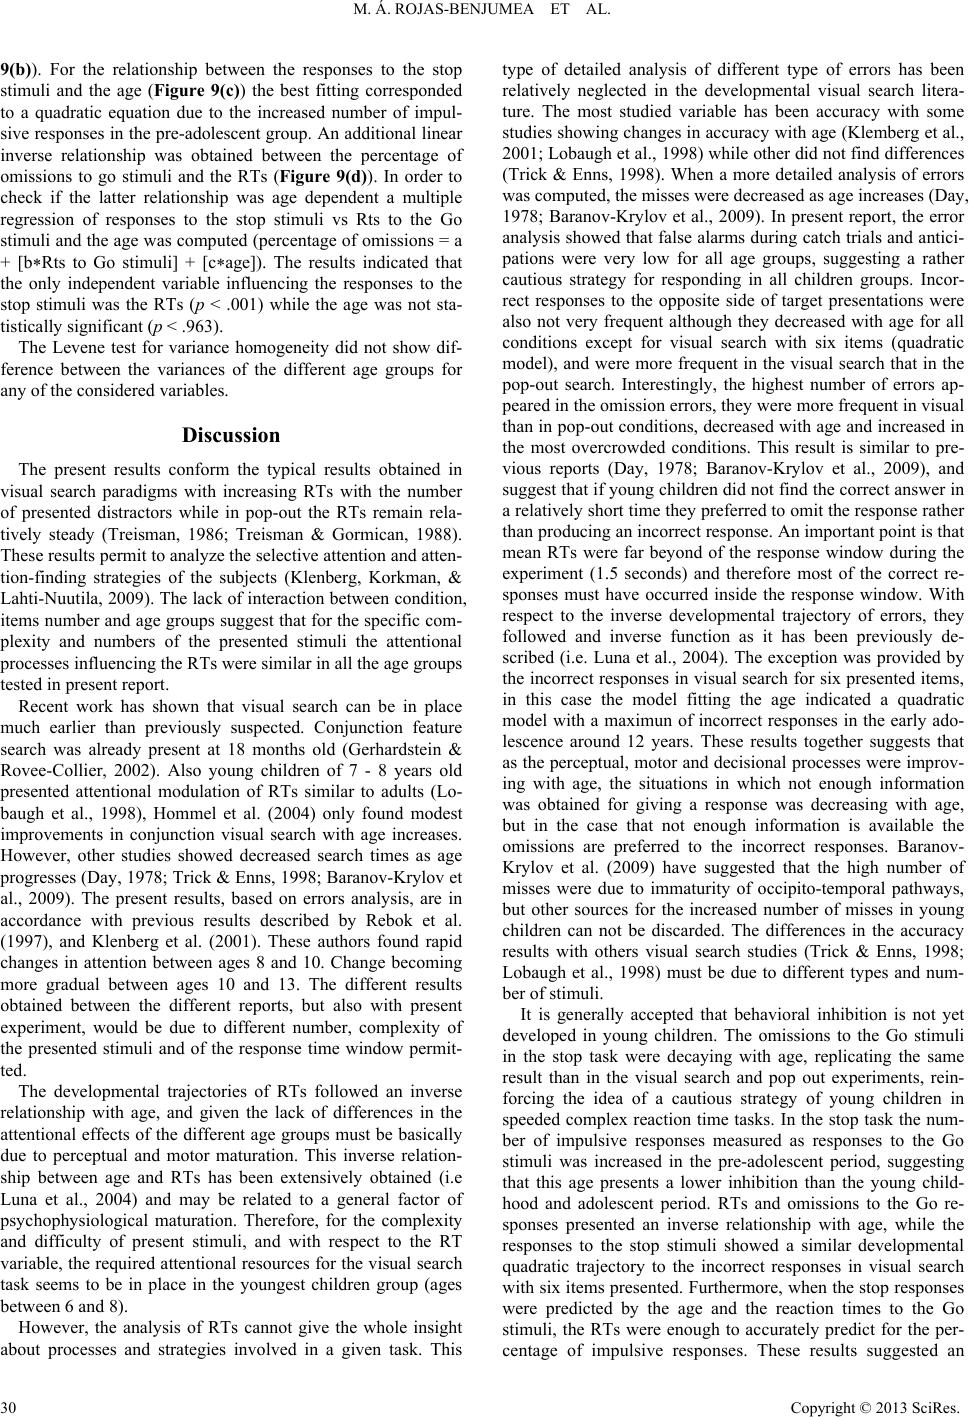 M. Á. ROJAS-BENJUMEA ET AL. 9(b)). For the relationship between the responses to the stop stimuli and the age (Figure 9(c)) the best fitting corresponded to a quadratic equation due to the increased number of impul- sive responses in the pre-adolescent group. An additional linear inverse relationship was obtained between the percentage of omissions to go stimuli and the RTs (Figure 9(d)). In order to check if the latter relationship was age dependent a multiple regression of responses to the stop stimuli vs Rts to the Go stimuli and the age was computed (percentage of omissions = a + [b*Rts to Go stimuli] + [c*age]). The results indicated that the only independent variable influencing the responses to the stop stimuli was the RTs (p < .001) while the age was not sta- tistically significant (p < .963). The Levene test for variance homogeneity did not show dif- ference between the variances of the different age groups for any of the considered variables. Discussion The present results conform the typical results obtained in visual search paradigms with increasing RTs with the number of presented distractors while in pop-out the RTs remain rela- tively steady (Treisman, 1986; Treisman & Gormican, 1988). These results permit to analyze the selective attention and atten- tion-finding strategies of the subjects (Klenberg, Korkman, & Lahti-Nuutila, 2009). The lack of interaction between condition, items number and age groups suggest that for the specific com- plexity and numbers of the presented stimuli the attentional processes influencing the RTs were similar in all the age groups tested in present report. Recent work has shown that visual search can be in place much earlier than previously suspected. Conjunction feature search was already present at 18 months old (Gerhardstein & Rovee-Collier, 2002). Also young children of 7 - 8 years old presented attentional modulation of RTs similar to adults (Lo- baugh et al., 1998), Hommel et al. (2004) only found modest improvements in conjunction visual search with age increases. However, other studies showed decreased search times as age progresses (Day, 1978; Trick & Enns, 1998; Baranov-Krylov et al., 2009). The present results, based on errors analysis, are in accordance with previous results described by Rebok et al. (1997), and Klenberg et al. (2001). These authors found rapid changes in attention between ages 8 and 10. Change becoming more gradual between ages 10 and 13. The different results obtained between the different reports, but also with present experiment, would be due to different number, complexity of the presented stimuli and of the response time window permit- ted. The developmental trajectories of RTs followed an inverse relationship with age, and given the lack of differences in the attentional effects of the different age groups must be basically due to perceptual and motor maturation. This inverse relation- ship between age and RTs has been extensively obtained (i.e Luna et al., 2004) and may be related to a general factor of psychophysiological maturation. Therefore, for the complexity and difficulty of present stimuli, and with respect to the RT variable, the required attentional resources for the visual search task seems to be in place in the youngest children group (ages between 6 and 8). However, the analysis of RTs cannot give the whole insight about processes and strategies involved in a given task. This type of detailed analysis of different type of errors has been relatively neglected in the developmental visual search litera- ture. The most studied variable has been accuracy with some studies showing changes in accuracy with age (Klemberg et al., 2001; Lobaugh et al., 1998) while other did not find differences (Trick & Enns, 1998). When a more detailed analysis of errors was computed, the misses were decreased as age increases (Day, 1978; Baranov-Krylov et al., 2009). In present report, the error analysis showed that false alarms during catch trials and antici- pations were very low for all age groups, suggesting a rather cautious strategy for responding in all children groups. Incor- rect responses to the opposite side of target presentations were also not very frequent although they decreased with age for all conditions except for visual search with six items (quadratic model), and were more frequent in the visual search that in the pop-out search. Interestingly, the highest number of errors ap- peared in the omission errors, they were more frequent in visual than in pop-out conditions, decreased with age and increased in the most overcrowded conditions. This result is similar to pre- vious reports (Day, 1978; Baranov-Krylov et al., 2009), and suggest that if young children did not find the correct answer in a relatively short time they preferred to omit the response rather than producing an incorrect response. An important point is that mean RTs were far beyond of the response window during the experiment (1.5 seconds) and therefore most of the correct re- sponses must have occurred inside the response window. With respect to the inverse developmental trajectory of errors, they followed and inverse function as it has been previously de- scribed (i.e. Luna et al., 2004). The exception was provided by the incorrect responses in visual search for six presented items, in this case the model fitting the age indicated a quadratic model with a maximun of incorrect responses in the early ado- lescence around 12 years. These results together suggests that as the perceptual, motor and decisional processes were improv- ing with age, the situations in which not enough information was obtained for giving a response was decreasing with age, but in the case that not enough information is available the omissions are preferred to the incorrect responses. Baranov- Krylov et al. (2009) have suggested that the high number of misses were due to immaturity of occipito-temporal pathways, but other sources for the increased number of misses in young children can not be discarded. The differences in the accuracy results with others visual search studies (Trick & Enns, 1998; Lobaugh et al., 1998) must be due to different types and num- ber of stimuli. It is generally accepted that behavioral inhibition is not yet developed in young children. The omissions to the Go stimuli in the stop task were decaying with age, replicating the same result than in the visual search and pop out experiments, rein- forcing the idea of a cautious strategy of young children in speeded complex reaction time tasks. In the stop task the num- ber of impulsive responses measured as responses to the Go stimuli was increased in the pre-adolescent period, suggesting that this age presents a lower inhibition than the young child- hood and adolescent period. RTs and omissions to the Go re- sponses presented an inverse relationship with age, while the responses to the stop stimuli showed a similar developmental quadratic trajectory to the incorrect responses in visual search with six items presented. Furthermore, when the stop responses were predicted by the age and the reaction times to the Go stimuli, the RTs were enough to accurately predict for the per- centage of impulsive responses. These results suggested an Copyright © 2013 SciRes. 30  M. Á. ROJAS-BENJUMEA ET AL. impulsive decisional bias in this pre-adolescent period in speed- ed complex reaction times. One of the most interesting results was the increased vari- ability in the number of errors in younger children with respect to older children. This effect was more prominent in the omis- sion errors and in the most difficult tasks, the visual search with four and six items. The analysis of histograms suggests that this increased variability cannot be attributed to a floor effect given that very few subjects obtained a 0% error in these two visual search tasks. This increased variability of errors has not previ- ously studied in studies of visual search development, probably due to the low number of errors in most studies. In many other cognitive tasks it is possible to appreciate a similar phenome- non although it has not been explicitly studied, i.e. the number of saccade errors in the antisaccadic task, the accuracy of the final gaze location in the oculomotor delayed response task (Luna et al., 2004) and in the judgement of pairs of similarity of hierarchical shapes (global or local) (Mondloch et al., 2003). The increased variability in errors is probably due a broad window of psychophysiological and neuroanatomical matura- tion, affecting decisional processes in difficult tasks, which is reached at slightly different ages by normal children. However, one serious limitation of the present report of increased vari- ability of the errors in early childhood with respect to late childhood is that cohort type studies do not guarantee that all young children would arrive to the high performance levels of the oldest children. However, is highly improbable that given the nature of normally scholarized children who participated in present study, this cohort bias would reverse the results of in- creased accuracy variability in early childhood with respect to old childhood. In summary, mean RTs and errors in visual search follow the pattern of increase with the number of items and decrease with age, while in pop-out errors the RTs and errors remained rela- tively steady. For RTs, most of the differences between the age groups seem to be accounted by motor and/or perceptual effects rather than to attentional effects. However, for the errors the perceptual discriminability of targets and a cautious response attitude would explain the results. The developmental trajecto- ries of RTs and errors, basically omissions, follow an inverse relationship with age. The increased variability in errors in children between 6 - 8 years suggests that a broad maturational window occurs for the responding decision process in young children. On the other hand, children would have a cautious attitude for responding when perceptual discrimination is diffi- cult, several choices are available and a very limited time for responses are permitted. A limitation of our study is the sample number. This is small and the number of subjects is not balanced for all age groups. Also an extension to young adulthood would be desirable. In present study we have not differentiated between children who do not play the videogames and children often playing those games. These shortcomings should be avo id e d in future studies. Acknowledgements We want to thanks to Carlos Chinchilla for editing the fig- ures and to Catarina I. Barriga-Paulino for reviewing the manu- script. Present work was supported by grant number (PSI2010- 17523) of the Spanish Ministry of science and Innovation and FEDER funds of the European Union. REFERENCES Adler, S. A., & Orprecio, J. (2006). The eyes have it: Visual pop-out in infants and adults. Developmental Science, 9, 189-206. doi:10.1111/j.1467-7687.2006.00479.x Baranov-Krylov, I. N., Kuznetsova, T. G., & Ratnikova, V. K. (2009). Attention parameters in visual search task in different age groups. Neuroscience and Behav io r a l Physiology, 39, 481-482. doi:10.1007/s11055-009-9153-3 Cave, K. R., & Wolfe, J. M. (1990). Modeling the role of parallel proc- essing in visual search. Cognitive Psychology, 22, 225-271. doi:10.1016/0010-0285(90)90017-X Day, M. C. (1978). Visual search by children: The effect of background variation and the use of visual cues. Journal of Experimental Child Psychology, 25, l-16. doi:10.1016/0022-0965(78)90034-6 Dye, M., & Bavelier, D. (2010) Differential development of visual attention skills in school-age children. Vision R esearch, 50, 452-459. doi:10.1016/j.visres.2009.10.010 Duncan, J., & Humphreys. G. W. (1989). Visual search and stimulus similarity. Psychological Review, 96, 433-458. doi:10.1037/0033-295X.96.3.433 Forsman, R., (1967). Age differences in the effects of stimulus com- plexity and symmetrical form on choice reaction and visual search performance. Journal of Experimental Child Psychology, 5, 406-429. doi:10.1016/0022-0965(67)90068-9 Gerhardstein, P., & Rovee-Collier, C. (2002). The development of visual search in infants and very young children. Journal of Experi- mental Child Psychology, 81, 194-215. doi:10.1006/jecp.2001.2649 Hommel, B., Li, K. Z. H., & Li, S.-C. (2004). Visual search across the life span. Developmental Psychology, 40, 545-558. doi:10.1037/0012-1649.40.4.545 Joseph, J. S., Chun, M. M., & Nakayama, K. (1997). Attentional re- quirements in a “preattentive” feature search task. Nature, 387, 805- 807. doi:10.1038/42940 Klenberg, L., Korkman, M., & Lahti-Nuuttila, P. (2001). Differential development of attention and executive functions in 3 to 12 years-old Finnish children. Develop mental Neuropsychology, 20, 407-428. doi:10.1207/S15326942DN2001_6 Lobaugh, N. J., Cole, S., & Rovet, J. F. (1998). Visual search for fea- tures and conjunctions in development. Canadian Journal of Ex- perimental Psychology, 52, 201-211. doi:10.1037/h0087293 Logan, G. D., & Cowan W. B. (1984). On the ability to inhibit thought and action: A theory of an act of control. Psychological Review, 91, 295-327. doi:10.1037/0033-295X.91.3.295 Luna, B., Garver, E., Urban, T. A., Lazar, N. A., & Sweeney, J. A. (2004). Maturation of cognitive processes from late childhood to adulthood. Child Development, 75, 1357-1375. doi:10.1111/j.1467-8624.2004.00745.x Mondloch, C. J., Geldart, S., Maurer, D., & de Schonen, S. (2003). Developmental changes in the processing of hierarchical shapes con- tinue into adolescence. Journal of Experimental Child Psychology, 84, 20-40. doi:10.1016/S0022-0965(02)00161-3 Plude, D. J., Enns, J. T., & Brodeur, D. (1994). The development of se- lective attention: A life-span overview. Acta Psychologica, 86, 227- 272. doi:10.1016/0001-6918(94)90004-3 Rebok, G. W., Smith, C. B., Pascualvaca, D. M., Mirsky, A. F., An- thony, B. J., & Kellam, S. G. (1997). Developmental changes in at- tentional performance in urban children from eight to thirteen years. Child Neuropsychology, 3, 28-46. doi:10.1080/09297049708401366 Ruskin, E. M., & Kaye, D. B. (1990). Developmental differences in visual precessing: Strategy versus structure. Journal of Experimental Child Psychology, 50, 1-24. doi:10.1016/0022-0965(90)90029-8 Thompson, L. A., & Massaro, D. W. (1989) Before you see it, you see its parts: Evidence for feature encoding and integration in preschool children and adults. Cognitive Psychology, 21, 334-362. doi:10.1016/0010-0285(89)90012-1 Treisman, A. M., & Gelade, G. (1980). A feature-integration theory of attention. Cognitive Psychology, 12, 97-136. doi:10.1016/0010-0285(80)90005-5 Treisman, A., & Gormican, S. (1988). Feature analysis in early vision: Evidence from search asymmetries. Psychological Review, 95, 15-48. Copyright © 2013 SciRes. 31  M. Á. ROJAS-BENJUMEA ET AL. Copyright © 2013 SciRes. 32 doi:10.1037/0033-295X.95.1.15 Treisman, A. M. (1986). Properties, parts, and objects. In K. Boff, L. Kaufman, & J. Thomas (Eds.), Handbook of perception and human performance (Vol. 2, pp. 1-70). Hoboken: Wiley. Trick, L. M., & Enns, J. T. (1998). Lifespan changes in attention: The visual search task. Cognitive Development, 13, 369-386. doi:10.1016/S0885-2014(98)90016-8 Van Essen, D. C., & Gallant, J. L. (1994) Neural mechanisms of form and motion processing in the primate visual system. Neuron, 13, 1-10. doi:10.1016/0896-6273(94)90455-3
|