 Psychology 2012. Vol.3, No.12A, 1183-1188 Published Online December 2012 in SciRes (http://www.SciRP.org/journal/psych) http://dx.doi.org/10.4236/psych.2012.312A175 Copyright © 2012 SciRes. 1183 Individual Differences in Recognizing Spontaneous Emotional Expressions: Their Implications for Positive Interpersonal Relationships Sun-Mee Kang Department of Psychology, California State University, Northridge, USA Email: skang@csun.edu Received September 29th, 2012; revised October 22nd, 2012; accepted November 17th, 2012 The main purpose of the current study was to introduce the Spontaneous Expressions Recognition Test (SERT), a new thin-slice measure of emotion recognition for normative adults, and demonstrate its rela- tive strengths for predicting positive interpersonal relationships. To explore this question, a semester-long longitudinal study was conducted. In this study, college students were randomly assigned to small re- search teams and worked together throughout the semester to conduct group research projects. Peer rat- ings of interpersonal relationships were collected at the end of the semester. The results provided pre- liminary support for the SERT, by demonstrating its relative strength for predicting positive interpersonal relationships. Keywords: Emotion Recognition; Spontaneous Expressions; Interpersonal Relationships; Thin-Slice Measure; Peer Ratings Introduction Knowing others’ feelings is one of the core abilities that con- tributes to maintaining positive interpersonal relationships (Ambady, LaPlante, & Johnson, 2001; Hall, Andrzejewski, & Yopchick, 2009; Hall, Bernieri, & Carney, 2005; Pickett, Gardner, & Knowles, 2004). Individual differences in this core ability have been assessed using a wide range of tests devel- oped during the past several decades. A literature review re- veals that there are quite a few self-reported measures, includ- ing the Perceived Decoding Ability scale (Zuckerman & Lar- rance, 1979), the Questionnaire Measure of Emotional Empathy (Mehrabian & Epstein, 1972), and the Social Skills Inventory (Riggio, 1986). Although they have been widely recognized and used in psychological research, these self-reported mea- sures have fundamental limitations, because they ask individu- als to report their own level of emotion recognition ability. Since people are not particularly good at judging their own abilities (Ickes, 1993; Ickes et al., 2000), performance-based measures thrive as a viable alternative to self-reported measures. The long list of performance-based tests includes, although not comprehensive, the Brief Affect Recognition Test (BART; Ekman & Friesen, 1974), the Pictures of Facial Affects (POFA; Ekman & Friesen, 1976), the Japanese and Caucasian Brief Affect Recognition Test (JACBART; Masumoto et al., 2000), the Diagnostic Analysis of Nonverbal Accuracy (DANVA; Nowicki & Duke, 1994), the Profile of Nonverbal Sensitivity (PONS; Rosenthal, Hall, DiMatteo, Rogers, & Archer, 1979) test, the Child and Adolescent Social Perception measure (CASP; Magill-Evans, Koning, Cameron-Sadava, & Manyk, 1995), The Awareness of Social Inference Test (TASIT; McDonald, Flanagan, & Rollings, 2003), and the Multimodal Emotion Recognition Test (MERT; Bänziger, Grandjean, & Scherer, 2009). An intensive review of the existing tests revealed that sur- prisingly, few measures adopted spontaneous expressions as test stimuli. In most cases, the emotional expressions of the target people were determined by the researchers who devel- oped the tests, rather than by the targets who expressed the emotions. Thus, the targets were instructed either to move their facial muscles to create certain facial expressions (e.g., the BART, the POFA, and the JACBART) or to express emotions based on given scripts (e.g., the PONS, the DANVA, the CASP, the TASIT, and th e MERT). Using posed expressions in emotion recognition tests has a number of merits. This approach gives researchers control over certain features of their test, including the range of the emotions assessed and the degree of intensity of emotions expressed (Bänziger, Grandjean, & Scherer, 2009). The downside is that the ecological validity of the tests developed under this ap- proach is somewhat compromised, because posed expressions tend to be less natural than spontaneous expressions (Russell, 1994; Trimboli & Walker, 1993). In sum, the literature review shows that very few measures of emotion recognition that employ spontaneous emotional ex- pressions are currently available for normative adult popula- tions. The main purpose of the current study was to developing a new test to fill this gap and to demonstrate the relative strengths of the new test compared with several of existing emotion rec- ognition tests . The Spontaneous Expressions Recognition Test: A New Measure for Normative Adults A critical issue in the development of an emotion recognition test is determining what the target person in the test question is feeling (Mayer & Geher, 1996; Trimboli & Walker, 1993). Mayer and Geher (1996) listed three criteria for determining the  S.-M. KANG target’s emotions: target agreement, consensus agreement, and expert judgment. Since only the individual experiencing an emotion has direct access to it (Mayer & Geher, 1996; Nisbett & Wilson, 1977), it seems justified to use the target’s self-re- ported emotions as the correct answer. In this vein, the empathy accuracy paradigm developed by Ickes and his colleagues (Ickes, Bissonnette, Garcia, & Stinson, 1990) provides one way to obtain the correct answers for emo- tional experiences of the target person. Ickes and his colleagues created an experimental setting in which two strangers interact with each other for a short time (e.g., 6 minutes) and this ses- sion is videotaped by a hidden camera. Following the taping, the two participants are instructed to watch the videotape alone in separate rooms, stopping the tape at points where they re- member having had a specific thought or feeling. They are, then, asked to review the videotape a second time, and this time the video is stopped at the points at which their interaction partner reported a thought or feeling. The participants’ task is to infer the thoughts or feelings of their interaction partner. These in- ferences are compared with the actual thoughts and feelings to assess empathic accuracy. Although this paradigm was originally developed to measure empathic accuracy between two strangers involved in a social scene, it has been widely applied to other settings beyond dy- adic interaction (Barone, Hutchings, Kimmel, Traub, Cooper, & Marshall, 2005; Klein & Hodge, 2001; Marangoni, Garcia, Ickes, & Teng, 1995; Pickett, Gardner, & Knowles, 2004). A new measure of emotion recognition, the Spontaneous Ex- pressions Recognition Test (SERT), was developed by adopting this empathy accuracy paradigm in the current study. Possible Advantages of Using Spontaneous Expressions as Study Stimuli Given the plethora of existing measures of emotion recogni- tion, it is essential to explain why another emotion recognition test needed to be developed. As discussed before, the SERT is one of the few tests for normative adults that uses spontaneous emotional expressions. One advantage of using spontaneous emotional expressions as study stimuli, instead of posed emo- tional expressions, is that doing so promotes the ecological validity of the test. Furthermore, the spontaneous emotional ex- pressions in the SERT are presented as “thinslices” (Ambady, LaPlante, & Johnson, 2001). A thin-slice is a short excerpt, usually less than 5 minutes long, extracted from a behavioral stream (Ambady, LaPlante, & Johnson, 2001). A merit of the thin-slice measures, compared to still photo tests, is that they provide richer information on expressed emo- tions. They not only provide some context for the presented emotional expressions, but also allow changes in expression to be charted through a stream of behavioral sequences over time. Since the format (short video clips) and the content (spontane- ous expressions) of the SERT more closely resemble natural interactions in which people read others’ emotions, these fea- tures should contribute to the greater ecological validity of the SERT. Previous studies have shown that individual differences in emotion recognition are associated with positive interpersonal adjustment (Ambady, LaPlante, & Johnson, 2001; Hall, An- drzejewski, & Yopchick, 2009; Pickett, Gardner, & Knowles, 2004). If an individual recognizes what an interaction partner is feeling during social interactions, that individual is more likely to respond appropriately to the interaction partner (Ambady, LaPlante, & Johnson, 2001). For this reason, someone better at emotion recognition is more likely to maintain positive inter- personal relationships with others. If the SERT has greater ecological validity than other tests, it should also display rela- tive strength in predicting positive interpersonal relationships when compared with those emotion recognition measures. To test this question, a semester-long longitudinal study was conducted. In this study, college students were randomly as- signed to small research teams that worked together through- out the semester conducting group research projects. This en- abled the team members to serve as qualified peer raters of interpersonal relationships of each team member at the end of the semester. The present study was conducted to investigate the relative strength of the SERT, compared with several exist- ing measures, in predicting positive interpersonal relationships. Method Participants Ninety-six undergraduate students enrolled in the “Research Methods in Psychology” class at a large state university on the West Coast served as the participants in this project. All par- ticipants ranged in age from 18 to 29 years, with a mean age of 22.66 years (SD = 2.06). The majority of the students (82.3%) were women. Materials The SERT. In the first phase, an interview study was con- ducted to develop a pool of stimulus video clips. Twenty-six European American college students (18 women and 8 men) were interviewed in individual 25-minute sessions in which they discussed their meaningful life experiences in a free-for- mat interview. The interview sessions were videotaped with the participants’ consent. Immediately after the interview, each interviewee was asked to review her or his own tape alone and was instructed to stop the tape at any point during which the interviewee remembered having had a specific emotion and record how she or he felt at that moment of the interview, al ong with the time stamp corresponding to the segment. After the review, interviewees were asked for their consent for using portions of the tape to develop a stimulus video for future stud- ies. The interviewees were not told about this request until the review sessions were done in order to allow the interviewees to behave more naturally during the interview. Three interviewees refused to give their permission, and their interview tapes were immediately erased. To extract the marked segments from the interview tapes, the interview tapes were edited using Adobe Premier 6.0. The re- ported time stamp served as the ending point of each clip, and the starting point was chosen on the basis of two considerations: 1) providing decoders with the smallest amount of information sufficient for identifying the emotional experience of the inter- viewee and/or 2) respecting the natural transition points of the dialogues. In order to avoid later complications in calculating recognition accuracy scores, only segments associated with a single reported emotion were selected. All the extracted segments were initially reviewed by the au- thor. An issue that emerged during this initial review was that it was too challenging, in many cases, for examinees to identify the emotions reported by the interviewees, because there were Copyright © 2012 SciRes. 1184 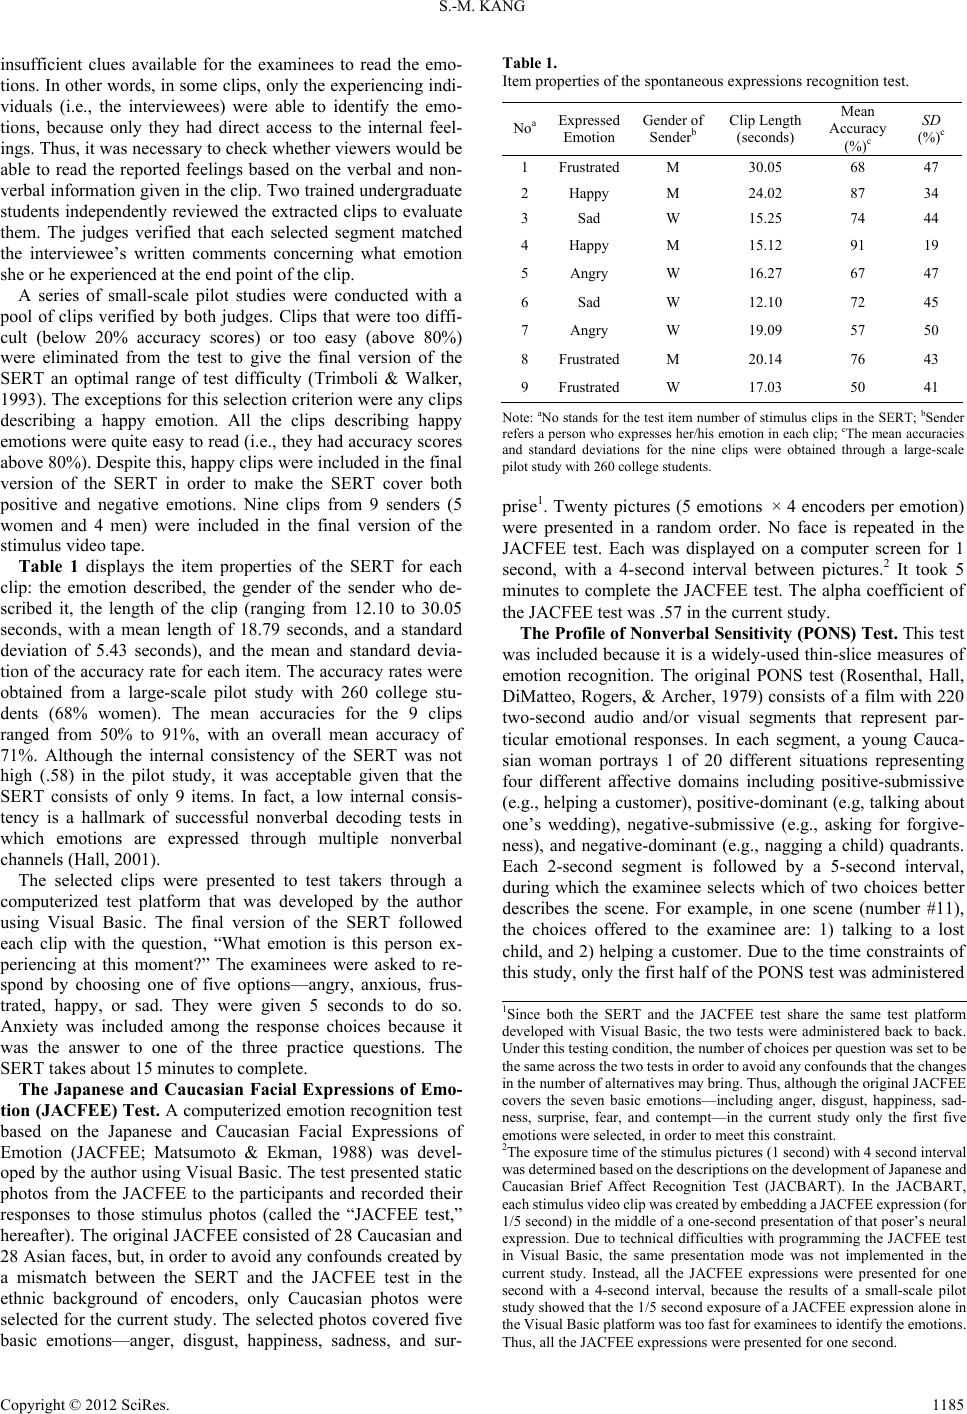 S.-M. KANG insufficient clues available for the examinees to read the emo- tions. In other words, in some clips, only the experiencing indi- viduals (i.e., the interviewees) were able to identify the emo- tions, because only they had direct access to the internal feel- ings. Thus, it was necessary to check whether viewers would be able to read the reported feelings based on the verbal and non- verbal information given in the clip. Two trained undergraduate students independently reviewed the extracted clips to evaluate them. The judges verified that each selected segment matched the interviewee’s written comments concerning what emotion she or he experienced at the end point of the clip. A series of small-scale pilot studies were conducted with a pool of clips verified by both judges. Clips that were too diffi- cult (below 20% accuracy scores) or too easy (above 80%) were eliminated from the test to give the final version of the SERT an optimal range of test difficulty (Trimboli & Walker, 1993). The exceptions for this selection criterion were any clips describing a happy emotion. All the clips describing happy emotions were quite easy to read (i.e., they had accuracy scores above 80%). Despite this, happy clips were included in the final version of the SERT in order to make the SERT cover both positive and negative emotions. Nine clips from 9 senders (5 women and 4 men) were included in the final version of the stimulus video tape. Table 1 displays the item properties of the SERT for each clip: the emotion described, the gender of the sender who de- scribed it, the length of the clip (ranging from 12.10 to 30.05 seconds, with a mean length of 18.79 seconds, and a standard deviation of 5.43 seconds), and the mean and standard devia- tion of the accuracy rate for each item. The accuracy rates were obtained from a large-scale pilot study with 260 college stu- dents (68% women). The mean accuracies for the 9 clips ranged from 50% to 91%, with an overall mean accuracy of 71%. Although the internal consistency of the SERT was not high (.58) in the pilot study, it was acceptable given that the SERT consists of only 9 items. In fact, a low internal consis- tency is a hallmark of successful nonverbal decoding tests in which emotions are expressed through multiple nonverbal channels (Hall, 2001). The selected clips were presented to test takers through a computerized test platform that was developed by the author using Visual Basic. The final version of the SERT followed each clip with the question, “What emotion is this person ex- periencing at this moment?” The examinees were asked to re- spond by choosing one of five options—angry, anxious, frus- trated, happy, or sad. They were given 5 seconds to do so. Anxiety was included among the response choices because it was the answer to one of the three practice questions. The SERT takes about 15 minutes to complete. The Japanese and Caucasian Facial Expressions of Emo- tion (JACFEE) Test. A computerized emotion recognition test based on the Japanese and Caucasian Facial Expressions of Emotion (JACFEE; Matsumoto & Ekman, 1988) was devel- oped by the author using Visual Basic. The test presented static photos from the JACFEE to the participants and recorded their responses to those stimulus photos (called the “JACFEE test,” hereafter). The original JACFEE consisted of 28 Caucasian and 28 Asian faces, but, in order to avoid any confounds created by a mismatch between the SERT and the JACFEE test in the ethnic background of encoders, only Caucasian photos were selected for the current study. The selected photos covered five basic emotions—anger, disgust, happiness, sadness, and sur- Table 1. Item properties of the spontaneous expressions recognitio n t es t. NoaExpressed Emotion Gender of Senderb Clip Length (seconds) Mean Accuracy (%)c SD (%)c 1 FrustratedM 30.05 68 47 2 Happy M 24.02 87 34 3 Sad W 15.25 74 44 4 Happy M 15.12 91 19 5 Angry W 16.27 67 47 6 Sad W 12.10 72 45 7 Angry W 19.09 57 50 8 FrustratedM 20.14 76 43 9 FrustratedW 17.03 50 41 Note: aNo stands for the test item number of stimulus clips in the SERT; bSender refers a person who expresses her/his emotion in each clip; cThe mean accuracies and standard deviations for the nine clips were obtained through a large-scale pilot study with 260 college stud ents. prise1. Twenty pictures (5 emotions × 4 encoders per emotion) were presented in a random order. No face is repeated in the JACFEE test. Each was displayed on a computer screen for 1 second, with a 4-second interval between pictures.2 It took 5 minutes to complete the JACFEE test. The alpha coefficient of the JACFEE test was .57 in the current study. The Profile of Nonverbal Sensiti vity (PONS) Test. This te st was included because it is a widely-used thin-slice measures of emotion recognition. The original PONS test (Rosenthal, Hall, DiMatteo, Rogers, & Archer, 1979) consists of a film with 220 two-second audio and/or visual segments that represent par- ticular emotional responses. In each segment, a young Cauca- sian woman portrays 1 of 20 different situations representing four different affective domains including positive-submissive (e.g., helping a customer), positive-dominant (e.g, talking about one’s wedding), negative-submissive (e.g., asking for forgive- ness), and negative-dominant (e.g., nagging a child) quadrants. Each 2-second segment is followed by a 5-second interval, during which the examinee selects which of two choices better describes the scene. For example, in one scene (number #11), the choices offered to the examinee are: 1) talking to a lost child, and 2) helping a customer. Due to the time constraints of this study, only the first half of the PONS test was administered 1Since both the SERT and the JACFEE test share the same test platform developed with Visual Basic, the two tests were administered back to back. Under this testin g c onditi on, the n um ber of c hoic es pe r question was se t to be the same across the two tests in order to avoid any confounds that the changes in the number of alternative s may bring. Thus, alt hough the original JACFEE covers the seven basic emotions—including anger, disgust, happiness, sad- ness, surprise, fear, and contempt—in the current study only the first five emotions were selected, i n order to meet this constraint. 2The exposure time of the stimulus pic tures (1 second) w ith 4 second interval was determ ined base d on the de scriptio ns on the developm ent of Japa nese an d Caucasian Brief Affect Recognition Test (JACBART). In the JACBART, each stimulus video clip was created by em edding a JACF EE expressio n (for 1/5 second) in the middle of a one-second presentation of that poser’s neural expression. Due to technical difficulties with programming the JACFEE test in Visual Basic, the same presentation mode was not implemented in the current study. Instead, all the JACFEE expressions were presented for one second with a 4-second interval, because the results of a small-scale pilot study showed that the 1/5 second exposure of a JACFEE expression alone in the Visual Basic platform was too fast for examinees to identify the emotions. Thus, all the JACFEE expressio ns were presente d for one second. Copyright © 2012 SciRes. 1185 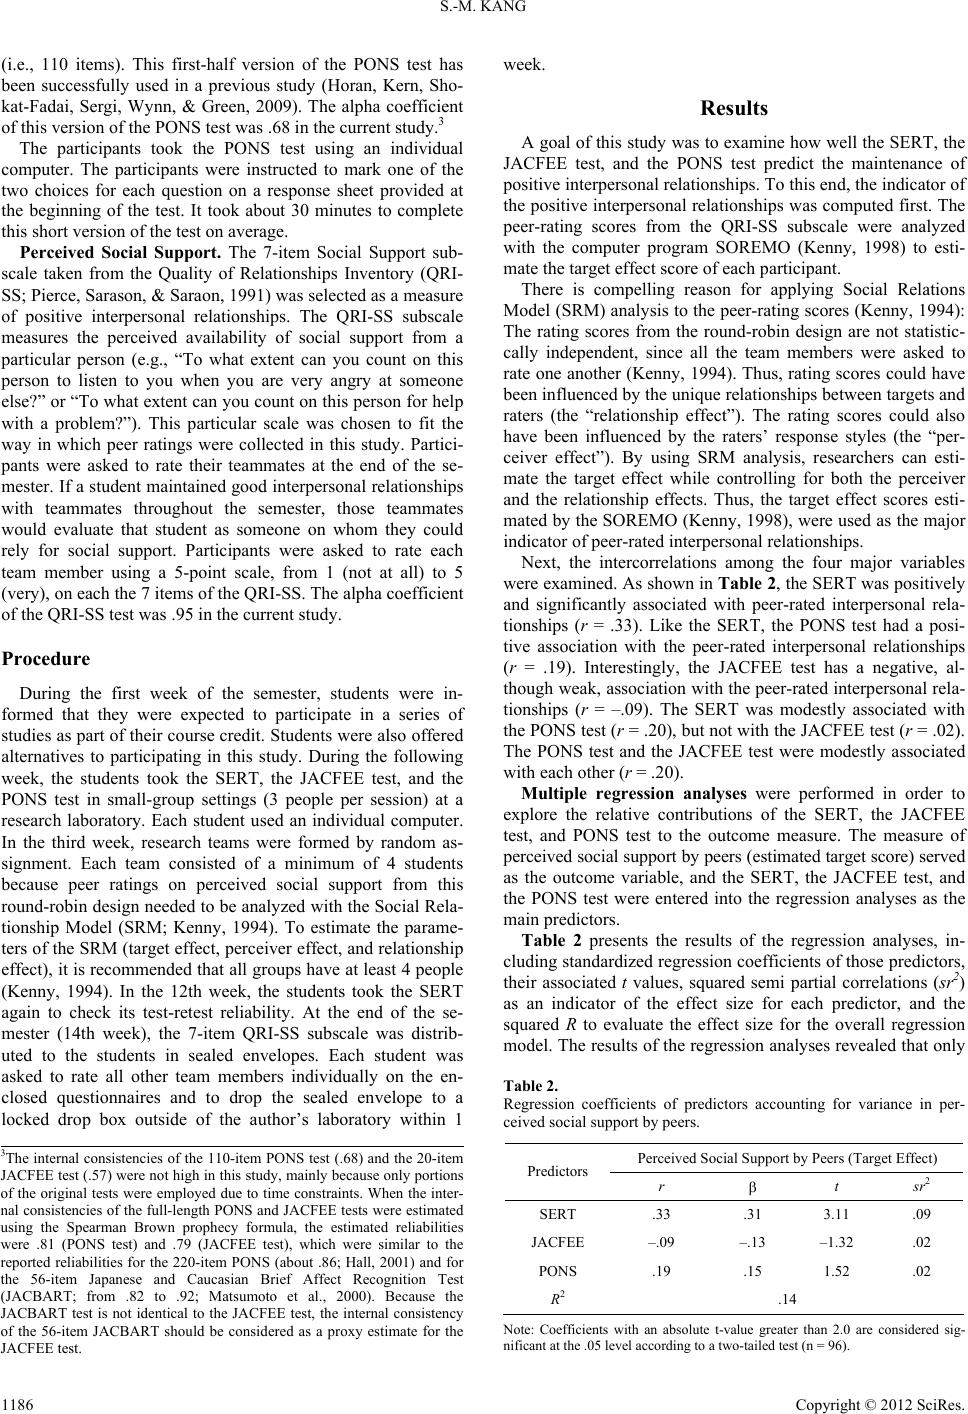 S.-M. KANG (i.e., 110 items). This first-half version of the PONS test has been successfully used in a previous study (Horan, Kern, Sho- kat-Fadai, Sergi, Wynn, & Green, 2009). The alpha coefficient of this version of the PONS test was .68 in the current study.3 The participants took the PONS test using an individual computer. The participants were instructed to mark one of the two choices for each question on a response sheet provided at the beginning of the test. It took about 30 minutes to complete this short version of the test on average. Perceived Social Support. The 7-item Social Support sub- scale taken from the Quality of Relationships Inventory (QRI- SS; Pierce, Sarason, & Saraon, 1991) was selected as a measure of positive interpersonal relationships. The QRI-SS subscale measures the perceived availability of social support from a particular person (e.g., “To what extent can you count on this person to listen to you when you are very angry at someone else?” or “To what extent can you count on this person for help with a problem?”). This particular scale was chosen to fit the way in which peer ratings were collected in this study. Partici- pants were asked to rate their teammates at the end of the se- mester. If a student maintained good interpersonal relationships with teammates throughout the semester, those teammates would evaluate that student as someone on whom they could rely for social support. Participants were asked to rate each team member using a 5-point scale, from 1 (not at all) to 5 (very), on each the 7 items of the QRI-SS. The alpha coefficient of the QRI-SS test was .95 in the current study. Procedure During the first week of the semester, students were in- formed that they were expected to participate in a series of studies as part of their course credit. Students were also offered alternatives to participating in this study. During the following week, the students took the SERT, the JACFEE test, and the PONS test in small-group settings (3 people per session) at a research laboratory. Each student used an individual computer. In the third week, research teams were formed by random as- signment. Each team consisted of a minimum of 4 students because peer ratings on perceived social support from this round-robin design needed to be analyzed with the Social Rela- tionship Model (SRM; Kenny, 1994). To estimate the parame- ters of the SRM (target effect, perceiver effect, and relationship effect), it is recommended that all groups have at least 4 people (Kenny, 1994). In the 12th week, the students took the SERT again to check its test-retest reliability. At the end of the se- mester (14th week), the 7-item QRI-SS subscale was distrib- uted to the students in sealed envelopes. Each student was asked to rate all other team members individually on the en- closed questionnaires and to drop the sealed envelope to a locked drop box outside of the author’s laboratory within 1 week. Results A goal of this study was to examine how well the SERT, the JACFEE test, and the PONS test predict the maintenance of positive interpersonal relationships. To this end, the indicator of the positive interpersonal relationships was computed first. The peer-rating scores from the QRI-SS subscale were analyzed with the computer program SOREMO (Kenny, 1998) to esti- mate the target effect score of each participant. There is compelling reason for applying Social Relations Model (SRM) analysis to the peer-rating scores (Kenny, 1994): The rating scores from the round-robin design are not statistic- cally independent, since all the team members were asked to rate one another (Kenny, 1994). Thus, rating scores could have been influenced by the unique relationships between targets and raters (the “relationship effect”). The rating scores could also have been influenced by the raters’ response styles (the “per- ceiver effect”). By using SRM analysis, researchers can esti- mate the target effect while controlling for both the perceiver and the relationship effects. Thus, the target effect scores esti- mated by the SOREMO (Kenny, 1998), were used as the major indicator of peer-rated interpersonal relationships. Next, the intercorrelations among the four major variables were examined. As shown in Table 2, the SERT was positively and significantly associated with peer-rated interpersonal rela- tionships (r = .33). Like the SERT, the PONS test had a posi- tive association with the peer-rated interpersonal relationships (r = .19). Interestingly, the JACFEE test has a negative, al- though weak, association with the peer-rated interpersonal rela- tionships (r = –.09). The SERT was modestly associated with the PONS test (r = .20), but not with the JACFEE test (r = .02). The PONS test and the JACFEE test were modestly associated with each other (r = .20). Multiple regression analyses were performed in order to explore the relative contributions of the SERT, the JACFEE test, and PONS test to the outcome measure. The measure of perceived social support by peers (estimated target score) served as the outcome variable, and the SERT, the JACFEE test, and the PONS test were entered into the regression analyses as the main predict o rs. Table 2 presents the results of the regression analyses, in- cluding standardized regression coefficients of those predictors, their associated t values, squared semi partial correlations (sr2) as an indicator of the effect size for each predictor, and the squared R to evaluate the effect size for the overall regression model. The results of the regression analyses revealed that only Table 2. Regression coefficients of predictors accounting for variance in per- ceived social support by peers. Perceived Social Support by Peers (Target Effect) Predictors r t sr2 SERT .33 .31 3.11 .09 JACFEE –.09 –.13 –1.32 .02 PONS .19 .15 1.52 .02 R2 .14 3The internal consistencies of the 110-item PONS test (.68) and the 20-item JACFEE test (.57) were not high in this study, mainly because only portions of the original tests were employed due to time constraints. When the inter- nal consistencies of the full-length PONS and JACFEE tests were estimated using the Spearman Brown prophecy formula, the estimated reliabilities were .81 (PONS test) and .79 (JACFEE test), which were similar to the reported reliabilities for the 220-item PONS (about .86; Hall, 2001) and for the 56-item Japanese and Caucasian Brief Affect Recognition Test (JACBART; from .82 to .92; Matsumoto et al., 2000). Because the JACBART test is not identical to the JACFEE test, the internal consistency of the 56-item JACBART should be considered as a proxy estimate for the JACFEE test. Note: Coefficients with an absolute t-value greater than 2.0 are considered sig- nificant at the .05 level according to a two-tailed test (n = 96). Copyright © 2012 SciRes. 1186  S.-M. KANG the SERT emerged as a statistically significant predictor for peer-rated interpersonal relationships ( = .31, t = 3.11, sr2 = .09). Both the JACFEE test ( = –.13, t = –1.32, sr2 = .02) and the PONS test ( = .15, t = 1.52, sr2 = .02) were not sig- nificant predictors for the outcome variable. The total proportions of variance in perceived social support explained by the current regression model were .14. Finally, the test-retest reliability of the SERT for the 10-week period was .72 in this study. Discussion The main purpose of the current study was to introduce an ecologically valid measure of emotion recognition for norma- tive adults and to demonstrate its relative strengths for predict- ing positive interpersonal relationships. Overall, the results of the current study provide preliminary support for the construct validity of the SERT. The SERT scores correlated weakly to moderately with the JACFEE and PONS test scores and were stable over a 10-week period. The SERT also demonstrated its relative strength in predicting the peer ratings of interpersonal relationships over the JACFEE and PONS tests. One of the strengths of the current study is that peer ratings of interpersonal relationships, which served as the main out- come variable, were collected in a longitudinal study using a round-robin design. Using this variable, the current study showed that the SERT was meaningfully associated with peer- rated interpersonal relationships. Compared to the SERT, the JACFEE and PONS tests did not account for meaningful por- tions of the variance in the outcome. This finding was some- what unexpected, because the PONS test in particular has been associated with the identification of interpersonal sensitivity and positive interpersonal relationships (Bernieri, 1991; Di- Matteo, Friedman, & Taranta, 1979; Rose n t hal et al., 1979). Why Does the SERT Better Predict Peer Relationships? The relative predictive power of the SERT over the JACFEE and PONS tests can be partially accounted for by its ecological validity (Ambady, LaPlante, & Johnson, 2001). One of the main features of the SERT is that it employs spontaneous ex- pressions, whereas the JACFEE and the PONS tests (along with a majority of existing emotion recognition tests) employ posed emotions. Furthermore, the spontaneous expression clips of the SERT are presented through a full video/audio channel and average 18.79 seconds in length. These unique features of the SERT contribute considerably to its ecological validity, be- cause inferring the emotions presented in the SERT clips bears a strong resemblance to inferring others’ feelings in everyday life. Thus, it can be predicted that students with high scores on the SERT will be comparatively good at reading their team- mates’ emotions in daily life. The relative predictive power of the SERT can be further ex- plained by the close match between the skills required for the SERT and the outcome measure of this study. The outcome measure was the QRI-SS subscale, which assesses the per- ceived availability of social support from a particular person. The skills measured by the SERT (i.e., skills for reading emo- tions accurately from a stream of on-going verbal and nonver- bal behaviors) are the same skills that assisted the students in assessing the needs of their teammates. If they judged the needs of their teammates accurately, they were more likely to adjust their behaviors in a desirable way, which subsequently led their teammates to perceive them as available for social support and to rate them more highly on this measure. The relatively weak performance of the JACFEE and the PONS tests in accounting for peer-rated interpersonal relation- ships implies that the skills measured by the JACFEE test (i.e., skills for reading posed emotions accurately within 1-second exposure) and the PONS test (i.e., skills for reading social situations correctly with limited verbal/nonverbal expressions) do not correlate with the particular outcome variable used in this study (i.e., perceived availability of social support). The JACFEE and PONS tests may still emerge as primary predic- tors for other types of outcome variables that have a close match with the particular skills measured by the JACFEE and PONS tests. In sum, the enhanced ecological validity of the SERT and the close match between its required skills and the specific out- come measure may explain the greater predictive power of the SERT over the other measures of emotion recognition used in this study. Limitations Although the results of the current study highlight the im- portance of the SERT as a significant predictor of peer-rated interpersonal relationships, they should be interpreted with caution due to a number of limitations. First, the participants of the current study were predominantly women. Second, the peer ratings of interpersonal relationships were collected under the unique conditions of the current study, in which the participants formed research teams and worked together on a group project throughout an entire semester. In this setting, an individual’s performance on the group project could unduly impact peer ratings. The significance of the peer ratings obtained may there- fore be limite d to work-re lat ed se tt ings. Due t o these li mit a tions, the apparently strong contribution of the SERT to peer-rated interpersonal relationships needs to be interpreted with caution and should be replicated with a large gender-balanced sample in a non work-related setting. Closing Remarks The results from the current study show sufficient promise to warrant further development of the SERT. Even though it is brief (only 9 items), it seems to be comparable with existing measures of emotion recognition. Whether this measure can be applied to other settings and to other samples beyond college students needs to be further investigated. Acknowledgements Preparation of this article was supported by a grant from the NIMH and NIGMS (no. SC2MH087466). REFERENCES Ambady, N., LaPlante, D., & Johnson, E. (2001). Thin-slice judgments as a measure of interpersonal sensitivity. In J. A. Hall, & F. J. Berni- eri (Eds.), Interpersonal sensitivity: Theory and measurement (pp. 89-101). Mahwah , NJ: Lawrence Erlbaum Associates, Inc. Bänziger, T., Grandjean, D., & Scherer, K. R. (2009). Emotion recogni- tion from expressions in face, voice, and body: The Multimodal Copyright © 2012 SciRes. 1187  S.-M. KANG Copyright © 2012 SciRes. 1188 Emotion Recognition Test (MERT). Emotion, 9, 691-704. doi:10.1037/a0017088 Bernieri, F. J. (1991). Interpersonal sensitivity in teaching interactions. Personality and Social Psychology Bulletin, 17, 98-103. doi:10.1177/0146167291171015 Bernieri, F. J. (2001). Toward a taxonomy of interpersonal sensitivity. In J. A. Hall, & F. J. Bernieri (Eds.), Interpersonal sensitivity: The- ory and measurement (pp. 3-20). Mahwah, NJ: Lawrence Erlbaum Associates. Buck, R. (1984). The communication of emotion. New York: Guildford Press. Cohen, J., & Cohen, P. (1975). Applied multiple regression/correlation analysis for the behavioral sciences. Oxford, England: Lawrence Erlbaum. Crocker, L., & Algina, J. (1986). Introduction to classical and modern test theory. Orland, FL: Harcourt B race Jovanovich, Inc. Davis, M. H. (1983). Measuring individual differences in empathy: Evidence for a multidimensional approach. Journal of Personality and Social Psychology, 44, 113-126. doi:10.1037/0022-3514.44.1.113 DiMatteo, M. R., Friedman, H. S., & Taranta, A. (1979). Sensitivity to bodily nonverbal communication as a factor in practitioner-patient rapport. Journal of Nonverbal Behavior, 4, 18-26. doi:10.1007/BF00986909 Ekman, P., & Friesen, W. V. (1974). Detecting deception from the body or face. Journal of Personality and Social Psychology, 29, 288- 298. doi:10.1037/h0036006 Ekman, P., & Friesen, W. V. (1976) . Pictures of facial affect. Palo Alto, CA: Consulting Psych o l og i st s ’ Press. Hall, J. A. (2001). The PONS test and the psychometric approach to measuring interpersonal sensitivity. In J. A. Hall, & F. J. Bernieri (Eds.), Interpersonal sensitivity: Theory and measurement (pp. 143- 161). Mahwah, NJ: Lawrence Erlbaum Associates. Hall, J. A., Andrzejewski, S. A., Yopchick, J. E. (2009). Psychosocial correlates of interpersonal sensitivity: A meta-analysis. Journal of Nonverbal Behavior, 33, 149-180. doi:10.1007/s10919-009-0070-5 Hall, J. A., Bernieri, F. J., & Carney, D. R. (2005). Nonverbal behavior and interpersonal sensitivity. In J. A. Harrigan, R. Rosenthal, & K. R. Scherer (Eds.), The new handbook of methods in nonverbal behavior research (pp. 237-281). Oxford: Oxford University Press. Horan, W. P., Kern, R. S., Shokat-Fadai, K., Sergi, M. J., Wynn, J. K., & Green, M. F. (2009). Social cognitive skills training in schizo- phrenia: An initial efficacy study of stabilized outpatients. Schizo- phrenia Research, 107, 47-54. doi:10.1016/j.schres.2008.09.006 Hunsley, J., & Meyer, G. J. (2003). The incremental validity of psy- chological testing and assessment: Conceptual, methodological, and statistical issues. Psychological Assessment, 15, 446-455. doi:10.1037/1040-3590.15.4.446 Ickes, W. (1993) Empathic accuracy. Journal of Personality, 61, 587- 610. doi:10.1111/j.1467-6494.1993.tb00783.x Ickes, W., Bissonnette, V., Garcia, S., & Stinson, L. (1990). Imple- menting and using the dyadic interaction paradigm. In C. Hendrick, & M. Clark (Eds.), Review of personality and social psychology: Volume 11, research methods in personality and social psychology (pp. 16-44). Newbury Park, CA: Sage. Ickes, W., Buysse, A., Pham, H., Rivers, K., Erickson, J. R., Hancock, M., Kelleher, J., & Gesn, P. (2000). On the difficulty of distinguish- ing “good” and “poor” perceivers: A social relations analysis of em- pathic accuracy data. Personal Relationships, 7, 219-234. doi:10.1111/j.1475-6811.2000.tb00013.x Kenny, D. A. (1994). Interpersonal perception: A social relations analysis. New York: Guilford Press. Kenney, D. A. (1998). SOREMO version V. 2; A FORTRAN program for the analysis of round-robin data structures. Unpublished manu- script, Storrs-Mansfield, CT: University of Connecticut. Magill-Evans, J., Koning, C., Cameron-Sadava, A., & Manyk, K. (1995). The child and adolescent social perception measure. Journal of Nonverbal Behavior, 19, 151-169. doi:10.1007/BF02175502 Marangoni, C., Garcia, S., Ickes, W., & Teng, G. (1995). Empathic accuracy in a clinically relevant setting. Journal of Personality and Social Psychology, 68, 854-869. doi:10.1037/0022-3514.68.5.854 Matsumoto, D., & Ekman, P. (1988). Japanese and Caucasian Facial Expressions of Emotion (JACFEE). San Francisco, CA: Intercultural and Emotion Research Laboratory, Department of Psychology, San Francisco State University. Matsumoto, D., LeRoux, J., Wilson-Cohn, C., Raroque, J., Kooken, K., Ekman, P., Yrizarry, N., Loewinger, S., Uchida, H., Yee, A., Amo, L., & Goti, A. (2000). A new test to measure emotion recognition ability: Matsumoto and Ekman’s Japanese and Caucasian Brief Af- fect Recognition Test (JACBART). Journal of Nonverbal Behavior, 24, 179-209. doi:10.1023/A:1006668120583 Mayer, J. D., & Geher, G. (1996). Emotional intelligence and the iden- tification of emotion. Intelligence, 22, 89-113. doi:10.1016/S0160-2896(96)90011-2 Mayer, J. D., & Salovey, P. (1997). What is emotional intelligence? In P. Salovey, & D. J. Sluyter (Eds.), Emotional development and emo- tional intelligence: Educational implications (pp. 3-31). New York, NY. Basic Books. McDonald, S., Flanagan, S, Rollins, J., & Kinch, J. (2003). A new clinical tool for assessing social perception after traumatic brain injury. Journal of Head Trauma Rehabilitation, 18, 219-238. doi:10.1097/00001199-200305000-00001 Mehrabian, A., & Epstein, N. (1972). A measure of emotional empathy. Journal of Personalit y, 40, 525-543. doi:10.1111/j.1467-6494.1972.tb00078.x Nowicki, S., & Duke, M. P. (1994). Individual differences in the non- verbal communication of affect: The Diagnostic Analysis of Non- verbal Accuracy Scale. Journal of Nonverbal Behavior, 18, 9-25. doi:10.1007/BF02169077 Paulhus, D. L. (1984). Two-component models of socially desirable responding. Journal of Personality and Social Psychology, 46, 598- 609. doi:10.1037/0022-3514.46.3.598 Pickett, C. L., Gardner, W. L., & Knowles, M. (2004). Getting a cue: The need to belong and enhanced sensitivity to social cues. Person- ality and Social Psychology Bulletin, 30, 1095-1107. doi:10.1177/0146167203262085 Pierce, G. R., Sarason, I. G., & Sarason, B. R. (1991). General and relationship-based perceptions of social support: Are two constructs better than one? Journal of Personality and Social Psychology, 61, 1028-1039. doi:10.1037/0022-3514.61.6.1028 Riggio, R. E. (1986). Assessment of basic social skills. Journal of Per- sonality and Social P sychology, 51, 649-660. doi:10.1037/0022-3514.51.3.649 Rosenthal, R., Hall, J. A., Di Matteo, M. R ., Rog ers, P. L., & Arch er, D. (1979). Sensitivity to NONVERBAL COMmunication: The PONS Test. Baltimore, MD: Johns Hopkins University Press.
|