 Psychology 2012. Vol.3, No.12A, 1208-1214 Published Online December 2012 in SciRes (http://www.SciRP.org/journal/psych) http://dx.doi.org/10.4236/psych.2012.312A179 Copyright © 2012 SciRes. 1208 Effects of Feedback on Self-Efficacy Expectations Based on the Athlete’s Optimistic Profile Ricardo de la Vega1, Roberto Ruiz1, Francisco Batista2, Francisco Ortín3, Carlos Giesenow4 1Autonomus University of Madrid, Madrid, Spain 2Sport & Exercise Psychology (UAM-COE), Madrid, Spain 3University of Murcia, Murcia, Spain 4National University of Lomas de Zamora, Buenos Aires, Argentina Email: ricardo.delavega@uam.es Received September 28th, 2012; revised October 22nd, 2012; accepted November 22nd, 2012 In recent years, the study of optimism and its possible influence on athletic performance has increased considerably. The key purposes of this study can be summarized as: 1) analyze how self-efficacy expecta- tions vary depending on the level of optimism an individual has; 2) ascertain how progressively receiving negative feedback affects performance expectations; and 3) evaluate whether there are differences in per- formance depending on the presence or absence of feedback. In order to achieve this, 53 Spanish football players were assessed using the Revised Life Orientation Test and an objective test of strength using hand dynamometry. The level of feedback provided was manipulated to study its influence on perceived self- efficacy in the applied strength task. The results show no significant difference between the three levels of optimism/pessimism respecting self-efficacy. Significant differences do appear when the effects of the in- dividual feedback provided for each experimental group is analyzed. The findings are discussed and fu- ture research is proposed based on the results obtained. Keywords: Positive Psychology; Optimism; Self-Efficacy; Feedback; Sport Introduction Since Martin Seligman’s address to initiate his presidency of the American Psychological Association (Seligman, 1998), positive psychology has evolved and developed as a branch of psychology which, based on scientific research, strives to un- derstand the processes that underlie the qualities, emotions and positive attitudes of human beings as psychological processes and resources that prevent the occurrence of different forms of mental illness. Thus, in recent decades, investigation of psy- chological resources that promote health and wellness from a scientific viewpoint has experienced a significant increase (Kamen, Rodin, & Seligman, 1987; Scheier, Carver, & Bridges, 1994; Seligman & Csikszentmihalyi, 2000; Snyder & Lopez, 2002; De la Vega, Ruiz, & Rivera, 2011). The study of optimism as a psychological construct comes in response to the reformulation of the Learned Helplessness The- ory done by Abramson, Seligman and Teasdale (1978). For these authors, optimism could be understood as a positive form of explaining the ways in which people cope with negative or adverse events that occur in their lives, promoting the existence of two distinct explanatory styles, one for pessimistic people and another for optimists. This characteristic has proven to be a good predictor of health and wellness resources (Scheier & Carver, 1989, 1993; Seligman et al., 1988). Currently there are two complementary perspectives to try to analyze the influence of these processes (Regourd-Laizeau, Martin-Krumm, & Tarquinio, 2012; Remor, Amorós, & Car- robles, 2006), the pessimistic-optimistic explanatory styles of Peterson and Seligman (1984), based on the classic approaches from Weiner, Frieze, Kukla, Reed, Rest and Rosenbaum (1971), and the dispositional optimism approach proposed by Scheier and Carver (1985). In the first perspective, there are two essen- tial components in Seligman’s model, on the one hand, learned helplessness, which is “the reaction of giving up, to not assume any responsibility and to not fight, as a result of believing that anything that we can do will be irrelevant” (Seligman, 2004: p. 30) and, on the other hand, the pessimistic-optimistic explana- tory style that the subject uses to explain the causes of positive or negative events (Buchanan & Seligman, 1995), relating, directly, to theories focused on the analysis of attributional processes and their effects on athletic performance. In this sense, optimists would have an external, unstable and specific explanatory style, whereas pessimists, by contrast, would at- tribute a negative event in an internal, global and stable over time manner (Davis & Zaichkowsky, 1998). There is research to suggest that people with optimistic explanatory styles have better overall health, reduced vulnerability to physical illness (Kamen et al., 1987), better immune function (Peterson & De Avila, 1995), as well as a lower mortality rate (Peterson, Selig- man, Yurko, Martin, & Friedman, 1998), better athletic per- formance, better jobs and even children with these styles per- form better in school (Seligman, 2004) compared with those who possess pessimistic explanatory styles. Parkes and Mallet (2011) made an interesting study with a sample of seven pro- fessional rugby players that highlights how the intervention to increase the attributions typical of the optimist attributional style enabled the players to perceive how they coped better with adverse situations, and to perceive themselves as more resilient and face competitions with greater self-confidence. More em-  R. DE LA VEGA ET AL. pirical evidence is found in studies that conclude that optimistic subjects, when faced with different stressors, experience less negative mood, take on more adaptive health behaviors and have a better immune condition (Segerstrom et al., 1998). Ac- cording to these authors, increasing perceived control of illness enhances the optimistic predisposition of risk perception. Ac- cording to the study by Räikkönen et al. (1999), pessimistic and anxious adults have altered blood pressure levels and feel in worse shape than the low anxiety optimistic adults. The results of the study suggest that pessimism brings physiological and psychological consequences. Regarding the second perspective, the dispositional theory established by Scheier and Carver (Scheier & Carver, 2003) propose that, under difficulties, positive expectations increase the people’s effort to reach objectives while negative expecta- tions reduce such effort to even evade the task. In that sense, optimistic people have positive expectations and perceptions about their life whereas pessimistic people tend to represent their life in a negative mode. Moreover, such expectations are considered as stable dispositions (features) (Garcia-Naveira & Díaz, 2010). One of the benefits of this model is the opportu- nity of use a questionnaire such us the “Life Orientation Test- Revised” (LOT-R), which consist of ten items only, whose psychometric properties are suitable to establish dispositional features of the personality (Ferrando, Chico, & Tous, 2002; Herzberg, Glaesmer, & Mayer, 2006). Interestingly, Ortin, Marin y Garcés de los Fayos, (2012) made a bibliometric analy- sis of the optimisms within physical activities and sport and they highlighted the LOT-R and ASQ questionnaires as those most frequently used to evaluate the optimisms and the pessi- misms. Other studies, as that made by Van de rest, Geleijnse, Kok, Van Staveren, Dullemeijer, Olderikkert, Beekman, & de Groot, (2008), reinforce the usefulness of this tool to evaluate dis- positional optimisms. Following the dispositional perspective, Chang (1998), analyze the influence of optimism and appraisals on coping and psychological and physical adjustment in college students. These results indicate that stress-related appraisals were asso- ciated with optimism, coping, and adjustment. In other hand, Myers and Steed (1999), found an inverse correlation between the dispositional optimisms and the anxiety state, establishing that individuals with an higher optimistic profile present lower levels of anxiety. Besides that, Ramírez-Maestre, Esteve y López (2012) used a sample of 98 patients with chronic pain to analyze the relation- ship between dispositional optimisms and active strategies to face pain, finding a positive correlation between both whereas a pessimisms trend was correlated with the use of passive strate- gies to deal with pain. The relationship of optimism and pessimism with athletic and academic performance has become a line of research of increasing interest in psychology. In an initial experiment done by Seligman with 21 male and 26 female swimmers (Seligman, Noles-Hoeksema, Thornton, & Thornton, 1990), the athletes in the “high level of optimism” group were told that they had made a worse time than they really had. In spite of their disap- pointment, when asked to rest and try again, their perform- ance—that was actually very good—was even better. In turn, the athletes in the “high level of pessimism” group did worse in their second attempt after being mistakenly informed they had made a bad mark the first time. In a second study, with 33 swimmers from the first study, published in the same article (Seligman et al., 1990), the same procedure was carried out but this time the amount of pessimistic information offered was manipulated (e.g., if the subject swam 100 meters then 1.5 sec- onds was sub- tracted, if they swam 200 meters, 2 seconds), with the aim of predicting the reactions only in defeat. The results indicated that optimistic swimmers at least maintained the same time, while the pessimists performed worse on the second turn. Studies where optimisms had been evaluated either from the dispositional perspective as from the explicative styles got similar results. Gordon (2008), in a study with football (soccer) players along eight games quantified. After reviewing 8 games and tallying certain variables such as goals, fouls, passes com- pleted and attempted passes, optimistic players showed better performance during a defeat than pessimists, while no signifi- cant differences in performance where found between the two groups after a victory. From this perspective, the papers that study psychological characteristics of high-level athletes (Api- tzsch, 1994; García & Díaz Morales, 2010; Gould, Dieffenbach, & Moffatt, 2002), as well as those that relate personality factors with performance measures (Gordon, 2008; Norlander, Bood, & Archer, 2002; Wilson, Raglin, & Pritchard, 2002) indicate that optimism and positive thinking may be beneficial for in- creasing athletic performance (Garcia et al., 2010). These au- thors advocate that, in the face of difficulties, positive beliefs and expectations for the future facilitate self-regulation of indi- vidual behavior, increasing efforts to achieve goals. In another study by Seligman (2004), after analyzing the statements in the press of players and coaches of all the base- ball teams of the American national league and of two NBA teams after every game they won and lost, a positive or nega- tive explanatory pattern was set for each team, establishing a predictive judgment about the teams that would perform better in the next season. The results showed that optimists did better in the following season while pessimists’ performance deterio- rated and that teams with optimistic explanatory styles per- formed significantly better under pressure than pessimists. In another study by Hale (1993) to confirm the effect of optimistic and pessimistic explanatory styles on performance, based on Seligman’s studies, no statistically significant relationship was found; this highlights the existing scientific controversy. Explanatory style has been studied in relation to different psychological variables. So, Vera-Villarroel and Buela-Casal (2000), related the explanatory styles with anxiety. San Juan and Magallares (2007) established a relationship between an optimistic or pessimistic profile and coping styles. In a study by Martin-Krumm, Sarrazin, Peterson, and Famose (2003), a sam- ple of 62 basketball players (mean age 14 years) performed a basketball dribbling trial and were given false feedback indi- cating that they had failed. Consistent with prediction, in the second trial similar to the first, the optimistic participants were less anxious, exhibited more confidence and performed better than pessimistic participants. The relationship between optimism and pessimism, mental toughness and coping style, has also been studied, finding, in a sample of 677 athletes, that mental toughness correlated sig- nificantly with 8 of the 10 subscales of coping and with opti- mism (Nicholls, Polman, Levy, & Backhouse, 2008). Another line of research associated to sport and optimism is the possible relation with resilience and burnout. In a study by Chen, Kee and Tsai (2008), with 139 volleyball players, the Copyright © 2012 SciRes. 1209  R. DE LA VEGA ET AL. relationship between optimism and burnout was evaluated, finding that optimism scores of athletes were negatively related with burnout scores. Subsequently, Gustafsson and Skoog (2012) corroborated these findings in a sample of 217 athletes, finding an inverse relationship between perceived stress, burn- out and optimism. Finally, the work of Fernandez and Ber- mudez (2001), aimed at helping to understand the cognitive strategies (expectations) of pessimists and optimists, should be noted. The results showed that the control of the situation is an important factor in the differential activation of strategies and that different types of expectations have different functions inside and outside of a same group. Concerning the central theme of the present research, which revolves around the relationship between optimistic and pessi- mistic profiles of athletes, and the influence this can have on their performance upon receiving certain types of information about how they are doing (outcome feedback), three works should be mentioned as the most relevant, the first two from the explicative styles theory, and the third from the dispositional theory. The first is the classic study by Seligman at the Univer- sity of Berkeley in 1990 with swimmers, in which a controlled negative feedback was provided based on the results obtained in a trial that was freely chosen by the research participants. Martin-Krumm, Sarrazin, Peterson and Famose (2003) con- ducted a similar study in basketball, measuring perceived per- formance in dribbling and the level of anxiety experienced by a sample of 42 players. After providing negative feedback and giving them the possibility of a second attempt, on second chance the more optimistic participants were less anxious and performed better. Ortin, Garcés of Fayos, Gosalves, Ortega and Olmedilla (2011), in turn, replicated Seligman’s study in an investigation with 66 youth swimmers, where information about their mark was manipulated in a trial they were later to repeat, giving them negative feedback (longer times than the one actually obtained). The results revealed that swimmers with a pessimistic profile, evaluated through the LOT-R question- naire, significantly changed in a negative sense their times be- tween the first and second attempts. From here, interesting research perspectives emerge, like the need to broaden the age range of the participants to study the effects on adults, as well as the importance of knowing the possible mediating effect of feedback when, as it occurs in many sports, it is obtained in succession but at various times, and how it can differentially influence athletes of both profiles. Having presented the main conceptual issues that support the relevance of the study of optimism in the sport context, this paper attempts to analyze a specific aspect that has not been sufficiently addressed in the context of basic and applied re- search, which is how progressively receiving controlled nega- tive feedback can affect, depending on the athlete’s pessimistic or optimistic profile, a task that allows objective and accurate quantification of performance, as is strength assessed with ma- nual dynamometry, under the assumption that athletes with a more optimistic profile will be less affected by the negative progressive feedback provided than the other groups. This will allow us to know, precisely, how each group evolves along this process, as well as to analyze the important implications these results can have on sports training and coach-athlete communi- cation. Specifically, the key purposes of this study can be summarized as: 1) analyze how self-efficacy expectations vary depending on the level of tendency toward optimism an indi- vidual has; 2) ascertain how receiving negative progressive feedback affects performance expectations; 3) evaluate whether there are differences in performance depending on the presence or absence of feedback. Method Participants The research sample consisted of 53 male soccer players, in- tegrated into three youth category competition teams belonging to the same club in the Community of Madrid (Spain). The sample selection was performed by incidental sampling and voluntary participation, after authorization to participate in the study was obtained from each participant’s tutors throughout a signed informed consent form. Participants compete in succes- sive categories: youth “A” competes in Honor Division (n = 14, M = 18.14 years, S.D. = 0.66 years), youth “B” in the National League (n = 20, M = 17.45 years, S.D. = 0.75 years), and youth “C” in the Autonomic League (n = 19, M = 16.36 years, S.D. = 0.59 years). The three teams train four days a week plus one day of competition, totaling 12 hours a week of athletic in- volvement. Total descriptive values are: n = 53, M = 17.24 and S.D. = 0.97. Instruments Assessment of tendency toward optimism. Tendency toward optimism is a continuous variable categorized into three levels. To measure tendency toward optimism the Revised Life Orien- tation Test was employed (LOT-R, Scheier, Carver, & Bridges, 1994) in the Spanish version developed by Otero-Lopez, Lu- engo, Romero, Triñanes, Gomez and Castro (1998). The LOT-R is a reduced version of the original Life Orientation Test (LOT, Scheier & Carver, 1985), with a correlation of 0.95 among both versions (Scheier, Carver, & Bridges, 1994). This test consists of 10 items, four of which are filling, not for scor- ing, in which subjects are asked to indicate their level of agree- ment or disagreement with various statements presented on a 5-point Likert scale (0-4), where 0 is “strongly disagree” and 4 “strongly agree”. Of the six items, three are worded in a posi- tive direction (tendency toward optimism) and 3 in negative (tendency toward pessimism). As to the interpretation of the results, it is possible to keep each disposition separate (trait optimism vs trait pessimism) summing the items in each sub- scale within a range from +12 to −12, although it is also possi- ble to obtain a total score. The first criterion has been selected by the research team to place participants in the different ex- perimental groups according to the levels obtained on tendency toward optimism (low, medium and high). Regarding the psy- chometric properties of the test, confirmatory factor analysis has shown a better fit of the two-factor model against a one- factor model for both the LOT and the LOT-R (Chico & Fer- rando, 2008; Ferrando, Chico, & Tous, 2002). The scale has a range from −12 as minimum score to +12 as maximum score. Finding the percentiles of the study sample, subjects who scored between −12 and 2 were classified within the group of “low level of optimism” (LLO) (N = 13), those who scored 3, 4 or 5, in the group of “medium level of optimism” (MLO) (N = 23), and those who had a score of 6 or higher in the group of “high level of optimism” (HLO) (N = 17). Measurement of manual strength. To provide feedback in accordance to the manual force applied, a TKK-5401 digital hand dynamometer was used, allowing the analysis of the Copyright © 2012 SciRes. 1210  R. DE LA VEGA ET AL. maximum static bending strength in both arms, simplifying significantly the accurate measurement of these indices. The measurement arch of the dynamometer goes from 0.5 to 100 kgf; the minimum unit of measure is 0.1 kgf, and the level of accuracy shown is ±2.0 kgf. An ad hoc spreadsheet in the pro- gram Excel was designed to record the force exerted by each athlete and to calculate the percentage of feedback that was offered, according to the group in which each participant be- longed. This test was chosen following the criteria established by Ribes (2007), so that it was not influenced by the subject’s skill level in performing the task, and by De la Vega, Ruiz, Rivera and Ortín (in press), who used it as an objective behav- ioral assessment to evaluate the influence of others in young soccer players. Procedure A two-phase protocol was established to ensure that the ap- plication conditions were identical for all participants, whilst respecting the ethical standards established in research with minors. As noted above, the participants and their tutors were informed that their participation was voluntary and that the results would be confidential and for scientific purposes only. The first phase involved the assignment of participants to one of two experimental groups or to the control group, while the second phase was the actual experimental phase. The use of two experimental groups is justified by the need of know if the order in which the feedback with the modified results are provided (10% 20% vs 20% 10%) influence in the expectations of individuals. In the first phase, to complete the LOT-R and enable the dis- tribution of the two experimental groups and the control group, all participants were summoned to arrive one hour before the start of training in one of the rooms of the club. From the re- sults, the following values of level of optimism were obtained: 13 LLO, 23 MLO and 17 HLO (see Table 1). The athletes were then randomly assigned to the two experimental groups (EG1 = 18; EG2 = 18) and the control group (CG = 17). For the second phase of the investigation, each athlete was instructed in the way they should perform the test to obtain maximum strength in their two attempts, after each of which a type of feedback would be offered in terms of the assigned experimental condition. Then came the actual experimental phase where the value of the force that was obtained with the dynamometer was manipulated at 10% or 20% less than the actual value. In the experimental groups, participants made two attempts, with one-minute intervals to prevent the effect of fatigue on the test, as a baseline measure (experimental phase 1 -EP1-). After completion, the average value obtained was noted and the participant was informed the true mean achieved. The participants were asked to perform the test again and to now determine a value judgment about their future expectation of Table 1. Distribution of participants to groups by levels. Group/Level LLO MLO HLO n EG1 4 8 6 18 EG2 4 8 6 18 CG 5 7 5 17 Total 13 23 17 Total efficacy (Expectation 1 -E1-), so as to establish how efficacious they perceived themselves without manipulation of the feed- back given. Two minutes later, two more attempts were made (experimental phase 2 -EP2-), with a one minute rest between the two, and the true mean was calculated. In this case, the feedback provided to the athlete was 10% less than the actual average value for the EG1, and 20% below the actual value for EG2. The participants had two more minutes of resting time, and once more they were told that they had two new opportuni- ties, again the expectation of efficacy of each athlete was regis- tered (Expectation 2 -E2-). Subsequently, two other attempts were performed (experimental phase 3 -EP3-) with a one min- ute interval between them, the true mean was registered, and inverse feedback to the previous phase was provided, i.e., sub- jects in EG1 were informed of a 20% decrease of the true value, while the EG2, had a 10% decrease in value. During the two minute rest, it was informed that the participant had to make a last attempt (experimental phase 4 -EP4-) and self-efficacy expectation was measured again (Expectation 3 -E3-), although in this case no information on the result obtained in the test was offered. For the control group, the process was similar but without offering any kind of feedback at the different stages. For data analysis, from the descriptive statistics, an analysis of fit to the normal distribution curve using Kolmogorov- Smirnov nonparametric test for a single sample was performed on all the variables involved in the study, including expecta- tions of self-efficacy. A nonparametric test for k independent samples (Kruskal-Wallis test) was conducted to compare whether significant differences existed within each experimen- tal group at the three levels between baseline and the remaining expectations separately. To verify whether significant differ- ences existed within the experimental groups between baseline and expectations, analysis was performed using the nonpara- metric Friedman’s test with the value of W for the Wilcoxon test on pair comparison in the case of significant differences. To compare whether there were differences between the three levels (LLO, MLO and HLO) in the control group in all four phases, Kruskal-Wallis was used; while the nonparametric Mann-Whitney U test was employed to compare two inde- pendent samples (both experimental groups) and to analyze whether there were differences among both groups between the means obtained at baseline and the self-efficacy expectations held. Finally, to test whether there were significant differences among the three groups (two experimental and control) in the mean score of the four attempts, the nonparametric Kruskal- Wallis test was used. The statistical program SPSS 19.0 was used to perform all data analysis. Results The normality analysis of the variables, using the Kolmo- gorov-Smirnov test for a single sample, was performed for all scores and subscales of the test, and for the average of the base- line and the three self-efficacy expectations. In the LOT-R, for level of optimism (p = 0.103) was obtained; (p = 0.440) for level of pessimism, and (p = 0.611) for the total score, so all follow normal distribution. Also, the mean of the baseline and the three efficacy expectations follow a normal distribution: Mean Baseline (p = .654), E1 (p = 0.432), E2 (p = 0.429) and E3 (p = 0.430). Despite the values obtained, it was decided to perform nonparametric analyzes due to the sample size in the different experimental groups and, therefore, at the different Copyright © 2012 SciRes. 1211 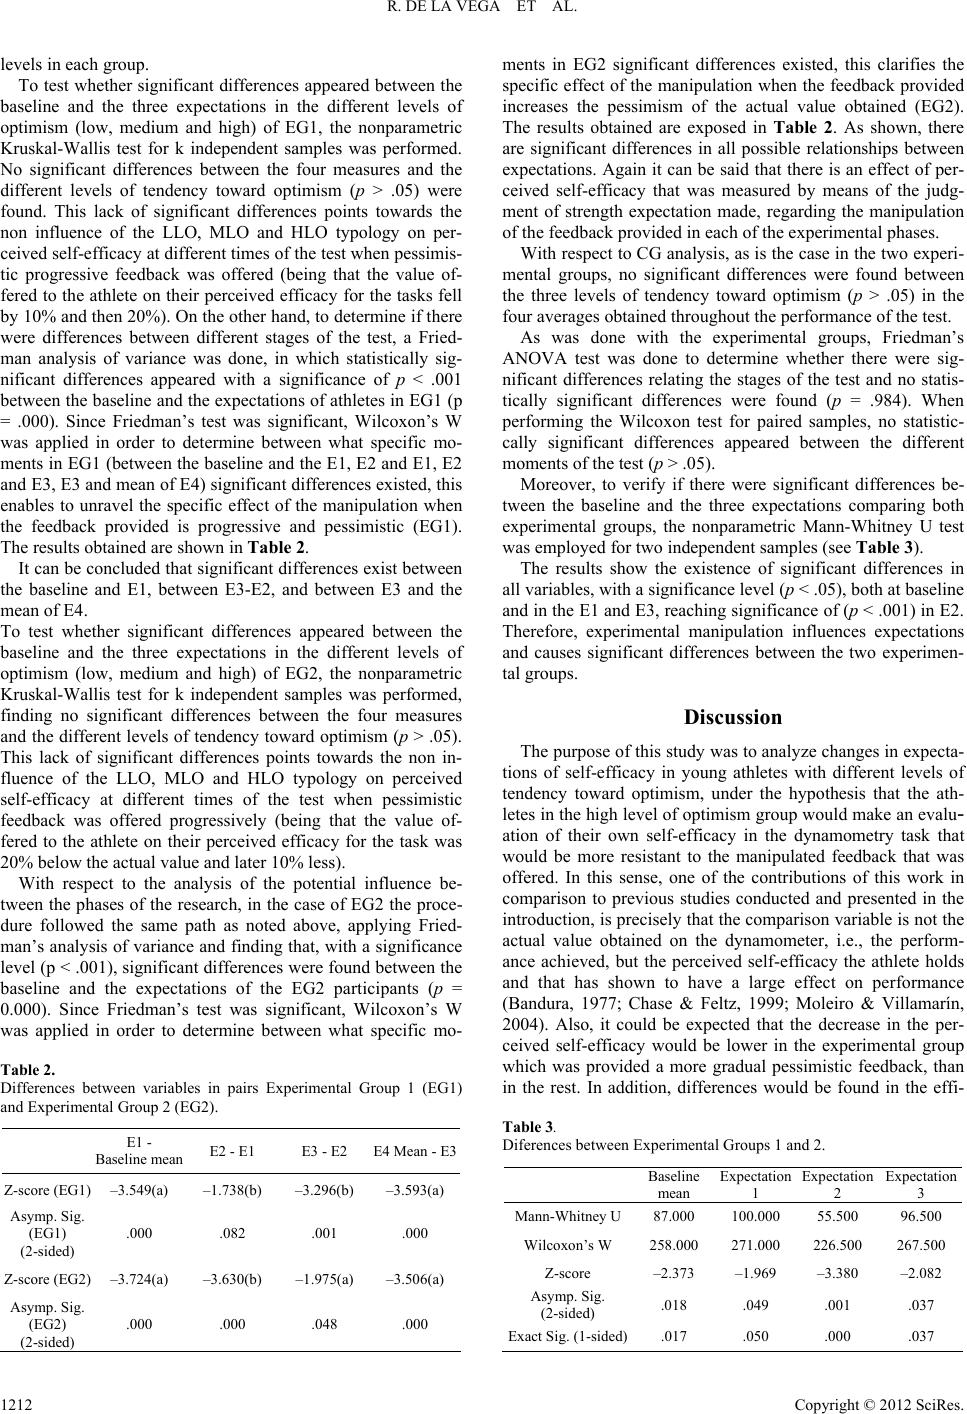 R. DE LA VEGA ET AL. levels in each group. To test whether significant differences appeared between the baseline and the three expectations in the different levels of optimism (low, medium and high) of EG1, the nonparametric Kruskal-Wallis test for k independent samples was performed. No significant differences between the four measures and the different levels of tendency toward optimism (p > .05) were found. This lack of significant differences points towards the non influence of the LLO, MLO and HLO typology on per- ceived self-efficacy at different times of the test when pessimis- tic progressive feedback was offered (being that the value of- fered to the athlete on their perceived efficacy for the tasks fell by 10% and then 20%). On the other hand, to determine if there were differences between different stages of the test, a Fried- man analysis of variance was done, in which statistically sig- nificant differences appeared with a significance of p < .001 between the baseline and the expectations of athletes in EG1 (p = .000). Since Friedman’s test was significant, Wilcoxon’s W was applied in order to determine between what specific mo- ments in EG1 (between the baseline and the E1, E2 and E1, E2 and E3, E3 and mean of E4) significant differences existed, this enables to unravel the specific effect of the manipulation when the feedback provided is progressive and pessimistic (EG1). The results obtained are shown in Table 2. It can be concluded that significant differences exist between the baseline and E1, between E3-E2, and between E3 and the mean of E4. To test whether significant differences appeared between the baseline and the three expectations in the different levels of optimism (low, medium and high) of EG2, the nonparametric Kruskal-Wallis test for k independent samples was performed, finding no significant differences between the four measures and the different levels of tendency toward optimism (p > .05). This lack of significant differences points towards the non in- fluence of the LLO, MLO and HLO typology on perceived self-efficacy at different times of the test when pessimistic feedback was offered progressively (being that the value of- fered to the athlete on their perceived efficacy for the task was 20% below the actual value and later 10% less). With respect to the analysis of the potential influence be- tween the phases of the research, in the case of EG2 the proce- dure followed the same path as noted above, applying Fried- man’s analysis of variance and finding that, with a significance level (p < .001), significant differences were found between the baseline and the expectations of the EG2 participants (p = 0.000). Since Friedman’s test was significant, Wilcoxon’s W was applied in order to determine between what specific mo- Table 2. Differences between variables in pairs Experimental Group 1 (EG1) and Experimental Group 2 (EG2). E1 - Baseline mean E2 - E1 E3 - E2 E4 Mean - E3 Z-score (EG1) –3.549(a) –1.738(b) –3.296(b) –3.593(a) Asymp. Sig. (EG1) (2-sided) .000 .082 .001 .000 Z-score (EG2) –3.724(a) –3.630(b) –1.975(a) –3.506(a) Asymp. Sig. (EG2) (2-sided) .000 .000 .048 .000 ments in EG2 significant differences existed, this clarifies the specific effect of the manipulation when the feedback provided increases the pessimism of the actual value obtained (EG2). The results obtained are exposed in Table 2. As shown, there are significant differences in all possible relationships between expectations. Again it can be said that there is an effect of per- ceived self-efficacy that was measured by means of the judg- ment of strength expectation made, regarding the manipulation of the feedback provided in each of the experimental phases. With respect to CG analysis, as is the case in the two experi- mental groups, no significant differences were found between the three levels of tendency toward optimism (p > .05) in the four averages obtained throughout the performance of the test. As was done with the experimental groups, Friedman’s ANOVA test was done to determine whether there were sig- nificant differences relating the stages of the test and no statis- tically significant differences were found (p = .984). When performing the Wilcoxon test for paired samples, no statistic- cally significant differences appeared between the different moments of the test (p > .05). Moreover, to verify if there were significant differences be- tween the baseline and the three expectations comparing both experimental groups, the nonparametric Mann-Whitney U test was employed for two independent samples (see Table 3). The results show the existence of significant differences in all variables, with a significance level (p < .05), both at baseline and in the E1 and E3, reaching significance of (p < .001) in E2. Therefore, experimental manipulation influences expectations and causes significant differences between the two experimen- tal groups. Discussion The purpose of this study was to analyze changes in expecta- tions of self-efficacy in young athletes with different levels of tendency toward optimism, under the hypothesis that the ath- letes in the high level of optimism group would make an evalu- ation of their own self-efficacy in the dynamometry task that would be more resistant to the manipulated feedback that was offered. In this sense, one of the contributions of this work in comparison to previous studies conducted and presented in the introduction, is precisely that the comparison variable is not the actual value obtained on the dynamometer, i.e., the perform- ance achieved, but the perceived self-efficacy the athlete holds and that has shown to have a large effect on performance (Bandura, 1977; Chase & Feltz, 1999; Moleiro & Villamarín, 2004). Also, it could be expected that the decrease in the per- ceived self-efficacy would be lower in the experimental group which was provided a more gradual pessimistic feedback, than in the rest. In addition, differences would be found in the effi- Table 3. Diferences between Experimental Groups 1 and 2. Baseline mean Expectation 1 Expectati on 2 Expectation 3 Mann-Whitney U87.000 100.000 55.500 96.500 Wilcoxon’s W 258.000 271.000 226.500 267.500 Z-score –2.373 –1.969 –3.380 –2.082 Asymp. Sig. (2-sided) .018 .049 .001 .037 Exact Sig. (1-sided).017 .050 .000 .037 Copyright © 2012 SciRes. 1212 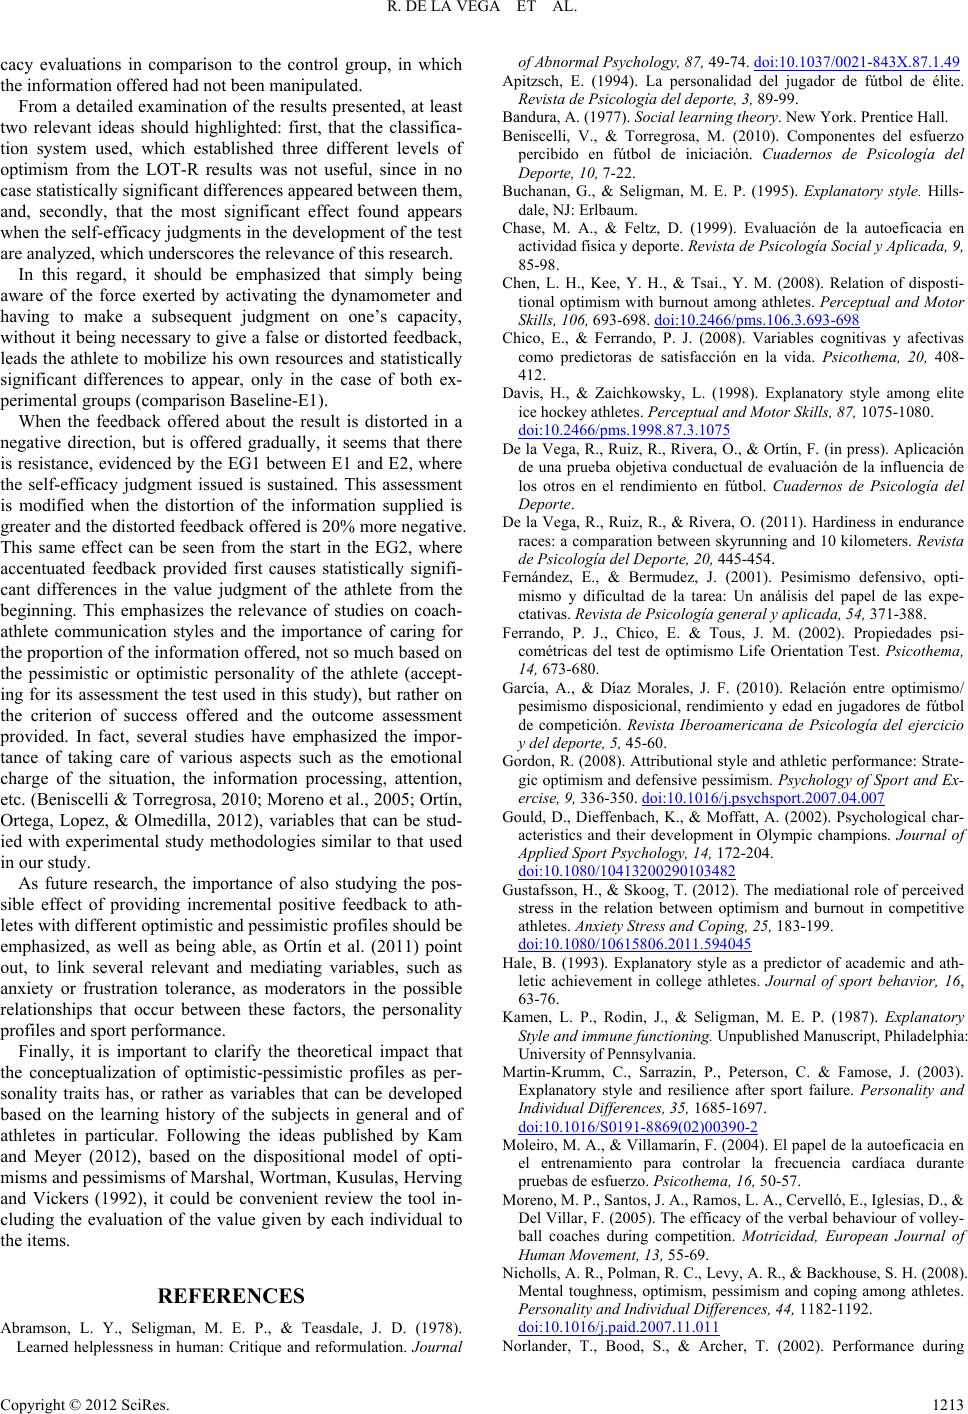 R. DE LA VEGA ET AL. cacy evaluations in comparison to the control group, in which the information offered had not been manipulated. From a detailed examination of the results presented, at least two relevant ideas should highlighted: first, that the classifica- tion system used, which established three different levels of optimism from the LOT-R results was not useful, since in no case statistically significant differences appeared between them, and, secondly, that the most significant effect found appears when the self-efficacy judgments in the development of the test are analyzed, which underscores the relevance of this research. In this regard, it should be emphasized that simply being aware of the force exerted by activating the dynamometer and having to make a subsequent judgment on one’s capacity, without it being necessary to give a false or distorted feedback, leads the athlete to mobilize his own resources and statistically significant differences to appear, only in the case of both ex- perimental groups (comparison Baseline-E1). When the feedback offered about the result is distorted in a negative direction, but is offered gradually, it seems that there is resistance, evidenced by the EG1 between E1 and E2, where the self-efficacy judgment issued is sustained. This assessment is modified when the distortion of the information supplied is greater and the distorted feedback offered is 20% more negative. This same effect can be seen from the start in the EG2, where accentuated feedback provided first causes statistically signifi- cant differences in the value judgment of the athlete from the beginning. This emphasizes the relevance of studies on coach- athlete communication styles and the importance of caring for the proportion of the information offered, not so much based on the pessimistic or optimistic personality of the athlete (accept- ing for its assessment the test used in this study), but rather on the criterion of success offered and the outcome assessment provided. In fact, several studies have emphasized the impor- tance of taking care of various aspects such as the emotional charge of the situation, the information processing, attention, etc. (Beniscelli & Torregrosa, 2010; Moreno et al., 2005; Ortín, Ortega, Lopez, & Olmedilla, 2012), variables that can be stud- ied with experimental study methodologies similar to that used in our study. As future research, the importance of also studying the pos- sible effect of providing incremental positive feedback to ath- letes with different optimistic and pessimistic profiles should be emphasized, as well as being able, as Ortín et al. (2011) point out, to link several relevant and mediating variables, such as anxiety or frustration tolerance, as moderators in the possible relationships that occur between these factors, the personality profiles and sport performance. Finally, it is important to clarify the theoretical impact that the conceptualization of optimistic-pessimistic profiles as per- sonality traits has, or rather as variables that can be developed based on the learning history of the subjects in general and of athletes in particular. Following the ideas published by Kam and Meyer (2012), based on the dispositional model of opti- misms and pessimisms of Marshal, Wortman, Kusulas, Herving and Vickers (1992), it could be convenient review the tool in- cluding the evaluation of the value given by each individual to the items. REFERENCES Abramson, L. Y., Seligman, M. E. P., & Teasdale, J. D. (1978). Learned helplessness in human: Critique and reformulation. Journal of Abnormal Psychology, 87, 49-74. doi:10.1037/0021-843X.87.1.49 Apitzsch, E. (1994). La personalidad del jugador de fútbol de élite. Revista de Psicología del deporte, 3 , 89-99. Bandura, A. (1977). S oci al l ea rn in g t he or y. New York. Prentice Hall. Beniscelli, V., & Torregrosa, M. (2010). Componentes del esfuerzo percibido en fútbol de iniciación. Cuadernos de Psicología del Deporte, 10, 7-22. Buchanan, G., & Seligman, M. E. P. (1995). Explanatory style. Hills- dale, NJ: Erlbaum. Chase, M. A., & Feltz, D. (1999). Evaluación de la autoeficacia en actividad física y deporte. Revista de Psicología Social y Aplicada, 9, 85-98. Chen, L. H., Kee, Y. H., & Tsai., Y. M. (2008). Relation of disposti- tional optimism with burnout among athletes. Perceptual and Motor Skills, 106, 693-698. doi:10.2466/pms.106.3.693-698 Chico, E., & Ferrando, P. J. (2008). Variables cognitivas y afectivas como predictoras de satisfacción en la vida. Psicothema, 20, 408- 412. Davis, H., & Zaichkowsky, L. (1998). Explanatory style among elite ice hockey athletes. Perceptual and Motor Skills , 8 7 , 1075-1080. doi:10.2466/pms.1998.87.3.1075 De la Vega, R., Ruiz, R., Rivera, O., & Ortín, F. (in press). Aplicación de una prueba objetiva conductual de evaluación de la influencia de los otros en el rendimiento en fútbol. Cuadernos de Psicología del Deporte. De la Vega, R., Ruiz, R., & Rivera, O. (2011). Hardiness in endurance races: a comparation between skyrunning and 10 kilometers. Revista de Psicología del Deporte, 20, 445-454. Fernández, E., & Bermudez, J. (2001). Pesimismo defensivo, opti- mismo y dificultad de la tarea: Un análisis del papel de las expe- ctativas. Revista de Psicología general y aplicada, 54, 371-388. Ferrando, P. J., Chico, E. & Tous, J. M. (2002). Propiedades psi- cométricas del test de optimismo Life Orientation Test. Psicothema, 14, 673-680. García, A., & Díaz Morales, J. F. (2010). Relación entre optimismo/ pesimismo disposicional, rendimiento y edad en jugadores de fútbol de competición. Revista Iberoamericana de Psicología del ejercicio y del deporte, 5, 45-60. Gordon, R. (2008). Attributional style and athletic performance: Strate- gic optimism and defensive pessimism. Psychology of Sport and Ex- ercise, 9, 336-350. doi:10.1016/j.psychsport.2007.04.007 Gould, D., Dieffenbach, K., & Moffatt, A. (2002). Psychological char- acteristics and their development in Olympic champions. Journal of Applied Sport Psychology, 14, 172-204. doi:10.1080/10413200290103482 Gustafsson, H., & Skoog, T. (2012). The mediational role of perceived stress in the relation between optimism and burnout in competitive athletes. Anxie ty St ress a nd Co ping, 25, 183-199. doi:10.1080/10615806.2011.594045 Hale, B. (1993). Explanatory style as a predictor of academic and ath- letic achievement in college athletes. Journal of sport behavior, 16, 63-76. Kamen, L. P., Rodin, J., & Seligman, M. E. P. (1987). Explanatory Style and immune functioning. Unpublished Manuscript, Philadelphia: University of Pennsylvania. Martin-Krumm, C., Sarrazin, P., Peterson, C. & Famose, J. (2003). Explanatory style and resilience after sport failure. Personality and Individual Differences, 35, 1685-1697. doi:10.1016/S0191-8869(02)00390-2 Moleiro, M. A., & Villamarín, F. (2004). El papel de la autoeficacia en el entrenamiento para controlar la frecuencia cardíaca durante pruebas de esfuerzo. P si co th em a, 16, 50-57. Moreno, M. P., Santos, J. A., Ramos, L. A., Cervelló, E., Iglesias, D., & Del Villar, F. (2005). The efficacy of the verbal behaviour of volley- ball coaches during competition. Motricidad, European Journal of Human Movement, 13, 55-69. Nicholls, A. R., Polman, R. C., Levy, A. R., & Backhouse, S. H. (2008). Mental toughness, optimism, pessimism and coping among athletes. Personality and Individual Differences, 44, 1182-1192. doi:10.1016/j.paid.2007.11.011 Norlander, T., Bood, S., & Archer, T. (2002). Performance during Copyright © 2012 SciRes. 1213  R. DE LA VEGA ET AL. Copyright © 2012 SciRes. 1214 stress: affective personality, age, an regularity of physical exercise. Social Behavior and Personality: An international Journal, 30, 495- 508. doi:10.2224/sbp.2002.30.5.495 Ortín, F., Garcés de los Fayos, E., Gosalves, J., Ortega, E., & Olmedilla, A. (2011). Optimism and sport performance in adverse conditions. Replicating Seligman 1990. Revista de Psicología del Deporte, 20, 491-501. Ortín, F. J., Ortega, E., López, E., & Olmedilla, A. (2012). Estilos explicativos de los entrenadores de fútbol profesional en el análisis de la competición deportiva. Anales de Psicología, 28, 233-239. Otero, J. M., Luengo, A., Romero, E., Gómez, J. A., & Castro, C. (1998). Psicología de personalidad. Manual de prácticas. Barcelona: Ariel Practicum. Parkes, J., & Mallet, C. (2011). Developing mental toughness: Attribu- tional style retraining in rugby. The Sport Psychologist, 2 5, 269-287. Peterson, C., & Seligman, M. E. P. (1984). Causal explanations as a risk factor for depresion: Theory and evidence. Psychological Review , 91, 347-374. doi:10.1037/0033-295X.91.3.347 Peterson, C., & De Avila, M. E. (1995). Optimistic explanatory style and the perception of health problems. Journal of clinical Psychol- ogy, 51, 128-132. doi:10.1002/1097-4679(199501)51:1<128::AID-JCLP2270510120> 3.0.CO;2-1 Peterson, C., Seligman, M. E. P., Yurko, K. H., Martin, L. R., & Fried- man, H. S. (1998). Catasthophizing and untimely death. Psychologi- cal Science, 9, 49-52. Räikkönen, K. M. (1999). Effects of optimism, pessimism, and trait anxiety on ambulatory blood pressure and mood during everyday life. Journal of Personality a nd Social Psychology, 76, 104-113. doi:10.1037/0022-3514.76.1.104 Regourd-Laizeau, M., Martin-Krumm, C., & Tarquinio, C. (2012). Interventions in the field of sport: Protocol of optimism. Pratiques Psychologiques, 18, 189-204. doi:10.1016/j.prps.2012.02.001 Remor, E., Amorós, M., & Carrobles, J. A. (2006). El optimismo y la experiencia de ira en relación con el malestar físico. Anales de Psicología, 22, 37-44. Ribes-Iniesta, E., & Contreras, S. (2007). Individual consistencies in behavior: Achievement persistence interactions as personality styles. Psychological Reports, 101, 365-377. San Juan, P., & Magallanes, A. (2007). Estilos explicativos y estra- tegias de afrontamiento. Cl ínic a y sal ud, 18, 83-98. Scheier, M. F., & Carver, C. S. (1985). Optimism, coping and health: Assessment and implications of generalized outcome expectancies. Health psychology, 4, 219-247. doi:10.1037/0278-6133.4.3.219 Scheier, M. F., & Carver, C. S. (1989). Dispositional optimism and recovery from coronary artery bypass surgery. The beneficial effects on physical and psychological well-being. Journal of personality an social psychology, 57, 1024-1040. doi:10.1037/0022-3514.57.6.1024 Scheier, M. F., & Carver, C. S. (1993). On the power of positive think- ing. The benefits of being optimistic. Current Directions in psycho- logical Science, 2, 26-30. doi:10.1111/1467-8721.ep10770572 Scheier, M., Carver, C. S., & Bridges, M. W. (1994). Distinguishing optimism from neuroticism (and trait anxiety, self-mastery, and self-esteem): A revaluation of the Life Orientation Test. Journal of personality and social psychology, 6, 1063-1078. doi:10.1037/0022-3514.67.6.1063 Segerstrom, S. T. (1998). Optimism is associated with mood, coping and immune change in response to stress. Journal of Personality and Social Psychology, 74, 1646-1655. doi:10.1037/0022-3514.74.6.1646 Seligman, M. E. P., Noles-Hoeksema, S., Thorton, N., & Thorton, K. (1990). Explanatory style as a mechanism of disappointing athletic performance. Psych o l og i c al Sc i e nc e , 1, 143-146. doi:10.1111/j.1467-9280.1990.tb00084.x Seligman, M. E. P. (1998). The President’s address. APA. American Psychologist, 54, 559-562. Seligman, M., Castellón, C., Cacciola, J., Shulman, P., Luborsky, L., & Downing, R. (1988). Explanatory Style change during cognitive therapy for unipolar depresion. Journal of abnormal psychology, 97, 13-18. doi:10.1037/0021-843X.97.1.13 Seligman, M. E. P., & Csikszentmihalyi, M. (2000). Positive psychol- ogy: An introduction. American Psychologist, 55, 5-14. doi:10.1037/0003-066X.55.1.5 Seligman, M. (2004). Aprenda Optimismo: Haga de la vida una experiencia gratificante. Debolsillo. Snyder, C. R., & López, C. J. (2002). Handbook of positive psychology. Oxford: Oxford University Press. Vera-Villarroel, P. E., & Buela-Casal, G. (2000). Relaciones entre ansiedad y estilo atributivo. Revista Mexicana de Psicología, 17, 137-142. Weiner, B., Frieze, I. H., Kukla, A., Reed, L., Rest, S. & Rosenbaum, R. M. (1971). Perceiving the causes of success and failure. Morristown, NJ: General Learning Press. Wilson, G. S., Raglin, J. S., & Pritchard, M. E. (2002). Optimism, pessimism, and precompetition anxiety in collegiate athletes. Per- sonality and Individual Differences, 32, 893-903. doi:10.1016/S0191-8869(01)00094-0
|