Theoretical Economics Letters
Vol.08 No.03(2018), Article ID:82543,18 pages
10.4236/tel.2018.83039
Income Inequality Measures
Johan Fellman
Hanken School of Economics, Helsinki, Finland

Copyright © 2018 by author and Scientific Research Publishing Inc.
This work is licensed under the Creative Commons Attribution International License (CC BY 4.0).
http://creativecommons.org/licenses/by/4.0/


Received: January 19, 2018; Accepted: February 11, 2018; Published: February 14, 2018
ABSTRACT
Income distributions are commonly unimodal and skew with a heavy right tail. Different skew models, such as the lognormal and the Pareto, have been proposed as suitable descriptions of income distribution and applied in specific empirical situations. More wide-ranging tools have been introduced as measures for general comparisons. In this study, we review the income analysis methods and apply them to specific Lorenz models.
Keywords:
Lorenz Curve, Gini Index, Pietra Index, Pareto Distribution, Simplified Rao-Tam Distribution, Chotikapanich Distribution

1. Introduction
Income distributions are commonly unimodal and skew with a heavy right tail. Therefore, different skew models, such as the lognormal and the Pareto, have been proposed as suitable descriptions of income distribution, but they are usually applied in specific empirical situations [1] . For general studies, more wide-ranging tools have been considered. The target for them is to introduce measures that are useable for comparisons of different distributions. Primary income data yield the most exact estimates of income inequality coefficients such as Gini and Pietra. Earlier studies have shown that no method is always optimal. Therefore, different attempts are still worth studies. In this study, we review income analysis methods based on Lorenz curves. The theory is applied to specific models.
Fellman [2] analyzed different methods for numerical estimation of Gini coefficients. As an application of these methods, he considered Pareto distributions. Using Lorenz curves, various numerical integration attempts were made to obtain accurate estimates. Mettle et al. [3] considered Lorenz curves and estimated the Gini coefficient of income by Newton-Cotes methods, and compared the accuracy of these estimates for some (Ghanaian) data.
2. Methods
The Lorenz curve. The most commonly used theory is based on the Lorenz curve. Lorenz [4] developed it in order to analyze the distribution of income and wealth within populations. He described the Lorenz curve, , for wealth within populations in the following way:
“Plot along one axis accumulated per cents of the population from poorest to richest, and along the other, wealth held by these per cents of the population”.
Consequently, is an accumulated amount of income (wealth) defined as a function of the proportion p of the population. It satisfies the condition because the income share of the poor is less than their proportion of the population. The increase caused by a fixed increase of the population is a growing function of p, and accordingly, the derivative is an increasing function of p and is a convex function [5] .
Consider the income distribution of a non-negative variable X. Let be the corresponding frequency distribution and let the mean of X be . Then, the Lorenz curve is
, (1)
where is the p quantile, that is . The Lorenz curve is not defined if the mean is zero or infinite. A Lorenz curve always starts at and ends at . The higher the Lorenz curve, the lesser is the inequality of the income distribution. The diagonal is commonly interpreted as the Lorenz curve for complete equality between income receivers, but according to [6] it is not perfectly associated with the Lorenz curve. As everyone has the same income level, strictly speaking, no one can be said to be at the lowest or highest level of the population. The associated Lorenz curve then exists only at the origin and the termination point by the definition of the curve. To overcome this problem, they adopted the convention of allocating any fraction of the population to be the lowest/highest x percent. This convention then allowed the 45 degree line through the origin to be associated with complete equality, as usually loosely taken to be so. This permitted Wang & Smyth [6] to use as a useful component in the creation of Lorenz curves.
On the other hand, increasing inequality lowers the Lorenz curve, and theoretically, it can converge towards the lower right corner of the square. A sketch of a Lorenz curve is given in Figure 1.
Variable transformations. Consider a transformed variable , where is positive and monotone increasing. Then, the distribution of is
. (2)
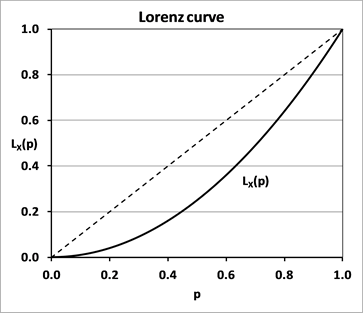
Figure 1. A sketch of a Lorenz curve . The diagonal interpreted as complete equality is included in the figure.
For the transformed variable Y, the p quantile is , that is, .
Now
. (3)
Hence,
(4)
and
. (5)
If the transformation is linear , then , ,
, (6)
and consequently, the Lorenz curve is invariant under linear transformations. A simple example of this property is that the Lorenz curve of income distributions is independent of the currency used. Another not so obvious result is that proportional income increase and flat tax policies are linear transformations and do not influence the Lorenz curve. Consequently, the Lorenz curve satisfies the general rules [1] :
To every distribution with finite mean corresponds a unique Lorenz curve, . The contrary does not hold because every curve is a common Lorenz curve for a whole class of distributions , where is an arbitrary positive constant.
Consider two variables X and Y, their distributions
and
, and their Lorenz curves
and
. If
for all p, then measured by the Lorenz curves, the distribution
has lower inequality than the distribution
and
is said to Lorenz dominate
. We denote this relation
[1] . An example of Lorenz dominance is given in Figure 2.
Income inequalities can be of different type and the corresponding Lorenz curves may intersect and for these no Lorenz ordering can be identified (cf. Figure 3). The Lorenz curve in Figure 3 corresponds to a population with

Figure 2. Lorenz curves with Lorenz ordering, that is, .

Figure 3. Two intersecting Lorenz curves.
very poor among the poor and rich who are not so rich. On the other hand, Lorenz curve corresponds to a population where the poor are relatively not so poor and the rich are relatively rich. For intersecting Lorenz curves, alternative inequality measures have to be defined.
Properties of Lorenz curves. The Lorenz curve has the following general properties:
i) is monotone increasing,
ii) ,
iii) is convex,
iv) and .
If the Lorenz curve is differentiable, the derivative has the following properties. Let , and the density function . When we differentiate the equation , we obtain ,
(7)
and
. (8)
The differentiation of yields
, (9)
and consequently,
. (10)
If the Lorenz curve is differentiable twice, then the second derivative is
.
Hence,
. (11)
If denotes the limit from the left, we can prove the following theorem [1] :
Theorem 1. If exists, then .
Proof. Consider the integral . If exists, then and for every there exists an such that if . Choose p so that , then
(12)
and .
As a consequence of (12),
.
Consider a one-parametric class of cumulative distribution functions , defined on the positive x-axis. If we assume that , i.e. it depends only on the product , then the following theorem holds [1] :
Theorem 2. Let be an one-parametric class of distributions with the properties
i) ,
ii) is defined on the positive x-axis,
iii) and its derivative are continuous,
iv) exists.
Let , then
(13)
and
, (14)
where and c are independent of .
Proof. Let be an arbitrary, positive parameter. Then the quantile is defined by the equation . If we define by the equation , then does not depend on and , and (13) is
proved. The formula (14) and the statement that is independent of is proved by using the substitution in the integrals and .
Furthermore, we can prove the following [1] :
Theorem 3. Consider a function defined on the interval with the properties
1) is monotone increasing and convex to the p-axis,
2) and ,
3) is differentiable,
iv) ,
then is a Lorenz curve of a distribution with finite mean.
Proof. If we denote the unknown distribution and its derivative , then necessarily . The derivative is a monotone- increasing function. If its inverse is denoted , we get the necessary relation
.
If , then . Now we shall prove the sufficiency, that is, that is a distribution whose mean is and whose Lorenz curve is . We denote , then . After observing that the property (iv) indicates that is integrable from 0 to 1, we introduce the variable transformation
.
We obtain
.
The given function has a monotone-increasing inverse function whose mean is .
Using the same transformation, we obtain that the Lorenz curve of is
,
and the theorem is proved.
These results have been collected in the following theorem [7] [8] :
Theorem 4. Consider a given function with the properties
(i) is monotone increasing and convex to the p-axis,
(ii) and ,
(iii) is differentiable,
(i) ,
then is the Lorenz curve of a whole class of distribution functions , where is an arbitrary positive constant and the function is the inverse function to .
Fellman [7] presented this result and later Fellman [8] presented the following theorem:
Theorem 5. A class of continuous distributions with finite mean has a common Lorenz curve if and only if .
Additional properties of the Lorenz curves. Consider the vertical difference D, between the diagonal and the Lorenz curve
.
The maximum of D implies , that is, .
For , and at the point the tangent
is parallel to the line of perfect equality. This is also the point at which the vertical distance between the Lorenz curve and the egalitarian line attains its maximum . This maximum is defined as the Pietra index, in this study denoted P, and discussed below [9] .
Kleiber and Kotz have outlined a progressive development of how the income distributions can be characterized by their Lorenz curves [10] [11] .
Income inequality indices. When Lorenz curves intersect, the corresponding distributions cannot be compared by the Lorenz curves. Consequently, the distributions have to be compared by numerical indices mainly based on the Lorenz curves.
Gini index. The most frequently used index is the Gini coefficient, G [12] . Using the Lorenz curves, this coefficient is the ratio of the area between the diagonal and the Lorenz curve and the whole area under the diagonal (cf. Figure 1). The formula is
. (15)
This definition yields Gini coefficients satisfying the inequalities . The higher the G value, the lower the Lorenz curve and the stronger the inequality. If , then the distribution , measured by the Gini coefficient, has lower inequality than the distribution and we say that Gini dominates , and denote this relation [13] . Finally, one observes the obvious result , that is, Lorenz dominance implies Gini dominance.
The coefficient allows direct comparison of the income of two populations’ distributions, regardless of their sizes. The Gini’s main limitation is that it is not easily decomposable or additive. Also, it does not respond in the same way to income transfers between people in opposite tails of the income distribution as it does to transfers in the middle of the distribution. The reason for the popularity of the Gini coefficient is that it is easy to compute being a ratio of two areas in Lorenz curve diagrams. As a disadvantage, the Gini index only maps a number to the properties of a diagram, but the diagram itself is not based on any model of a distribution process. The “meaning” of the Gini index can only be understood empirically. Hence, the Gini does not capture where in the distribution the inequality occurs. As an additional result, two very different distributions of income having different Lorenz curves can have the same Gini index.
Using the Gini coefficient presented in the text, one can compare the Gini coefficients for and in Figure 3; has less inequality ( ) than ( ).
There are other inequality measures defined by the Gini coefficient. Yitzhaki [14] proposed a generalized Gini coefficient
, (16)
where . Different are used in order to identify different inequality properties. For low greater weights are associated with the rich and for high greater weights are associated with the poor.
Using the mean income ( ) and the Gini coefficient (G), Sen [15] proposed a welfare index
. (17)
Pietra index. The Pietra index P is defined as the maximum , presented above. It can be graphically represented as the longest vertical distance between the diagonal and the Lorenz curve, or the cumulative portion of the total income held below a certain income percentile, with the 45 degree line representing perfect equality. The definitions yield Pietra coefficients satisfying the inequality . The lower bound of P is obtained when there is total income equality, that is, the Lorenz curve coincides with the diagonal. The upper bound can be obtained when the Lorenz curve converges towards the lower right corner. The limits in the inequalities can be obtained, and this is outlined in Figure 4. The Pietra index can be interpreted as the income of the rich that should be redistributed to the poor in order to obtain total income equality. In other words, the value of the index approximates the share of total income that must be transferred from households above the mean to those below the mean to achieve equality in the distribution of incomes. Higher values of P indicate more inequality, and more redistribution is needed to achieve income equality. Therefore, the index is sometimes named the Robin Hood index. The Pietra index is also known as the Hoover index and it is still better known as the Schutz index [16] [17] [18] .
If , then the distribution measured by the Pietra index has lower inequality than the distribution , and we say that Pietra dominates . We denote this relation . For the Lorenz curves in Figure 3, is more equal than . In general, the Pietra and the Gini orderings are not identical [1] . However, one observes the similar

Figure 4. Sketches of two extreme cases of simplified Rao-Tam Lorenz curves with corresponding P indices. For the Lorenz curve , the Pietra index is 0.0819 and for the Lorenz curve the index is 0.697 [1] .
obvious result , that is, Lorenz dominance implies Pietra dominance.
An alternative definition of the Pietra index has also been given. It can be defined as twice the area of the largest triangle inscribed in the area between the Lorenz curve and the diagonal line [9] . In Figure 5, one observes that the triangle obtains its maximum when the corner lies on the Lorenz curve where the tan-
gent is parallel to the diagonal. The height of the triangle is , and the base is the diagonal . The double of the area is .
In comparison, the Gini index, G, is twice the area between the Lorenz curve and the diagonal, and the Pietra index is twice the area of the triangle inscribed in this area. Hence, the inequality holds generally [1] .
3. Applications
In this section, we collect some examples in order to elucidate the theory. The models Pareto [19] , the simplified Rao-Tam [20] and the Chotikapanich [21] contain only one parameter. Therefore, they can easily be analyzed. Rohde [22] and Fellman [2] [13] paid these models special attention and examined them in more detail. However, they are so simple that it is impossible to distinguish between the estimated length of the range for the income distribution function and

Figure 5. The Lorenz curve and the geometric interpretations of the Pietra index.
the Gini coefficient. If one of these properties is estimated, the other is fixed. We consider these three theoretical Lorenz curve models. We present how the Lorenz curves and the Gini and the Pietra indices depend on the model parameters. In addition, we compare the Lorenz curves of the models when their Gini indices are equal.
Pareto model. We define the Pareto distribution as , where and .
The frequency function is , the mean is , the quantiles are , the Lorenz curve and the Gini coefficient . If , and if , . In Figure 6, we present the Pareto distribution as a function of the parameter .
Finally, the Pietra index is . According to the general theory, the inequality holds for all parameter values, and consequently, when . Let , then . When , , then, . In Figure 7, we compare the Gini and Pietra indices as functions of the model parameter . One observes that the inequality holds.
Simplified Rao-Tam model. Consider the simplified Rao-Tam model whose Lorenz curve is [20] . When , then and

Figure 6. Lorenz curves for Pareto distributions with different parameter values.

Figure 7. Gini and Pietra indices for Pareto distributions with different parameter values.
when for all and the Lorenz curve converges, towards the lower right corner of the square. In Figure 8, we present the Lorenz curve for a set of values.
The Gini coefficient is . When , then and when then . The Pietra index is . Using the vertical difference , the index inequalities hold, and for , and consequently, . For increasing values, the supremum of is one. This must also hold for the supremum of . Consequently, the interval cannot be shortened. In Figure 9, we present G and P for different .

Figure 8. Lorenz curves for simplified Rao-Tam distributions with different parameter values.

Figure 9. Gini and Pietra indices for simplified Rao-Tam distributions with different parameter values.
Chotikapanich. Chotikapanich [21] defined the Lorenz curve for .
The limits of the fractions studied below result in indefinite forms and l’Hospital’s rule has to be applied several times. For and arbitrary , we obtain . This means that the Lorenz curve converges towards the diagonal. For , one obtains that for all
This means that the Lorenz curve converges towards the lower right corner of the square.
The extreme Lorenz curves can be obtain by the limit studies and , and the Lorenz curves as functions of the parameter k are presented in Figure 10.
The Gini index is for the Chotikapanich model
.
When , one obtains
When , one obtains

Figure 10. Lorenz curves for Chotikapanich distributions with different parameter values.
Consequently, for G, the inequalities hold and the range cannot be shortened.
The Pietra index is
In general, , and consequently, when . When , one obtains
Hence, and the inequalities hold and cannot be shortened.
The G and P as functions of the parameter k indices are presented in Figure 11.

Figure 11. Gini and Pietra indices for Chotikapanich distributions with different parameter values.

Figure 12. Lorenz curves for distributions with the same Gini index ( ). Note that the Lorenz curves for the simplified Rao-Tam and Chotikapanich models are rather similar, but the Lorenz curve for the Pareto model is markedly different.
Above, we made the general remark that different distributions can result in the same Gini index. In Figure 12, we present a simple example of this finding. We compare a Chotikapanich model with the Gini index 0.500 (k = 3.593525) with a Pareto model (with ) and a simplified Rao-Tam distribution (with ), all having the same Gini index. The Lorenz curves for the simplified Rao-Tam and Chotikapanich models are rather similar, but the Lorenz curve for the Pareto model is markedly different. This is caused by the fact that the Pareto model is introduced as a model for distributions with high income levels.
4. Discussion
In general, the step from the Lorenz curve to the income distribution starts from the formula
, (18)
where is the p-percentile and µ is the mean of the corresponding distribution . We define as the inverse function of the derivative . From (18), we obtain
. (19)
Equation (19) indicates that is the income distribution function corresponding to the given Lorenz curve, that is, . This connection
between the Lorenz curve and the distribution function is easily defined, but for most of the exact Lorenz curves, it is difficult or even impossible to mathematically obtain the distribution.
Primary income data yield the most exact estimates of the income inequality coefficients, such as Gini and Pietra. Fellman [2] analyzed different methods for numerical estimation of Gini coefficients based on Lorenz curves. As an application of these methods, he considered Pareto distributions. Using Lorenz curves, various numerical integration attempts were applied to obtain accurate estimates. The trapezium rule is simple, but yields a positive bias for the area under the Lorenz curve, and consequently, a negative bias for the Gini coefficient. Simpson’s rule is better fitted to the Lorenz curve, but this rule demands an even number of subintervals of the same length. Lagrange polynomials of second degree can be considered as a generalization of Simpson’s rule. Fellman [2] compared different methods and he also gave references concerning numerical integration. To include Simpson’s rule in his study, he considered Lorenz curves with deciles. Compared with Simpson’s rule, he used the trapezium rule, Lagrange polynomials and generalizations of Golden’s method [23] . No method was uniformly optimal, but the trapezium rule was almost always inferior and Simpson’s rule was superior. Golden’s method is usually of medium quality. Mettle et al. [3] estimated the Lorenz curve by Newton-Cotes methods, namely, the trapezium rule, Simpson’s 1/3 rule and Simpson’s 3/8 rule. Using these, they estimated the Gini coefficients of income and compared the accuracy of these estimates on some (Ghanaian) data. The curves in Figure 12 in this study indicate weaknesses in the inequality indices. Lorenz curves with the same Gini index may show marked geometrical differences and consequently different income distributions.
Acknowledgements
This work was supported in part by a grant from the Magnus Ehrnrooth Foundation.
Cite this paper
Fellman, J. (2018) Income Inequality Measures. Theoretical Eco- nomics Letters, 8, 557-574. https://doi.org/10.4236/tel.2018.83039
References
- 1. Fellman, J. (2015) Mathematical Analysis of Distribution and Redistribution of Income. Science Publishing Group, 166 p. http://www.sciencepublishinggroup.com/book/B-978-1-940366-25-8.aspx
- 2. Fellman, J. (2012) Estimation of Gini Coefficients Using Lorenz Curves. Journal of Statistical and Econometric Methods, 1, 31-38.
- 3. Mettle, F.O., Darkwah, K.A., Nortey, E.N. and Lotsi, C.A. (2016) An Estimation of the Gini Coefficient of Income Using Newton-Cotes Methods. Conference Paper February 2016.
- 4. Lorenz, M.O. (1905) Methods for Measuring Concentration of Wealth. Publ. of the Amer. Statist. Assoc., 9, 209-219.
- 5. Fellman, J. (2011) Lorenz Curve. In: Lovric, M., Ed., International Encyclopedia of Statistical Science, Part 12, 760-762. https://doi.org/10.1007/978-3-642-04898-2_345
- 6. Wang, Z.X., Ng, Y.-K. and Smyth, R. (2011) A General Method for Creating Lorenz Curves. Review of Income and Wealth, 57, 561-582. https://doi.org/10.1111/j.1475-4991.2010.00425.x
- 7. Fellman, J. (1976) The Effect of Transformations on Lorenz Curves. Econometrica, 44, 823-824. https://doi.org/10.2307/1913450
- 8. Fellman, J. (1980) Transformations and Lorenz Curves. Swedish School of Economics and Business Administration Working Papers, 48, 18 p.
- 9. Lee, W.-C. (1999) Probabilistic Analysis of Global Performances of Diagnostic Tests: Interpreting the Lorenz Curve Based Summary Measures. Statistics in Medicine, 18, 455-471. https://doi.org/10.1002/(SICI)1097-0258(19990228)18:4<455::AID-SIM44>3.0.CO;2-A
- 10. Kleiber, Ch. and Kotz, S. (2001) Characterizations of Income Distributions and the Moment Problem of Order Statistics. The 53rd Session of the International Statistical Institute, Seoul, Korea, 22-29 August 2001. http://isi.cbs.nl/iamamember/CD2/pdf/462.pdf
- 11. Kleiber, Ch. and Kotz, S. (2002) A Characterization of Income Distributions in Terms of Generalized Gini Coefficients. Social Choice and Welfare, 19, 789-794. https://doi.org/10.1007/s003550200154
- 12. Gini, C. (1914) Sulla misura della concentrazione e della variabilita dei caratteri. Premiate officine grafiche C. Ferrari, 73c, 1203-1248.
- 13. Fellman, J. (2012) Modelling Lorenz Curve. Journal of Statistical and Econometric Methods, 1, 53-62.
- 14. Yitzhaki, S. (1983) On an Extension of the Gini Index. International Economic Review, 24, 617-628. https://doi.org/10.2307/2648789
- 15. Sen, A. (1973) On Economic Inequality. Clarendon Press, Oxford. https://doi.org/10.1093/0198281935.001.0001
- 16. Hoover, E. (1936) The Measurement of Industrial Localization. The Review of Economics and Statistics, 18, 162-171. https://doi.org/10.2307/1927875
- 17. Schutz, R.R. (1951) On the Measurement of Income Inequality. American Economic Review, 41, 107-122.
- 18. Atkinson, A.B. (1970) On the Measurement of Inequality. Journal of Economic Theory, 2, 244-263. https://doi.org/10.1016/0022-0531(70)90039-6
- 19. Rasche, R.H., Gaffney, J., Koo, A.Y.C. and Obst, N. (1980) Functional Forms for Estimating the Lorenz Curve. Econometrica, 48, 1061-1062. https://doi.org/10.2307/1912948
- 20. Rao, U.L.G. and Tam, A.Y.-P. (1987) An Empirical Study of Selection and Estimation of Alternative Models of the Lorenz Curve. Journal of Applied Statistics, 14, 275-280. https://doi.org/10.1080/02664768700000032
- 21. Chotikapanich, D. (1993) A Comparison of Alternative Functional Forms for the Lorenz Curve. Economics Letters, 41, 129-138. https://doi.org/10.1016/0165-1765(93)90186-G
- 22. Rohde, N. (2009) An Alternative Functional Form for Estimating the Lorenz Curve. Economics Letters, 105, 61-63. https://doi.org/10.1016/j.econlet.2009.05.015
- 23. Golden, J. (2008) A Simple Geometric Approach to Approximating the Gini Coefficient. The Journal of Economic Education, 39, 68-77. https://doi.org/10.3200/JECE.39.1.68-77