 Journal of Service Science and Management, 2012, 5, 355-364 http://dx.doi.org/10.4236/jssm.2012.54042 Published Online December 2012 (http://www.SciRP.org/journal/jssm) 355 Bank Branch Grouping Strategy, an Unusual DEA Application Barak Edelstein, Joseph C. Paradi, Adria Wu, Petty Yom Centre for Management of Technology and Entrepreneurship, Faculty of Applied Science and Engineering, University of Toronto, Toronto, Canada. Email: barak.edelstein@utoronto.ca, paradi@mie.utoronto.ca, adriawu@gmail.com, petty.yom@alumni.utoronto.ca Received October 16th, 2012; revised November 19th, 2012; accepted November 26th, 2012 ABSTRACT This study uses Data Envelopment Analysis (DEA) to develop a grouping strategy for the bank branches of a large Ca- nadian Bank. In order to benchmark their branches’ performance, the Bank first clusters the branches based on commu- nity type and population size—a not fully satisfactory approach. Hence, DEA was used to develop a grouping approach using an input oriented BCC production model to capture and analyze the aggregated effects of many complex proc- esses. The model examines the relationship between staff and transaction activities. The peer references produced by the DEA model illustrate that the Bank’s current clustering methodology fails to compare some branches that are simi- lar from an operational perspective; a flaw in the Bank’s current grouping approach. The new grouping strategy offers a fair and equitable set of benchmarking peers for every inefficient branch. Keywords: Data Envelopment Analysis; DEA; Benchmarking; Grouping; Clustering; Data Sorting; Process Improvement; Productivity; Bank Branch 1. Introduction In this paper Data Envelopment Analysis (DEA) is used to sort data rather than assess the un its’ efficiency or pro- ductivity. The work was inspired by a problem one of the major Canadian banks had when they attempt to bench- mark their branches’ performance. While we had done several studies in bank branch efficiency [1-5], this ef- fort was to help them see that grouping their branches for any comparative reason should be done in a different manner than simply using location or size as the crite- rion. 1.1. The Canadian Banking Industry The Canadian banking industry is becoming increasingly competitive with a total of 66 banks operating in Canada, including 21 domestic banks and 45 foreign banks. To- gether these 66 banks operate over 5900 branches in Canada, employ over 249,000 people, and manage al- most $1.8 trillion in assets [6]. In addition, the largest five banks also carry on extensive businesses via banks owned outside of Canada and have significant presence in other financial services areas such as insurance, secu- rities brokerage and trust activities. The banks in Canada conduct much of their business and compete with each other through their branch net- works. The branch network is the bank’s main vehicle for contact and the management of relationships with customers. Furthermore, the banks are placing renewed emphasis on their branch channel and are aggressively expanding them. This is a turnaround from a decade ago when they were busy closing branches and consolidating their branch network. It is therefore important for banks to be able to evaluate and improve the performance of their branch networks. Banks use grouping strategies in order to cluster bran- ches into comparable peer groups with the purpose of comparing the performance of branches within each peer group, often using simple ratios. Banks typically use geo- graphic and demographic factors to sort bank branches into peer groups, but these factors often ignore opera- tional similarities and differences between them as they concentrate on regional or demographic factors. Such clustering approaches can create peer groups that are composed of operationally dissimilar branches which cause branch managers to push back when they are con- fronted with performance appraisals that show them in a poor light. It is crucial to not only make such compari- sons fair and equitable, but it must be seen to be such when viewed by those being measured. Therefore, it would be very advantageous to group or cluster opera- tionally similar branches into peer groups which can be Copyright © 2012 SciRes. JSSM  Bank Branch Grouping Strategy, an Unusual DEA Application 356 seen to be appropriate, thus making the within group per- formance evaluations and the resulting performance tar- gets fair and potentially easier to accept, and more im- portantly to be acted upon. 1.2. Data Envelopment Analysis Data Envelopment Analysis (DEA) is a non-parametric linear programming (LP) methodology that defines a convex piecewise linear efficient frontier composed of the best performing decision making units (DMUs), and calculates relative efficiency scores for the inefficient DMUs by measuring their relative distance to the effi- cient frontier. For each inefficient unit DEA provides a set of improvement targets and efficient benchmarks al- lowing management to identify best practices in at- tempting to improve the performance of the inefficient units, and in setting improvement goals [7]. DEA can handle multiple inputs and outputs simultaneously and does not require specification of a production function for the model’s variables [7]. In complex service indus- tries such as the banking industry many of the input- output relationships are unknown, especially when ex- amining multiple inputs and outputs simultaneously. DEA in its constant returns to scale (CRS) form, known as the CCR model, was introduced in 1978 by Charnes, Cooper, and Rhodes [8]. The BCC model introduced by Banker, Charnes, and Cooper in 1984 provided the vari- ables returns to scale (VRS) DEA formulation [9]. In 1985 Sherman and Gold used DEA to study the produc- tion efficiency of bank branches [10]. Since then many studies have used DEA to measure the efficiency of bank branches [2]. These studies can be classified into several categories including production, profitability, and inter- mediation. The production approach, which is used in this study, analyzes the bank’s branches from an opera- tional perspective where a branch uses inputs such as labor to produce output transactions such as deposits and loans. DEA has several advantages over the performance ra- tios that are often used by the banks to evaluate branch performance. While ratios are simple to use and rela- tively easy to understand, their level of simplicity can be problematic in trying to see the big picture which incur- porates many different aspects. Ratios examine the pro- portional relationship between two specific variables, but they fail to incorporate the multiple variables that must be examined together to fully understand the situation. No single ratio should be used to come to conclusions about the performance of a branch, but rather in examin- ing the overall state of a branch a variety of ratios must be considered together. Simultaneously considering or aggregating the results of different ratios can be mis- leading by potentially masking underperformance and relationships that exists in the data. Index numbers are often used to aggregate several weighted variables or ratios thus considering several factors at the same time. However, problems can arise from the selection of the weights used in calculating index numbers. Performing a multi-dimensional analysis such as DEA that considers all the pertinent variables simultaneously and does not require specifying a production function for the model’s variables can provide a single aggregated performance indicator that better represents the overall state of the branches’ performance. As DEA is a well known operational research method- ology, since this paper assu mes only introducto ry famili- arity with DEA, we will not repeat the theoretical and mathematical derivation of the approach. If the reader needs to learn more about the basics of DEA, we refer you to the excellent book on DEA by Cooper, Seiford and Tone [7]. The rest of the paper is structured as follows. It begins with an outline of our motivations for the study and the issues that arose from the present method used by the Bank. In Section 3 we show the methodology used and the rationale for what models were employed. Then, in Section 4 we report on the results achieved and show how the work can be utilized in the real world of this Bank. The paper concludes with a summary of the find- ings and this is presented in Section 5. 2. Motivation and Goals The bank in this study is one of Canada’s largest five banks. It operates over 1000 branches in Canada and offers a full range of banking services. In order to pro- duce meaningful evaluations of their branches’ perform- ance, the Bank currently groups branches into seven clu- sters (categories) based on the community type and po- pulation size in the area in which they operate, as shown in Table 1 below [11]. Table 1. Description of the Bank’s current peer groups. GroupDescription of location A Downtown area of a city with a population > 500K B Adjacent to the downtown area of a city with a popula- tion > 500K C Adjacent to the urban area of a city with a population > 500K, including commuter are as D City with a population between 250K and 500K E Community with a population between 25K and 250K F Community with a population < 25K G Community with a population < 10K and >2 hrs drive from an urban center Copyright © 2012 SciRes. JSSM  Bank Branch Grouping Strategy, an Unusual DEA Application 357 The Bank utilizes its peer grouping in develop ing stra- tegic targets and evaluating performance through peer benchmarking, mostly through the use of performance ratios. Under the Bank’s current peer grouping method- ology, group members can hav e significan t differences in their operations and structure yet would be compared to each other due to general similarities in the locations out of which they operate. However, branches that are opera- tionally similar are often grouped into different clusters and are thus not compared to each other. The Bank’s current grouping strategy uses somewhat arbitrary popu- lation cutoff levels (10K, 25K, 250K, and 500K) to dis- tinguish between peer groups. By clustering branches in such a way, the Bank ignores other factors such as branch size and the characteristics of the branches’ cus- tomer base which affect the quantity and type o f tran sact- tions that the branches produce. The geographical and population size dependence of the Bank’s grouping stra- tegy are often no t reflective of operational similarity and the inclusion of branches in one peer group or another is again done somewhat arbitrarily. Consider for example the City of Hamilton and the former Town of Dundas (both located in southern On- tario, Canada). Hamilton and Dundas are in close prox- imity to each other, and were amalgamated in 2001. In 1996 Hamilton had a population of 322,352 [12] and bank branches in Hamilton would have therefore be- longed to Group D, while Dundas had a population of 23,125 [12] and its branches would have therefore be- longed to Group F. Being in very close proximity to each other, the communities of Hamilton and Dundas are ar- guably similar and their populations and businesses are intertwined. Therefore, to group branches in Hamilton and Dundas into such different peer groups is problem- atic. Rather than being compared to branches in Hamil- ton and other such similar urban communities, branches in Dundas would have been compared to other branches in Group F some of which are located in small remote communities. After the 2001 amalgamatio n of Hamilton and Dundas along with other small towns in the vicinity, the popul- ation of the newly amalgamated City of Hamilton grew to 490,268 as shown in the 2001 Canadian Census, mainly due to the amalgamation as the real population growth since 1996 was only 4.8% [13]. The Government of Ontario’s decision to amalgamate Hamilton and Dun- das meant that in 2001 branches in Dundas, which were previously in Group F, would have been included in Group D and compared with other urban branches in that group. In addition, the 2006 Census showed that while the population of the amalgamated City of Hamilton grew by less than 3% between 2001 and 2006, it reached a level of 504,559 in 2006 [14] and therefore surpassed the arbitrary level of 500K set by the Bank. Conse- quently, in 2006, the branches of both Hamilton and Dundas would have been clustered into Groups A, B, or C and would have been compared to other branches in those groups instead of being compared to branches in group D to w hich Hamilton an d Dundas belonged b efore 2006. Furthermore, any smaller communities which would have been defined by the Bank as being adjacent to Hamilton, or commuter areas of Hamilton, would have also been included in Group C after the amalgamated City of Hamilton surpassed the arbitrary 500K popula- tion threshold. Finally, it could be argued that branches in Hamilton which is less than 70 km away from Can- ada’s largest city, Toronto, along with all the bran ches in between the two cities should have been grouped to- gether with branches in Toronto. It clearly makes more sense and results in a more credible approach as most people would agree that due to strong economic and demographic similarities and dependencies of th ese com- munities such grouping would be more acceptable. We will show that the Bank’s current grouping strategy is quite arbitrary at times as it fails to group operationally similar branches together, sometimes leading to inappro- priate comparisons between branches and failing to compare branches that operate in a similar manner. There were two main drivers in this study. First, the Bank needs a more comprehensive and defendable branch grouping methodology before they do any credible bench- marking. Second, a better data sorting tool such as DEA could make the branch grouping process fairer and more equitable. The work encompassed an approach to sorting bran- ches and then comparing the results to the approach the Bank uses. This was to convince management and branch staff that the DEA method is better from a number of points of view. Our work resulted in a defendable ap- proach to a new grouping technique for the Bank for its inefficient branches by utilizing DEA efficient peers. 3. Methodology Before we delve into the methodology employed here, it is instructive to recall the one paper from the literature by Thanassoulis [15] where he examined the efficiency of police forces in England and Wales. Given that police forces operate in different demographical areas, com- parison to peers which operate under better circum- stances is unfair to those police units which have to deal with more perpetrators without fixed addresses and in communities where the people do not readily cooperate with police. To address this problem, Thanassoulis [15] had introduced a variable that reflected the social and economic deprivation of the district covered by the spe- cific police unit. This variable was an index that had both positive and negative values, but the base index was ar- bitrary and there was little confiden ce in it as a represen- Copyright © 2012 SciRes. JSSM  Bank Branch Grouping Strategy, an Unusual DEA Application Copyright © 2012 SciRes. JSSM 358 tative factor that could be used as an input or output. However, the authorities that manage the police forces (43 such units in this study) did recognize the problem and had divided the forces into “families” using a num- ber of indicators available. Hence, only units in the same family could be compared so that the comparison would be fair and equitable. Thanassoulis carried out some de- tailed analyses both within the families of police units and with appropriate weight restrictions on some of the variables to reflect the importance, for example, of solv- ing a violent crime or a simple theft. The interesting part of this prior work is the concept that grouping units to be studied using external realities of environment, demographics and even social conditions to group units also existed in our work. The Bank did group, rather arbitrarily but acceptably to the measured units, the branches which could be compared to each other. As in [15], we had found that these groupings by management do not represent the peers well, in our case much more so than in [15]. 3.1. Dataset The data provided by the Bank encompasses the opera- tions of over 1200 branches over a 10 month period dur- ing the Bank’s 2004 fiscal year. A total of 279 branches were removed from the dataset due to several reasons. Commercial branches were removed also as their busi- ness strategy has a different focus as was shown by Schaffnit and Paradi [1]. The data statistics are shown in Table 2. It is important to check if the data contains variables which are not closely related, so a cross correlation was done on the 966 DMUs we were left with and the results are shown in Table 3. 3.2. The Model The model aims to iden tify the efficient branches that are similar from an operational perspective to the inefficient branches. A production style model was chosen for this study converting inputs into outputs. The inputs are com- prised of the branch personnel while the outputs are rep- resented by transacti ons. The Bank divides branch personnel into four catego- ries: Administration, Sales, Service, and Management. The administrative staff were added to the service staff counts as many branches had few or no administrative staff and the administrative and service staff perform similar duties. The three staff categories measured in terms of Full Time Equivalents (FTEs) of personnel comprised the inputs to the DEA model as they represent a generally comparable human resource across all bran- ches thus not requiring accounting for regional salary differences. Output variables used in the model measure revenue generating transactions and service transactions at each branch including: 1) Day to Day Banking transactions for Table 2. Statistics on Input/Output Data. INPUTS OUTPUTS Service (include Admin) Sales MgmtTotal Day to Day (units) Total Investment (units) Total Borrowing (units) OTC Max 53.63 40.72 1.75 18,308 19,656 8222 3186208 Min 0.98 0.62 0.00 143 111 119 12,009 Average 8.16 5.48 0.82 2867 3414 1855 248,459 SD 4.41 3.34 0.21 1832 2244 1028 172,880 Table 3. Correlation between variables used. Service (include Admin) Sales Mgmt Total Day to Day (units) Total Investment (units) Total Borrowing (units) OTC Service (incl. Admin) 1.0000 0.8600 0.3753 0.8745 0.8145 0.8104 0.9370 Sales 0.8600 1.0000 0.2641 0.8325 0.8667 0.8523 0.8032 Management 0.3753 0.2641 1.0000 0.3526 0.2797 0.3549 0.3341 Total Day to Day (units) 0.8745 0.8325 0.3526 1.0000 0.7955 0.8683 0.8113 Total Investment (units) 0.8145 0.8667 0.2797 0.7955 1.0000 0.7589 0.7487 Total Borrowing (units) 0.8104 0.8523 0.3549 0.8683 0.7589 1.0000 0.7601 OTC 0.9370 0.8032 0.3341 0.8113 0.7487 0.7601 1.0000 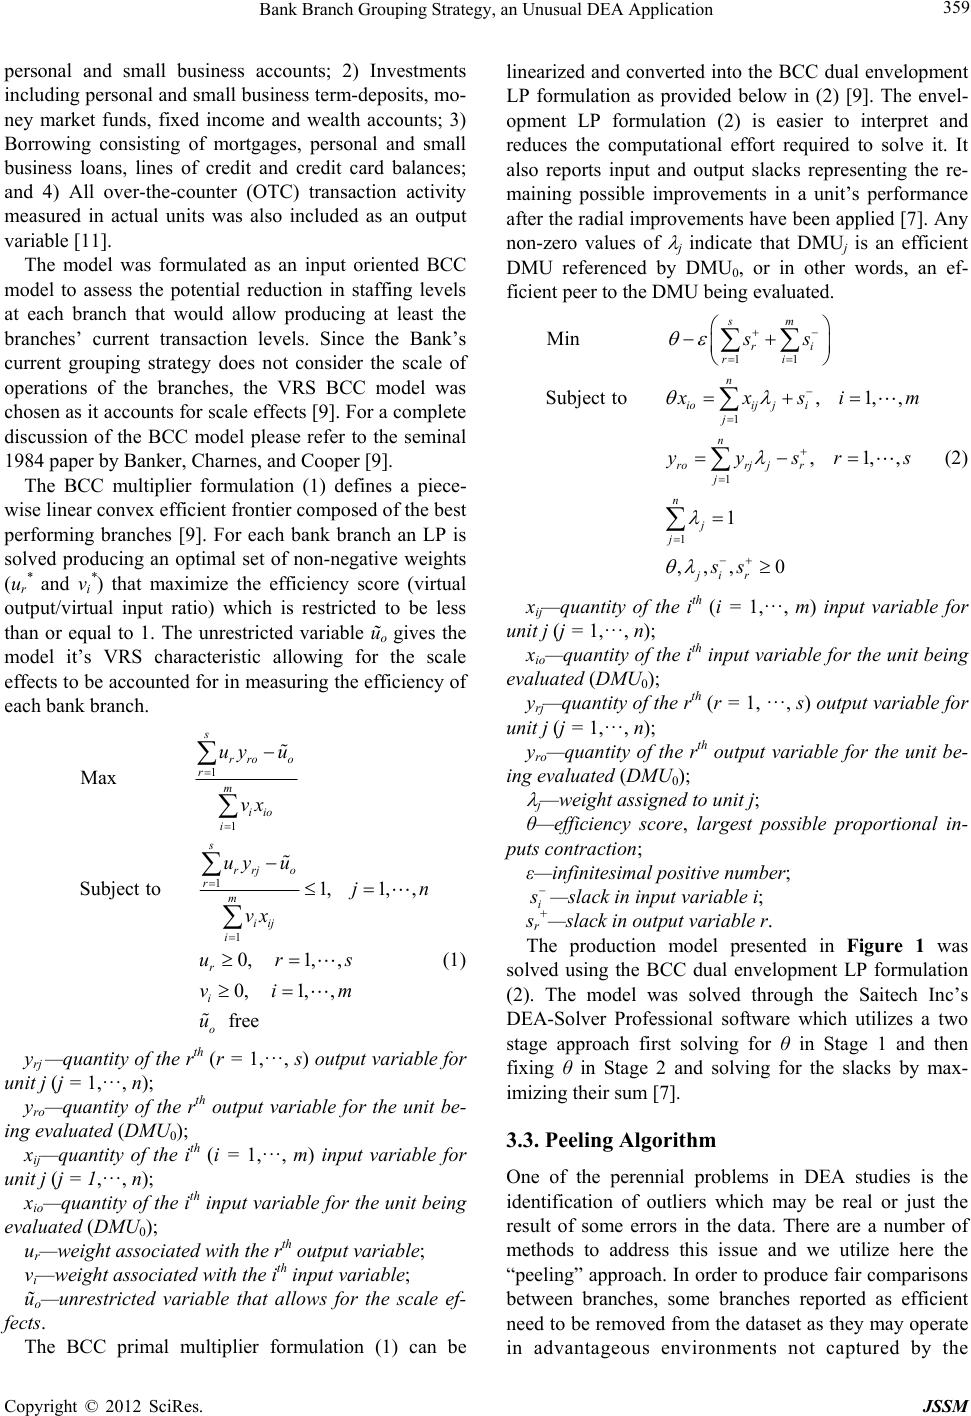 Bank Branch Grouping Strategy, an Unusual DEA Application 359 personal and small business accounts; 2) Investments including personal and small business term-deposits, mo- ney market funds, fixed income and wealth accounts; 3) Borrowing consisting of mortgages, personal and small business loans, lines of credit and credit card balances; and 4) All over-the-counter (OTC) transaction activity measured in actual units was also included as an output variable [11]. The model was formulated as an input oriented BCC model to assess the potential reduction in staffing levels at each branch that would allow producing at least the branches’ current transaction levels. Since the Bank’s current grouping strategy does not consider the scale of operations of the branches, the VRS BCC model was chosen as it accounts for scale effects [9]. For a complete discussion of the BCC model please refer to the seminal 1984 paper by Banker, Charnes, and Cooper [9]. The BCC multiplier formulation (1) defines a piece- wise linear convex efficient frontier composed of the best performing branches [9]. For each bank branch an LP is solved producing an optimal set of non-negative weights (ur * and vi *) that maximize the efficiency score (virtual output/virtual input ratio) which is restricted to be less than or equal to 1. The unrestricted variable ũo gives the model it’s VRS characteristic allowing for the scale effects to be accounted for in measuring the efficiency of each bank branch. 1 1 1 1 Max Subject to1,1,, 0,1,, 0,1, , free s rro o r m iio i s rrj o r m iij i r i o uy u vx uy u jn vx urs vim u (1) yrj —quantity of the rth (r = 1,···, s) output variable for unit j (j = 1,···, n); yro—quantity of the rth output variable for the unit be- ing evaluated (DMU0); xij—quantity of the ith (i = 1,···, m) input variable for unit j (j = 1,···, n); xio—quantity of the ith input variable for the unit being evaluated (DMU0); ur—weight associated with the rth output variable; vi—weight associated with the ith input variable; ũo—unrestricted variable that allows for the scale ef- fects. The BCC primal multiplier formulation (1) can be linearized and converted into the BCC dual envelopment LP formulation as provided below in (2) [9]. The envel- opment LP formulation (2) is easier to interpret and reduces the computational effort required to solve it. It also reports input and output slacks representing the re- maining possible improvements in a unit’s performance after the radial improvements have been applied [7]. Any non-zero values of j indicate that DMUj is an efficient DMU referenced by DMU0, or in other words, an ef- ficient peer to the DMU being evaluated. 11 1 1 1 Min Subject to,1,, ,1,, 1 ,,, 0 sm ri ri n ioijji j n rorj jr j n j j ji r ss xsi yysr ss m s (2) xij—quantity of the ith (i = 1,···, m) input variable for unit j (j = 1,···, n); xio—quantity of the ith input variable for the unit being evaluated (DMU0); yrj—quantity of the rth (r = 1, ···, s) output variable for unit j (j = 1,···, n); yro—quantity of the rth output variable for the unit be- ing evaluated (DMU0); j—weight assigned to unit j; θ—efficiency score, largest possible proportional in- puts contraction; ε—infinitesimal positive number; i —slack in input variable i; sr +—slack in output variable r. The production model presented in Figure 1 was solved using the BCC dual envelopment LP formulation (2). The model was solved through the Saitech Inc’s DEA-Solver Professional software which utilizes a two stage approach first solving for θ in Stage 1 and then fixing θ in Stage 2 and solving for the slacks by max- imizing their sum [7]. 3.3. Peeling Algorithm One of the perennial problems in DEA studies is the identification of outliers which may be real or just the result of some errors in the data. There are a number of methods to address this issue and we utilize here the “peeling” approach. In order to produce fair comparisons between branches, some branches reported as efficient need to be removed from the dataset as they may operate in advantageous environments not captured by the Copyright © 2012 SciRes. JSSM  Bank Branch Grouping Strategy, an Unusual DEA Application 360 Figure 1. Model inputs and outputs. model’s variables, or may posses some advantage which their peers cannot copy or create. The dataset may also contain data errors for some branches causing them to be reported as efficient branches when they are actually not. Such artificially efficient branches can cause a shift in the frontier to more efficient levels causing the ineffi- cient branches referencing those segments of the frontier thusly distorted to receive unnaturally low efficiency scores. Such artificially efficient branches could also be reported as references for inefficient branches when in fact they are not comparable. Divine [16], and Thanassoulis [17] suggested using a layering, or peeling technique, where the efficient units are removed from the sample and the analysis is run again to see if the scores of the remaining units change much. Peeling algorithms are typically based on either performing several iterations of complete peeling where all efficient branches are removed during each peel, or the removal of all efficient branches referenced by more than a certain threshold of inefficient branches. These procedures however ignore the strength of these refer- ences as represented by the λ values. The final recommendations to the Bank include per- forming a review of efficient branches that were identi- fied as potential outliers to determine whether they are good performers whose results could be achieved by the branches referenc ing them, or wh ether there is somethin g unique about their operation s or potentially whether their data contains an error. However, since it was not plausi- ble for such a review to be performed by the Bank during the time that this research was being performed, the peel- ing algorithm (3) below was used to identify potential outliers and remove them from the dataset as a precau- tion. Sensitivity analysis was used to examine the effects of removing efficient branches that were being referenced by an unexpectedly high number of inefficient branches. The upper threshold level for efficient branches that were being referenced was set at >25% of the inefficient bran- ches. The λ values indicate the strength of the relation- ship between the inefficient branches and the efficient branches which they reference. When an inefficient branch is projected onto a point on the BCC efficient frontier that point is defined as a linear combination of the efficient branches that the inefficient branch refer- ences, and those efficient branches’ corresponding λ val- ues indicate what proportion they contribute to defining that point on the efficient frontier. Sensitivity analysis was conducted for λ > 0.15, λ > 0.20, and λ > 0.25 wher e the efficient branches were being referenced by >25% of the inefficient branches. As the λ value increased, the number of times efficient branches were being referenced decreased as the weaker relationships were not being counted. Since no efficient branches were being refer- enced by >25% of the inefficient branches when λ > 0.25, λ > 0.20 was used to identify which efficient branches to peel [11]. The peeling algorithm (3) is summarized be- low. Peeling algorithm: (3) Step 1: Solve the production model in Figure 1 using the BCC envelopment LP Formulation (2). Step 2: Remove from the dataset all efficient un its ref- erenced by more than 25% of the inefficient units with a λ > 0.20. Step 3: Return to Step 1. Terminate the algorithm once Step 2 removes no additional efficient outliers. 4. Results 4.1. Peer Group DEA Results Table 4 summarizes the DEA results broken down by the Bank’s current peer groups [11]. It should be noted that group C has the highest number of efficient branches as it also has the highest number of total branches. Group G has the second highest number of efficient branches de- spite having the second lowest total number of branches. The average efficiency scores were similar across all the groups. Using the same model but excluding the 86 branches from group “G” the same peeling algorithm as previously discussed was used to remove all efficient outliers that are being referenced by a significant number of inef- Table 4. DEA results summary broken dow n by the Bank’s current peer groups. Group A B C D E F G Total # Branches 2992376 129 141 113 86966 # Efficient 4 6 25 6 5 9 1974 % Efficient14% 6%7% 5% 3% 8% 22% 8% Average Score0.780.810.82 0.81 0.78 0.82 0.82 Copyright © 2012 SciRes. JSSM  Bank Branch Grouping Strategy, an Unusual DEA Application 361 ficient units. After the removal of these “rural” bran- ches and “peeled” units the results are shown in Table 5. Eleven branches that were considered inefficient previ- ously became efficient under the new model, but the percentage of efficient units in the overall branch net- work remained consistent with the previous analysis. In addition, the averag e efficiency score did not change sig- nificantly for each peer group as well as for the overall network. 4.2. Peer Group Referencing Since the study aims to examine branches with similar operating practices, only references of λ > 0.2 were in- cluded in the analysis, and self-referencing efficient branches were excluded. A summary of the percentages of inefficient branches referencing efficient branches broken down by the Bank’s current peer groups is shown in Tabl e 6 [11]. Most peer groups (with the exception of C and G) exhibit relatively low percentages of within group references suggesting that there may be a high degree of variability within the group’s operating envi- ronment—an indication that the Bank’s current grouping strategy may not be optimal. All of the Bank’s peer groups frequently referenced units in groups C and G. Branches in large communities (A, B, C) referenced the efficient branches in the large residential communities o f group C at a higher frequency, while the branches in the smaller communities (D, E, F, G) refer enced both the efficient branches in group C and the efficient branches in the small rural communities of group G at a higher frequency. Group C with the largest total number of branches (376) and the highest number of efficient branches (25 out of a total of 74) represents a diverse set of peers with various operating characteristics causing them to be benchmarked by many branches in other peer groups. While group G has the second small- est number of total branches, it does have the second highest number of efficient branches, and the highest percentage of efficient branches, as branches from group G are generally small branches operating in small rural communities with small populations. Branches operating in these environments often have advantageous operating conditions such as lower staff turnover rates and im- proved long term relationships with customers. These observations are consistent with the DEA study of the retail branch network of a large Canadian Bank conducted by Schaffnit, Rosen and Paradi [5] where they found that small community branches were the most ef- ficient among all peer groups. But while group G does operate in an advantageous environment, excluding peer group G from the study produced only small improve- ments in the within group references rates and did not lead to a big change in the referencing patterns. Further analysis was performed by combining groups Table 5. Efficiency score analysis for all peer groups excluding “G”. Peer Groups A B C D E F Total No. of Branches in group 29 92 376 129 141 113 880 No. of Efficient DMUs 4 7 29 6 6 14 66 % of Efficient DMUs (excluding “G”) 14% 8% 8% 5% 4% 12% 7.5% % of Efficient DMUS with all groups 14% 6% 7% 5% 3% 8% 7.6% Average Efficiency 0.78 0.82 0.83 0.81 0.79 0.83 0.82 Table 6. Percent of inefficient branches referencing efficient branches. Efficient Peers A B C D E F G A 10% 22% 43% 0% 8% 0% 16% B 2% 15% 51% 1% 7% 2% 22% C 3% 17% 48% 3% 11% 3% 15% D 1% 18% 28% 8% 18% 3% 22% E 5% 25% 24% 2% 19% 1% 23% F 0% 7% 28% 2% 28% 8% 26% Inefficient DMUs G 0% 5% 24% 2% 6% 6% 56% Copyright © 2012 SciRes. JSSM  Bank Branch Grouping Strategy, an Unusual DEA Application 362 of branches that o perate in similar community sizes. The combined peer groups are shown in Table 7 [11]. While these combined groups improved the within group refer- encing as evidenced by comparing the results from Ta- bles 6 and 7, there is still a significant percentage of out- of-group references. The model results therefore show that branches with similar operating characteristics do not necessarily operate in the same community settings and suggest that other factors are influential in determin- ing peer grouping strategies . 4.3. The Grouping Strategy The solution proposed to the Bank is to create custom- ized peer groups for each inefficient branch. While all efficient references can be provided for each branch, it is more effective to form smaller peer groups consisting of the largest λ values since the larger the λ value is, the more similar the inefficient branch is to the efficient branch it references. To make the peer groups consistent and easy to understand and analyze the recommendations is to provide for each inefficient branch a list of their top 3 efficient reference branches for benchmarking purposes. Using this approach only 3% of the inefficient branches had all 3 of their top references in the same peer group; only 17% of the inefficient branches referenced 2 out of 3 branches from same peer group, and for 40% of the inefficient branches only 1 out of 3 of their top refer- ences came from the same peer group. Finally, 40% of the inefficient branches had all 3 of their top references come from outside their own peer group. Since the references produced by DEA are based on operational similarities, it can therefore be seen that the Bank’s current grouping strategy fails to cluster opera- tionally similar branches into the same peer groups, and benchmarking using the Bank’s currently used grouping strategy will lead to inappropriate comparisons between branches and misguided performance improvement tar- gets. 4.4. Other Factors That Could Affect Peer Groups The customized grouping approach is helpful in distin- guishing characteristics correlated to performance, since Table 7. References within groups of branches that operate in similar community sizes. Clustered Peer Groups References within Clustered Peer Groups Large A, B, C 68% Medium D, E 24% Small F 8% Very small rural G 56% the model completes a comprehensive analysis to form peer groups. Nevertheless, there are other factors that may exploit the multidimensional modeling capability of DEA, such as: staff experience, demographics, location and competition to name a few. Clearly, these factors have influence on performance, but data is almost never available to address these questions. Staff experience could be measured as the length of employment and training levels received. More experi- enced staff may have better developed skills or may be more familiar with customer needs which tend to in- crease efficiency (rural branches). On the other hand, branches experiencing relatively high turnover as com- pared to other peers may require more time and effort to train the new employees, thus differentiating these bran- ches (large urban locations). But such data was no t avail- able to us, nor is it likely to be released even if the Bank had it, citing privacy issues. Canada has a comprehensive database of census in- formation that is publicly available. Using this data, we could try to understand which, if any, demographic fac- tors have significant effects on branch productivity. For example, transactions may be completed more efficiently if barriers to communication are minimized—Canada is a highly multi-cultural society with a significant number of residents with poor or non-existent comman d of the Eng- lish language1. In fact, the Bank can and does staff the branches to meet local language needs, but this does not solve the whole problem. Another factor may be related to usage of online resources (e.g. Web Banking) which would be difficult for computer illiterate customers, who then will go to the branch and create additional transac- tions. Bank branches located within readily accessible facili- ties might not be a good comparison for those that are not centrally located. Branches located in shopping centres, for example, may service more inter-bank2 customers as compared to less accessible branches. Operating charac- teristics are often influenced by the customer mix and accessibility of the branch. Peer groups may also be formed using local competi- tion intensity or lack thereof as parameters. If there is relatively less competition, there may be more opportun i- ties for new account activities since customers do not have the option to bank with other financial institutions. As a result, such branches may inherently have an ad- vantage in increasing their sales outputs to make them more efficient. 1This does not imply that branches in neighborhoods that are not pre- dominantly English speaking are nece ss ar il y le ss e fficient. 2Inter- ank customers are customers who do not have an account at the Bank. Process times are longer for these customers for due-diligence and a rovals re ired for identit verification. Copyright © 2012 SciRes. JSSM  Bank Branch Grouping Strategy, an Unusual DEA Application 363 5. Conclusions In today’s competitive banking environment operational efficiency of the Bank’s branch network is critical to its success. Branch performance is often difficult to evaluate, primarily due to the complexity of their operations. To evaluate operational (not profitability, etc.) branch effi- ciency, the Bank must first cluster them into meaningful peer groups so that branches could be compared and evaluated against each other in a clearly fair and equita- ble manner. This study evaluated the current grouping methodology employed by the Bank, which is based on community type and population size. The bank branches’ peer groups were compared to the reference sets pro- duced by the input oriented DEA BCC production model that used personnel FTE levels as inputs and customer transactions as outputs. A peeling algorithm was used to eliminate potential outliers. This approach was conservatively applied in order to avoid the elimination of good reference DMUs that the inefficient branches could learn from. It is re- commended that the Bank review the data for every po- tential outlier iden tified through the peeling procedure to determine if it is, in fact, an outlier. The potential outlier identification thresholds could be lowered further to identify a larger group of potential outliers for the Bank to review. The analyses based on the DEA results indicated that most of the efficient branches being referenced came from outside of the inefficient branches’ peer groups as those were defined by the Bank, suggesting that opera- tional similarity is not generally related to community type and population size. This result suggests that there may be a high degree of variability within the Bank de- fined peer groups’ operating environments, and that op- erational similarities exist between branches across peer groups leading to cross referencing at high frequencies. The small rural community branches of group G were referenced by the highest percentage of inefficient units in other peer groups relative to the total number of branches in group G, as group G exhibits unique operat- ing conditions such as lower staff turn over rates and long term customer relationships. A subsequent analysis was performed to examine possible bias introduced into the model by the group G branches, but the model with- out the rural group G branches exhibited the same trends as the model using the entire dataset showing a high fre- quency of out-of-group referencing again suggesting that branches in different peer groups might, in fact, share comparable and similar operational characteristics. Using the DEA model’s results, it is recommended that for each inefficient branch a customized peer group be identified consisting of its top 3 references based on the highest λ values. Consistent with the Bank’s goal of having a truly comprehensive grouping strategy, the proposed model captures the combined effects of various inputs and outpu ts not readily iden tifiable with its current grouping strategy. This approach yields a set of fair and equitable groups that compare inefficient branches to their most operationally similar efficient peers. By pro- viding up to 3 unique, best practice efficient peers for each inefficient branch, meaningful comparisons can be made to identify the best practices that could be imple- mented by the inefficient branches to improve their per- formance. This approach is intuitiv e and simple for Bank staff to adopt, thus increasing the probability of a suc- cessful implementation. Additional research and a review of the results by the Bank is required in order to ensure that the references are valid and that no unaccounted for advantages exist caus- ing some branches to appear to be artificially efficient. Should such factors exist, the Bank should provide the relevant data so that these factors could be accounted for in the model. REFERENCES [1] J. C. Paradi and C. Schaffnit, “Commercial Branch Per- formance Evaluation and Results Communication in a Canadian Bank—A DEA Application,” European Jour- nal of Operational Research, Vol. 156, No. 3, 2004, pp. 719-735. doi:10.1016/S0377-2217(03)00108-5 [2] J. C. Paradi, S. Vela and Z. Yang, “Assessing Bank and Bank Branch Performance: Modeling Considerations and Approaches,” In: W. W. Cooper, L. M. Seiford and J. Zhu, Eds., Handbook on Data Envelopment Analysis, Kluwer Academic Publishers, Boston, 2004, pp. 349-400. [3] D. McEachern and J. C. Paradi, “Intra- and Inter-Country Bank Branch Performance Assessment Usi ng DEA,” Jour- nal of Productivity Analysis, Vol. 27, No. 2, 2007, pp. 123- 136. doi:10.1007/s11123-006-0029-z [4] Z. J. Yang and J. C. Paradi, “Crossfirm Bank Branch Benchmarking Using ‘Handicapped’ Data Envelopment Analysis to Adjust for Corporate Strategic Effects,” Pro- ceedings of the 39th Hawaii International Conference on System Sciences, Kauai, 4-7 January 2006. [5] C. Schaffnit, D. Rosen and J. C. Paradi, “Best Practice Analysis of Bank Branches: An Application of DEA in a Large Canadian Bank,” European Journal of Operational Research, Vol. 98, No. 2, 1997, pp. 269-289. doi:10.1016/S0377-2217(96)00347-5 [6] Canadian Bankers Association, “Our Industry,” 2006. http://www.cba.ca/en/industry.asp [7] W. W. Cooper, L. M. Seiford and K. Tone, “Data Envel- opment Analysis: A Comprehensive Text with Models, Applications, References, and DEA-Solver Software,” Kluwer Academic Publishers, Boston, 2000. [8] A. Charnes, W. W. Cooper and E. L. Rhodes, “Measuring the Efficiency of Decision Making Units,” European Jour- nal of Operational Research, Vol. 2, No. 6, 1978, pp. 429- 444. doi:10.1016/0377-2217(78)90138-8 [9] R. D. Banker, A. Charnes and W. W. Cooper, “Some Copyright © 2012 SciRes. JSSM  Bank Branch Grouping Strategy, an Unusual DEA Application Copyright © 2012 SciRes. JSSM 364 Models for Estimating Technical and Scale Inefficiencies in Data Envelopment Analysis,” Management Science, Vol. 30, No. 9, 1984, pp. 1078-1092. doi:10.1287/mnsc.30.9.1078 [10] H. D. Sherman and F. Gold, “Bank Branch Operating Ef- ficiency: Evaluation with Data Envelopment Analysis,” Journal of Banking and Finance, Vol. 9, No. 2, 1985, pp. 297-316. doi:10.1016/0378-4266(85)90025-1 [11] P. Yom and A. Wu, “Bank Branch Logical Grouping Strategy,” BASc Thesis, University of Toronto, Toronto, 2006. [12] Statistics Canada, “1996 Community Profiles,” 1996 Census, 1999. http://www12.statcan.ca/english/profil/PlaceSearchForm1 .cfm?LANG=E [13] Statistics Canada, “2001 Community Profiles,” 2001 Census, 2001. http://www12.statcan.ca/english/profil01/CP01/Index.cfm ?Lang=E [14] Statistics Canada, “2006 Community Profiles,” 2006 Census, 2007. http://www12.statcan.ca/english/census06/data/profiles/co mmunity/Index.cfm?Lang=E [15] E. Thanassoulis, “Assessing Police Forces in England and Wales Using Data Envelopment Analysis,” European Jour- nal of Operational Research, Vol. 87, No. 3, 1995, pp. 641-657. doi:10.1016/0377-2217(95)00236-7 [16] J. D. Divine, “Efficiency Analysis and Management of Not for Profit and Governmentally Regulated Organiza- tions,” Ph.D. Thesis, University of Texas, Austin, 1986. [17] E. Thanassoulis, “Setting Achievements Target s for School Children,” Education Economics, Vol. 7, No. 2, 1999, pp. 101-119. doi:10.1080/09645299900000010
|