Paper Menu >>
Journal Menu >>
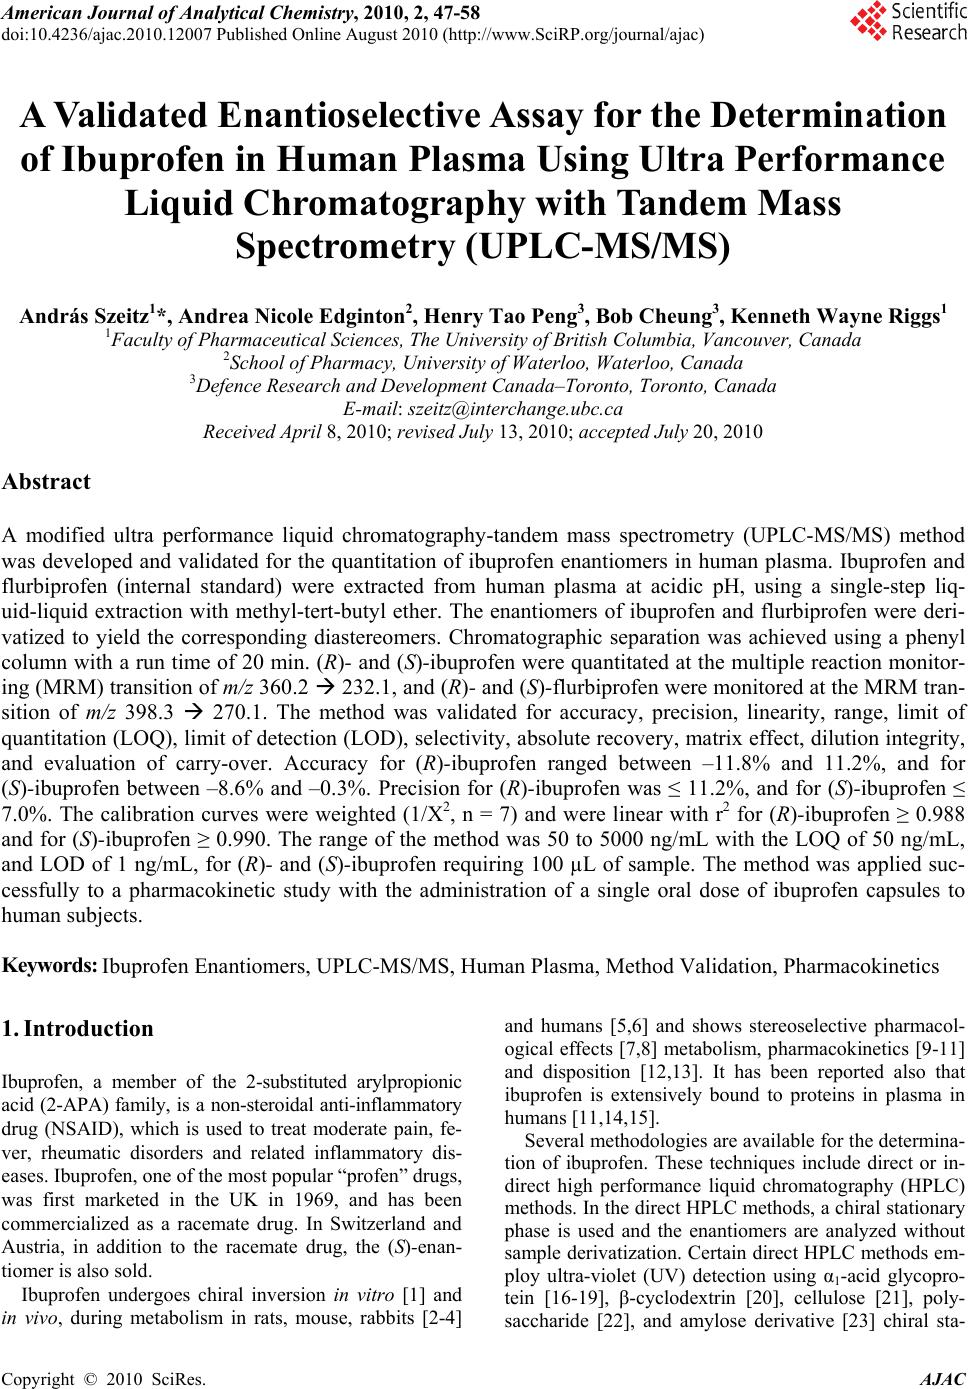 American Journal of Analytical Chemistry, 2010, 2, 47-58 doi:10.4236/ajac.2010.12007 Published Online August 2010 (http://www.SciRP.org/journal/ajac) Copyright © 2010 SciRes. AJAC A Validated Enantioselective Assay for the Determination of Ibuprofen in Human Plasma Using Ultra Performance Liquid Chromatography with Tandem Mass Spectrometry (UPLC-MS/MS) András Szeitz1*, Andrea Nicole Edginton2, Henry Tao Peng3, Bob Cheung3, Kenneth Wayne Riggs1 1Faculty of Pharmaceutical Sciences, The University of British Columbia, Vancouver, Canada 2School of Pharmacy, University of Waterloo, Waterloo, Canada 3Defence Research and Development Canada–Toronto, Toronto, Canada E-mail: szeitz@interchange.ubc.ca Received April 8, 2010; revised July 13, 2010; accepted July 20, 2010 Abstract A modified ultra performance liquid chromatography-tandem mass spectrometry (UPLC-MS/MS) method was developed and validated for the quantitation of ibuprofen enantiomers in human plasma. Ibuprofen and flurbiprofen (internal standard) were extracted from human plasma at acidic pH, using a single-step liq- uid-liquid extraction with methyl-tert-butyl ether. The enantiomers of ibuprofen and flurbiprofen were deri- vatized to yield the corresponding diastereomers. Chromatographic separation was achieved using a phenyl column with a run time of 20 min. (R)- and (S)-ibuprofen were quantitated at the multiple reaction monitor- ing (MRM) transition of m/z 360.2 232.1, and (R)- and (S)-flurbiprofen were monitored at the MRM tran- sition of m/z 398.3 270.1. The method was validated for accuracy, precision, linearity, range, limit of quantitation (LOQ), limit of detection (LOD), selectivity, absolute recovery, matrix effect, dilution integrity, and evaluation of carry-over. Accuracy for (R)-ibuprofen ranged between –11.8% and 11.2%, and for (S)-ibuprofen between –8.6% and –0.3%. Precision for (R)-ibuprofen was ≤ 11.2%, and for (S)-ibuprofen ≤ 7.0%. The calibration curves were weighted (1/X2, n = 7) and were linear with r2 for (R)-ibuprofen ≥ 0.988 and for (S)-ibuprofen ≥ 0.990. The range of the method was 50 to 5000 ng/mL with the LOQ of 50 ng/mL, and LOD of 1 ng/mL, for (R)- and (S)-ibuprofen requiring 100 µL of sample. The method was applied suc- cessfully to a pharmacokinetic study with the administration of a single oral dose of ibuprofen capsules to human subjects. Keywords: Ibuprofen Enantiomers, UPLC-MS/MS, Human Plasma, Method Validation, Pharmacokinetics 1. Introduction Ibuprofen, a member of the 2-substituted arylpropionic acid (2-APA) family, is a non-steroidal anti-inflammatory drug (NSAID), which is used to treat moderate pain, fe- ver, rheumatic disorders and related inflammatory dis- eases. Ibuprofen, one of the most popular “profen” drugs, was first marketed in the UK in 1969, and has been commercialized as a racemate drug. In Switzerland and Austria, in addition to the racemate drug, the (S)-enan- tiomer is also sold. Ibuprofen undergoes chiral inversion in vitro [1] and in vivo, during metabolism in rats, mouse, rabbits [2-4] and humans [5,6] and shows stereoselective pharmacol- ogical effects [7,8] metabolism, pharmacokinetics [9-11] and disposition [12,13]. It has been reported also that ibuprofen is extensively bound to proteins in plasma in humans [11,14,15]. Several methodologies are available for the determina- tion of ibuprofen. These techniques include direct or in- direct high performance liquid chromatography (HPLC) methods. In the direct HPLC methods, a chiral stationary phase is used and the enantiomers are analyzed without sample derivatization. Certain direct HPLC methods em- ploy ultra-violet (UV) detection using α1-acid glycopro- tein [16-19], β-cyclodextrin [20], cellulose [21], poly- saccharide [22], and amylose derivative [23] chiral sta- 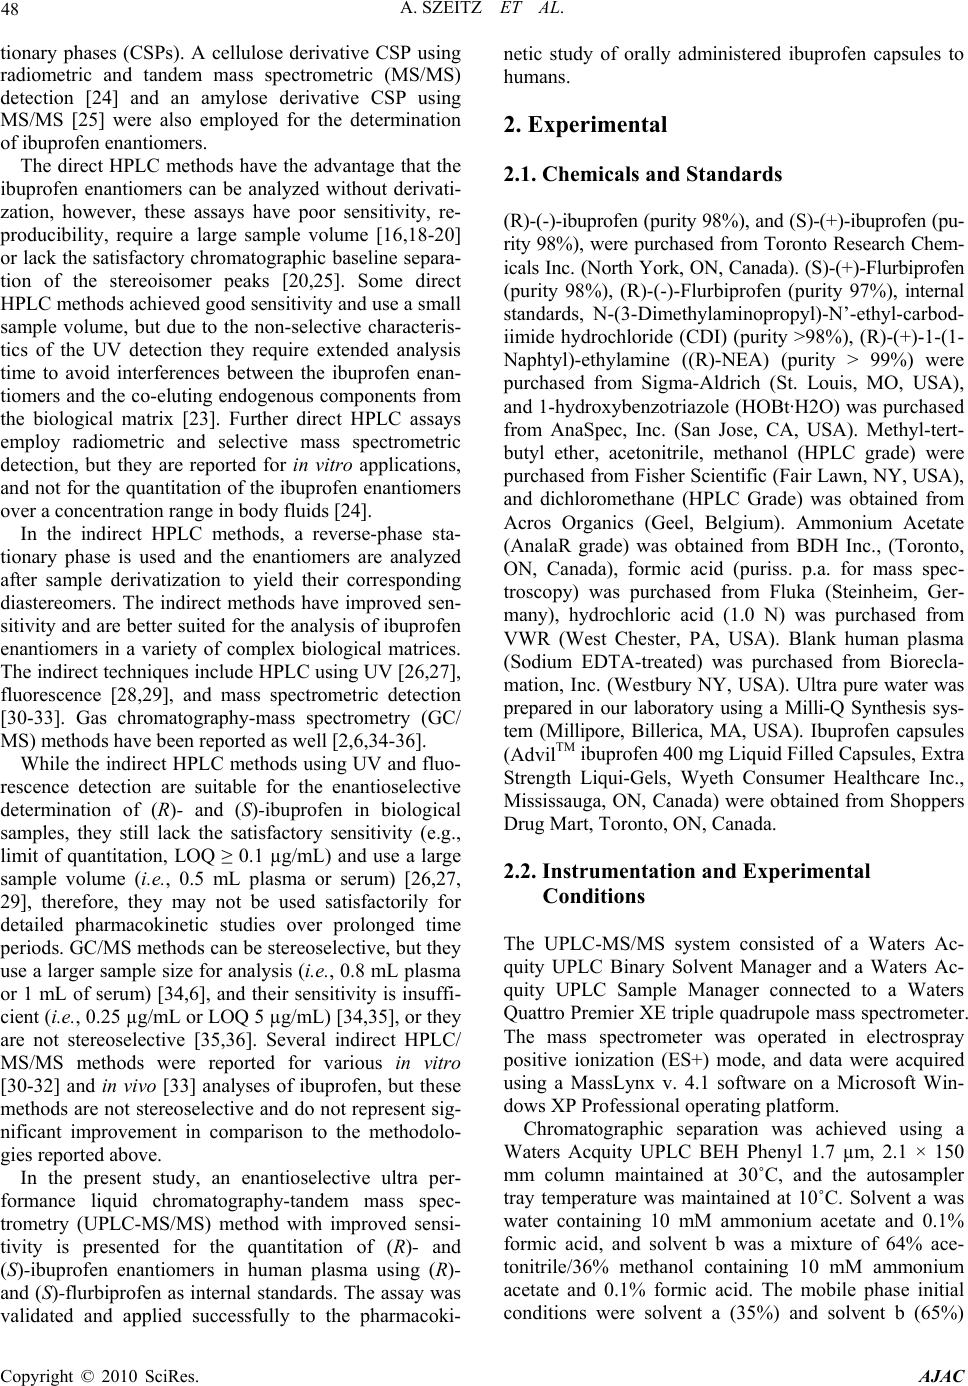 48 A. SZEITZ ET AL. tionary phases (CSPs). A cellulose derivative CSP using radiometric and tandem mass spectrometric (MS/MS) detection [24] and an amylose derivative CSP using MS/MS [25] were also employed for the determination of ibuprofen enantiomers. The direct HPLC methods have the advantage that the ibuprofen enantiomers can be analyzed without derivati- zation, however, these assays have poor sensitivity, re- producibility, require a large sample volume [16,18-20] or lack the satisfactory chromatographic baseline separa- tion of the stereoisomer peaks [20,25]. Some direct HPLC methods achieved good sensitivity and use a small sample volume, but due to the non-selective characteris- tics of the UV detection they require extended analysis time to avoid interferences between the ibuprofen enan- tiomers and the co-eluting endogenous components from the biological matrix [23]. Further direct HPLC assays employ radiometric and selective mass spectrometric detection, but they are reported for in vitro applications, and not for the quantitation of the ibuprofen enantiomers over a concentration range in body fluids [24]. In the indirect HPLC methods, a reverse-phase sta- tionary phase is used and the enantiomers are analyzed after sample derivatization to yield their corresponding diastereomers. The indirect methods have improved sen- sitivity and are better suited for the analysis of ibuprofen enantiomers in a variety of complex biological matrices. The indirect techniques include HPLC using UV [26,27], fluorescence [28,29], and mass spectrometric detection [30-33]. Gas chromatography-mass spectrometry (GC/ MS) methods have been reported as well [2,6,34-36]. While the indirect HPLC methods using UV and fluo- rescence detection are suitable for the enantioselective determination of (R)- and (S)-ibuprofen in biological samples, they still lack the satisfactory sensitivity (e.g., limit of quantitation, LOQ ≥ 0.1 µg/mL) and use a large sample volume (i.e., 0.5 mL plasma or serum) [26,27, 29], therefore, they may not be used satisfactorily for detailed pharmacokinetic studies over prolonged time periods. GC/MS methods can be stereoselective, but they use a larger sample size for analysis (i.e., 0.8 mL plasma or 1 mL of serum) [34,6], and their sensitivity is insuffi- cient (i.e., 0.25 µg/mL or LOQ 5 µg/mL) [34,35], or they are not stereoselective [35,36]. Several indirect HPLC/ MS/MS methods were reported for various in vitro [30-32] and in vivo [33] analyses of ibuprofen, but these methods are not stereoselective and do not represent sig- nificant improvement in comparison to the methodolo- gies reported above. In the present study, an enantioselective ultra per- formance liquid chromatography-tandem mass spec- trometry (UPLC-MS/MS) method with improved sensi- tivity is presented for the quantitation of (R)- and (S)-ibuprofen enantiomers in human plasma using (R)- and (S)-flurbiprofen as internal standards. The assay was validated and applied successfully to the pharmacoki- netic study of orally administered ibuprofen capsules to humans. 2. Experimental 2.1. Chemicals and Standards (R)-(-)-ibuprofen (purity 98%), and (S)-(+)-ibuprofen (pu- rity 98%), were purchased from Toronto Research Chem- icals Inc. (North York, ON, Canada). (S)-(+)-Flurbiprofen (purity 98%), (R)-(-)-Flurbiprofen (purity 97%), internal standards, N-(3-Dimethylaminopropyl)-N’-ethyl-carbod- iimide hydrochloride (CDI) (purity >98%), (R)-(+)-1-(1- Naphtyl)-ethylamine ((R)-NEA) (purity > 99%) were purchased from Sigma-Aldrich (St. Louis, MO, USA), and 1-hydroxybenzotriazole (HOBt·H2O) was purchased from AnaSpec, Inc. (San Jose, CA, USA). Methyl-tert- butyl ether, acetonitrile, methanol (HPLC grade) were purchased from Fisher Scientific (Fair Lawn, NY, USA), and dichloromethane (HPLC Grade) was obtained from Acros Organics (Geel, Belgium). Ammonium Acetate (AnalaR grade) was obtained from BDH Inc., (Toronto, ON, Canada), formic acid (puriss. p.a. for mass spec- troscopy) was purchased from Fluka (Steinheim, Ger- many), hydrochloric acid (1.0 N) was purchased from VWR (West Chester, PA, USA). Blank human plasma (Sodium EDTA-treated) was purchased from Biorecla- mation, Inc. (Westbury NY, USA). Ultra pure water was prepared in our laboratory using a Milli-Q Synthesis sys- tem (Millipore, Billerica, MA, USA). Ibuprofen capsules (AdvilTM ibuprofen 400 mg Liquid Filled Capsules, Extra Strength Liqui-Gels, Wyeth Consumer Healthcare Inc., Mississauga, ON, Canada) were obtained from Shoppers Drug Mart, Toronto, ON, Canada. 2.2. Instrumentation and Experimental Conditions The UPLC-MS/MS system consisted of a Waters Ac- quity UPLC Binary Solvent Manager and a Waters Ac- quity UPLC Sample Manager connected to a Waters Quattro Premier XE triple quadrupole mass spectrometer. The mass spectrometer was operated in electrospray positive ionization (ES+) mode, and data were acquired using a MassLynx v. 4.1 software on a Microsoft Win- dows XP Professional operating platform. Chromatographic separation was achieved using a Waters Acquity UPLC BEH Phenyl 1.7 µm, 2.1 × 150 mm column maintained at 30˚C, and the autosampler tray temperature was maintained at 10˚C. Solvent a was water containing 10 mM ammonium acetate and 0.1% formic acid, and solvent b was a mixture of 64% ace- tonitrile/36% methanol containing 10 mM ammonium acetate and 0.1% formic acid. The mobile phase initial conditions were solvent a (35%) and solvent b (65%) Copyright © 2010 SciRes. AJAC 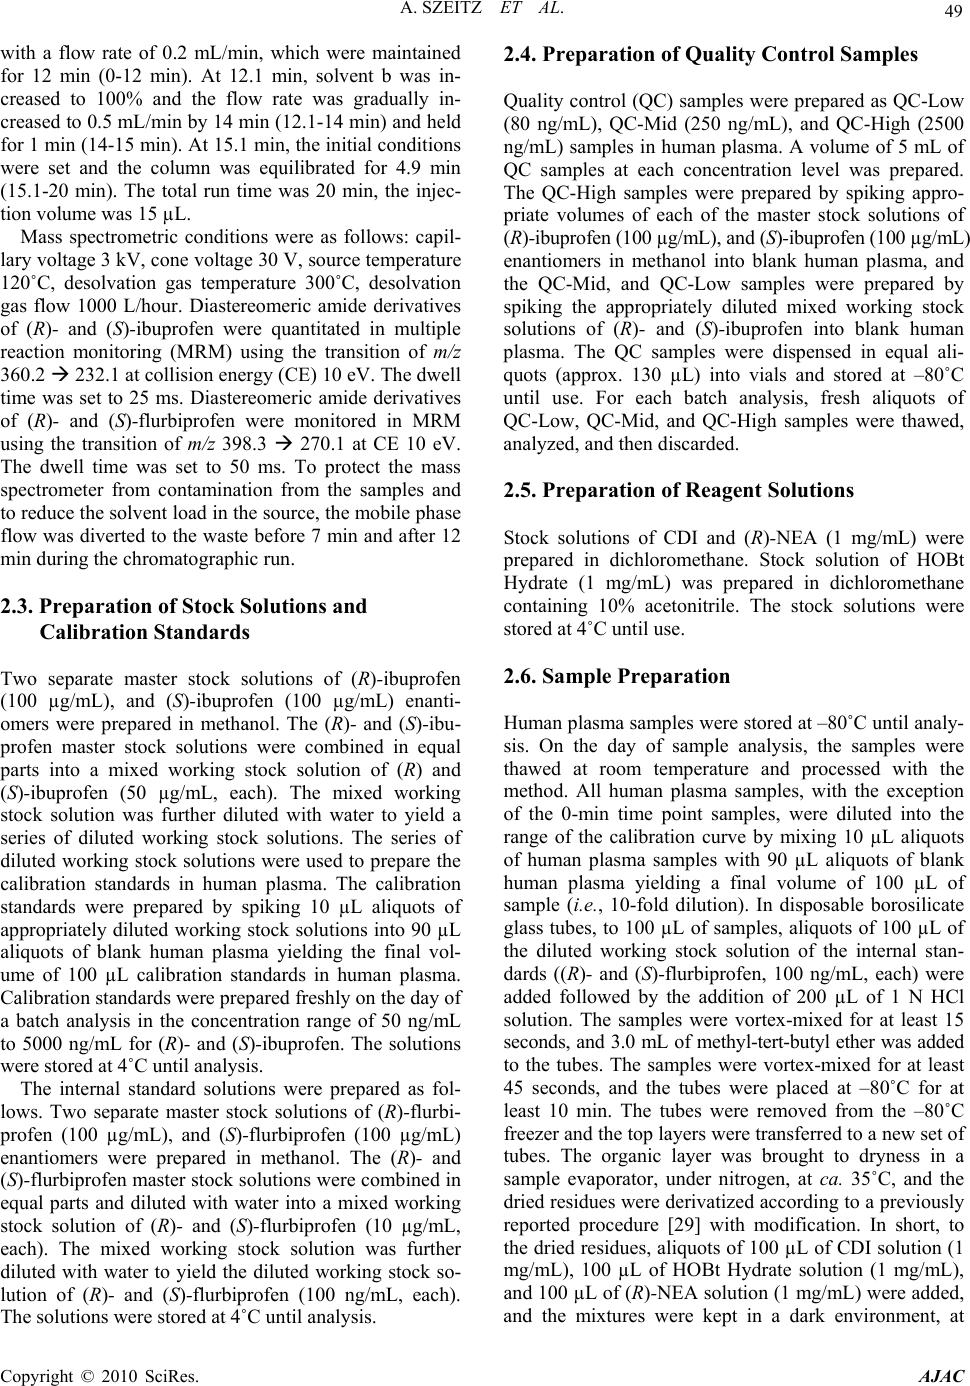 A. SZEITZ ET AL. 49 with a flow rate of 0.2 mL/min, which were maintained for 12 min (0-12 min). At 12.1 min, solvent b was in- creased to 100% and the flow rate was gradually in- creased to 0.5 mL/min by 14 min (12.1-14 min) and held for 1 min (14-15 min). At 15.1 min, the initial conditions were set and the column was equilibrated for 4.9 min (15.1-20 min). The total run time was 20 min, the injec- tion volume was 15 µL. Mass spectrometric conditions were as follows: capil- lary voltage 3 kV, cone voltage 30 V, source temperature 120˚C, desolvation gas temperature 300˚C, desolvation gas flow 1000 L/hour. Diastereomeric amide derivatives of (R)- and (S)-ibuprofen were quantitated in multiple reaction monitoring (MRM) using the transition of m/z 360.2 232.1 at collision energy (CE) 10 eV. The dwell time was set to 25 ms. Diastereomeric amide derivatives of (R)- and (S)-flurbiprofen were monitored in MRM using the transition of m/z 398.3 270.1 at CE 10 eV. The dwell time was set to 50 ms. To protect the mass spectrometer from contamination from the samples and to reduce the solvent load in the source, the mobile phase flow was diverted to the waste before 7 min and after 12 min during the chromatographic run. 2.3. Preparation of Stock Solutions and Calibration Standards Two separate master stock solutions of (R)-ibuprofen (100 µg/mL), and (S)-ibuprofen (100 µg/mL) enanti- omers were prepared in methanol. The (R)- and (S)-ibu- profen master stock solutions were combined in equal parts into a mixed working stock solution of (R) and (S)-ibuprofen (50 µg/mL, each). The mixed working stock solution was further diluted with water to yield a series of diluted working stock solutions. The series of diluted working stock solutions were used to prepare the calibration standards in human plasma. The calibration standards were prepared by spiking 10 µL aliquots of appropriately diluted working stock solutions into 90 µL aliquots of blank human plasma yielding the final vol- ume of 100 µL calibration standards in human plasma. Calibration standards were prepared freshly on the day of a batch analysis in the concentration range of 50 ng/mL to 5000 ng/mL for (R)- and (S)-ibuprofen. The solutions were stored at 4˚C until analysis. The internal standard solutions were prepared as fol- lows. Two separate master stock solutions of (R)-flurbi- profen (100 µg/mL), and (S)-flurbiprofen (100 µg/mL) enantiomers were prepared in methanol. The (R)- and (S)-flurbiprofen master stock solutions were combined in equal parts and diluted with water into a mixed working stock solution of (R)- and (S)-flurbiprofen (10 µg/mL, each). The mixed working stock solution was further diluted with water to yield the diluted working stock so- lution of (R)- and (S)-flurbiprofen (100 ng/mL, each). The solutions were stored at 4˚C until analysis. 2.4. Preparation of Quality Control Samples Quality control (QC) samples were prepared as QC-Low (80 ng/mL), QC-Mid (250 ng/mL), and QC-High (2500 ng/mL) samples in human plasma. A volume of 5 mL of QC samples at each concentration level was prepared. The QC-High samples were prepared by spiking appro- priate volumes of each of the master stock solutions of (R)-ibuprofen (100 µg/mL), and (S)-ibuprofen (100 µg/mL) enantiomers in methanol into blank human plasma, and the QC-Mid, and QC-Low samples were prepared by spiking the appropriately diluted mixed working stock solutions of (R)- and (S)-ibuprofen into blank human plasma. The QC samples were dispensed in equal ali- quots (approx. 130 µL) into vials and stored at –80˚C until use. For each batch analysis, fresh aliquots of QC-Low, QC-Mid, and QC-High samples were thawed, analyzed, and then discarded. 2.5. Preparation of Reagent Solutions Stock solutions of CDI and (R)-NEA (1 mg/mL) were prepared in dichloromethane. Stock solution of HOBt Hydrate (1 mg/mL) was prepared in dichloromethane containing 10% acetonitrile. The stock solutions were stored at 4˚C until use. 2.6. Sample Preparation Human plasma samples were stored at –80˚C until analy- sis. On the day of sample analysis, the samples were thawed at room temperature and processed with the method. All human plasma samples, with the exception of the 0-min time point samples, were diluted into the range of the calibration curve by mixing 10 µL aliquots of human plasma samples with 90 µL aliquots of blank human plasma yielding a final volume of 100 µL of sample (i.e., 10-fold dilution). In disposable borosilicate glass tubes, to 100 µL of samples, aliquots of 100 µL of the diluted working stock solution of the internal stan- dards ((R)- and (S)-flurbiprofen, 100 ng/mL, each) were added followed by the addition of 200 µL of 1 N HCl solution. The samples were vortex-mixed for at least 15 seconds, and 3.0 mL of methyl-tert-butyl ether was added to the tubes. The samples were vortex-mixed for at least 45 seconds, and the tubes were placed at –80˚C for at least 10 min. The tubes were removed from the –80˚C freezer and the top layers were transferred to a new set of tubes. The organic layer was brought to dryness in a sample evaporator, under nitrogen, at ca. 35˚C, and the dried residues were derivatized according to a previously reported procedure [29] with modification. In short, to the dried residues, aliquots of 100 µL of CDI solution (1 mg/mL), 100 µL of HOBt Hydrate solution (1 mg/mL), and 100 µL of (R)-NEA solution (1 mg/mL) were added, and the mixtures were kept in a dark environment, at Copyright © 2010 SciRes. AJAC 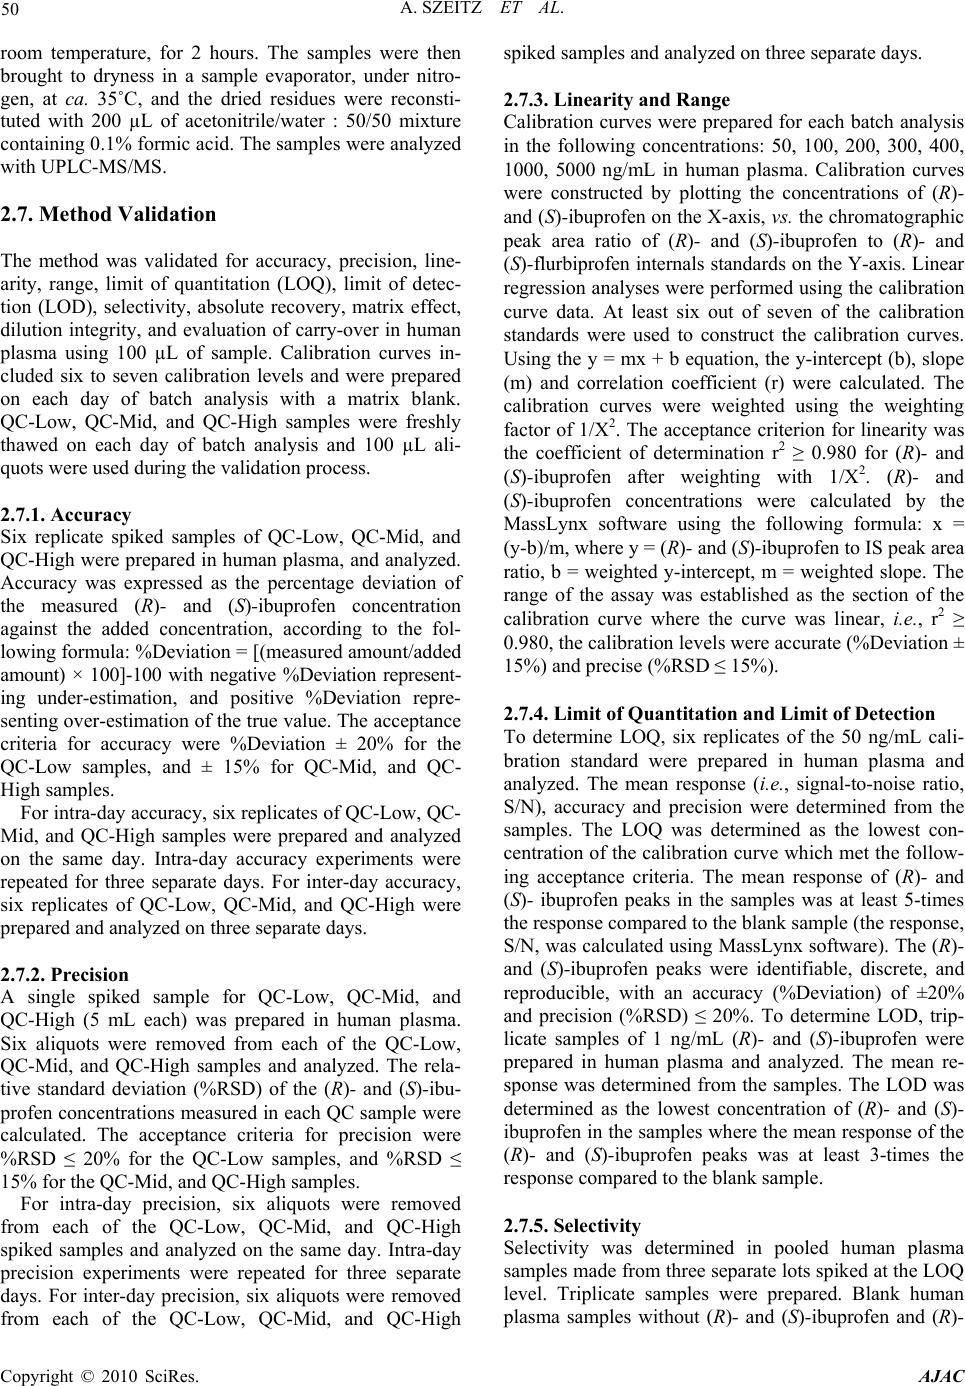 50 A. SZEITZ ET AL. room temperature, for 2 hours. The samples were then brought to dryness in a sample evaporator, under nitro- gen, at ca. 35˚C, and the dried residues were reconsti- tuted with 200 µL of acetonitrile/water : 50/50 mixture containing 0.1% formic acid. The samples were analyzed with UPLC-MS/MS. 2.7. Method Validation The method was validated for accuracy, precision, line- arity, range, limit of quantitation (LOQ), limit of detec- tion (LOD), selectivity, absolute recovery, matrix effect, dilution integrity, and evaluation of carry-over in human plasma using 100 µL of sample. Calibration curves in- cluded six to seven calibration levels and were prepared on each day of batch analysis with a matrix blank. QC-Low, QC-Mid, and QC-High samples were freshly thawed on each day of batch analysis and 100 µL ali- quots were used during the validation process. 2.7.1. Accuracy Six replicate spiked samples of QC-Low, QC-Mid, and QC-High were prepared in human plasma, and analyzed. Accuracy was expressed as the percentage deviation of the measured (R)- and (S)-ibuprofen concentration against the added concentration, according to the fol- lowing formula: %Deviation = [(measured amount/added amount) × 100]-100 with negative %Deviation represent- ing under-estimation, and positive %Deviation repre- senting over-estimation of the true value. The acceptance criteria for accuracy were %Deviation ± 20% for the QC-Low samples, and ± 15% for QC-Mid, and QC- High samples. For intra-day accuracy, six replicates of QC-Low, QC- Mid, and QC-High samples were prepared and analyzed on the same day. Intra-day accuracy experiments were repeated for three separate days. For inter-day accuracy, six replicates of QC-Low, QC-Mid, and QC-High were prepared and analyzed on three separate days. 2.7.2. Precision A single spiked sample for QC-Low, QC-Mid, and QC-High (5 mL each) was prepared in human plasma. Six aliquots were removed from each of the QC-Low, QC-Mid, and QC-High samples and analyzed. The rela- tive standard deviation (%RSD) of the (R)- and (S)-ibu- profen concentrations measured in each QC sample were calculated. The acceptance criteria for precision were %RSD ≤ 20% for the QC-Low samples, and %RSD ≤ 15% for the QC-Mid, and QC-High samples. For intra-day precision, six aliquots were removed from each of the QC-Low, QC-Mid, and QC-High spiked samples and analyzed on the same day. Intra-day precision experiments were repeated for three separate days. For inter-day precision, six aliquots were removed from each of the QC-Low, QC-Mid, and QC-High spiked samples and analyzed on three separate days. 2.7.3. Linearity and Range Calibration curves were prepared for each batch analysis in the following concentrations: 50, 100, 200, 300, 400, 1000, 5000 ng/mL in human plasma. Calibration curves were constructed by plotting the concentrations of (R)- and (S)-ibuprofen on the X-axis, vs. the chromatographic peak area ratio of (R)- and (S)-ibuprofen to (R)- and (S)-flurbiprofen internals standards on the Y-axis. Linear regression analyses were performed using the calibration curve data. At least six out of seven of the calibration standards were used to construct the calibration curves. Using the y = mx + b equation, the y-intercept (b), slope (m) and correlation coefficient (r) were calculated. The calibration curves were weighted using the weighting factor of 1/X2. The acceptance criterion for linearity was the coefficient of determination r2 ≥ 0.980 for (R)- and (S)-ibuprofen after weighting with 1/X2. (R)- and (S)-ibuprofen concentrations were calculated by the MassLynx software using the following formula: x = (y-b)/m, where y = (R)- and (S)-ibuprofen to IS peak area ratio, b = weighted y-intercept, m = weighted slope. The range of the assay was established as the section of the calibration curve where the curve was linear, i.e., r2 ≥ 0.980, the calibration levels were accurate (%Deviation ± 15%) and precise (%RSD ≤ 15%). 2.7.4. Limit of Quantitation and Limit of Detection To determine LOQ, six replicates of the 50 ng/mL cali- bration standard were prepared in human plasma and analyzed. The mean response (i.e., signal-to-noise ratio, S/N), accuracy and precision were determined from the samples. The LOQ was determined as the lowest con- centration of the calibration curve which met the follow- ing acceptance criteria. The mean response of (R)- and (S)- ibuprofen peaks in the samples was at least 5-times the response compared to the blank sample (the response, S/N, was calculated using MassLynx software). The (R)- and (S)-ibuprofen peaks were identifiable, discrete, and reproducible, with an accuracy (%Deviation) of ±20% and precision (%RSD) ≤ 20%. To determine LOD, trip- licate samples of 1 ng/mL (R)- and (S)-ibuprofen were prepared in human plasma and analyzed. The mean re- sponse was determined from the samples. The LOD was determined as the lowest concentration of (R)- and (S)- ibuprofen in the samples where the mean response of the (R)- and (S)-ibuprofen peaks was at least 3-times the response compared to the blank sample. 2.7.5. Selectivity Selectivity was determined in pooled human plasma samples made from three separate lots spiked at the LOQ level. Triplicate samples were prepared. Blank human plasma samples without (R)- and (S)-ibuprofen and (R)- Copyright © 2010 SciRes. AJAC  A. SZEITZ ET AL. 51 and (S)-flurbiprofen were also prepared using the pooled human plasma samples made from the three lots. The blank samples were visually compared to the LOQ sam- ples for any significant interference at the retention times of (R)- and (S)-ibuprofen and (R)- and (S)-flurbiprofen. The acceptance criteria for selectivity were that the mean response (i.e., S/N) of (R)- and (S)-ibuprofen in the LOQ samples were at least 5-times the response compared to the blank samples, and there was no significant matrix interference at the retention times of (R)- and (S)-ibu- profen and (R)- and (S)-flurbiprofen when the blank sam- ples were compared with the LOQ samples. 2.7.6. Absolute Recovery Samples of QC-Low, QC-Mid, and QC-High were pre- pared in human plasma and analyzed. The (R)- and (S)- ibuprofen peak area counts of the extracted samples were compared to the (R)- and (S)-ibuprofen peak area counts of directly injected standards of the same concentration. Six determinations per concentration were performed and absolute recovery was calculated according to the following formula: %Absolute recovery = (extracted (R)- and (S)-ibuprofen peak area counts/unextracted (R)- and (S)-ibuprofen peak area counts) × 100. 2.7.7. Matrix Effect Matrix effect, which may cause ionization suppression or enhancement of the analytes, was determined in three blank human plasma lots. Samples of QC-Low, QC-Mid, and QC-High were prepared in human plasma and in water and analyzed. The (R)- and (S)-ibuprofen peak area counts of the plasma samples were compared to that ob- tained in samples prepared in water. Samples were ana- lyzed in triplicates and the matrix effect was calculated according to the following formula: %Matrix Effect = peak area counts in plasma—peak area counts in water/ peak area counts in water × 100. Matrix effect was con- sidered negligible if no more than 10% difference in the peak area counts of (R)- and (S)-ibuprofen was observed in the human plasma samples compared to the samples prepared in water. Negative %matrix effect represented ionization suppression, and positive %matrix effect rep- resented ionization enhancement. 2.7.8. Dilution-Integrity Six aliquots of QC-High (2500 ng/mL) samples were diluted 10-fold with blank human plasma and analyzed. The acceptance criteria for (R)- and (S)-ibuprofen were the accuracy (%Deviation) ± 15% from the actual value (250 ng/mL), and precision (%RSD) ≤ 15% from the six determinations. 2.7.9. Evaluation of Carry-over An aliquot of a QC-Mid sample was prepared and three injections were made, immediately followed by three injections of a blank human plasma sample. Carry-over was expressed as the percentage difference between the mean (R)- and (S)-ibuprofen or (R)- and (S)-flurbiprofen peak area counts in blank human plasma samples and the mean (R)- and (S)-ibuprofen or (R)- and (S)-flurbiprofen peak area count in the QC-Mid sample. Carry-over was considered negligible if no more than 5% of (R)- and (S)-ibuprofen or (R)- and (S)-flurbiprofen was observed in the blank plasma. The percentage carry-over was cal- culated as follows: %Carry-over = (BL/QC-Mid) × 100, where BL = Mean peak area count in the blank samples (at retention times of (R)- and (S)-ibuprofen or (R)- and (S)-flurbiprofen), QC-Mid = Mean (R)- and (S)-ibupro- fen or (R)- and (S)-flurbiprofen peak area count in the QC-Mid sample. 3. Results and Discussion The objective of this study was to develop and validate a sensitive and enantioselective UPLC-MS/MS method for the quantitation of the (R)- and (S)-ibuprofen in human plasma. A method was needed, which had a simple sam- ple preparation step including derivatization, so that the resulting (R)- and (S)-ibuprofen diastereomers could be analyzed with conventional reverse-phase chromato- graphic conditions. 3.1. Method Development and Optimization The present analytical procedure is based upon a previ- ously reported assay [29] with modifications to the method of detection, chromatography and sample prepa- ration as described below. 3.1.1. Mass Spectrometry The spectrofluorometric detection [29] was replaced with mass spectrometric detection. Mass spectrometry is a much improved detection technique, because it allows for the selective monitoring of the MRM transitions of (R)- and (S)-ibuprofen and (R)- and (S)-flurbiprofen, therefore, eliminating any interferences with co-eluting endogenous components from human plasma. In order to monitor (R)- and (S)-ibuprofen and (R)- and (S)-flurbi- profen using a non-chiral chromatographic system, the compounds were derivatized as described above to yield the corresponding diastereomeric amides. The amide derivatives contained a nitrogen atom, which could be ionized efficiently using ES + mode. The molecular ions were determined by the direct injection of about 100 µg/mL solutions of the analytes in water/methanol: 50/50 into the mobile phase flow of the same composition in the absence of a chromatographic column. The molecular ions observed for (R)- and (S)-ibuprofen were m/z 360.2, and m/z 398.3 for (R)- and (S)-flurbiprofen. The cone voltage value was optimized with the most intense signal Copyright © 2010 SciRes. AJAC  52 A. SZEITZ ET AL. obtained at a cone voltage of 30 V for each analyte. Source temperature, desolvation temperature, and desol- vation gas flow values were optimized for the highest signal and are reported in Subsection 2.2. The product ions of the analytes were determined and representative product ion mass spectra obtained in ES+ for (R)- and (S)-ibuprofen, and for (R)- and (S)-flurbiprofen are pre- sented in Figure 1. The CE values were optimized to obtain the most abundant signals for the product ions. The proposed fragmentation pattern of the diastereo- meric amide derivatives of (R)- and (S)-ibuprofen, and (R)- and (S)-flurbiprofen obtained in ES+ is presented in Figure 2. MRM transitions were created and (R)- and (S)-ibuprofen was detected at m/z 360.2 232.1 (CE 10 eV), and (R)-and (S)-flurbiprofen at m/z 398.3 270.1 (CE 10 eV). The dwell time was set to 25 ms for (R)-and (S)-ibuprofen as this provided sufficient sampling points during the chromatographic peaks to achieve reliable inte- gration and, therefore, reproducible results. The dwell time for (R)-and (S)-flurbiprofen was set to 50 ms. 3.1.2. Liquid Chromatography The HPLC system using a conventional C18 column was replaced with a UPLC system using a narrow-bore Ac- quity UPLC ethylene bridged hybrid (BEH) phenyl column, and the mobile phase system containing a mix- ture of phosphate buffer and acetonitrile was replaced with a mobile phase system containing a mixture of wa- ter, ammonium acetate, formic acid, methanol and ace- tonitrile. For our initial studies, an Acquity UPLC BEH C18 1.7 µm, 2.1 × 100 mm column was tested for the separation of (R)- and (S)-ibuprofen, and (R)- and (S)-flurbiprofen. The mobile phase composition was solvent a: water with 0.1% formic acid and solvent b: methanol with 0.1% formic acid with the flow rate set at 0.2 mL/min. A series of isocratic chromatographic experiments were per- formed which are summarized as follows. Ammonium acetate (10 mM) was added to the mobile phase, differ- ent mobile phase compositions were tested, methanol was replaced with acetonitrile in solvent b, various sol- vent b compositions were prepared with different pro- portions of methanol and acetonitrile mixed in solvent b. While it was found that methanol was a selective solvent for the separation of (R)- and (S)-ibuprofen and acetoni- trile for (R)- and (S)-flurbiprofen, no baseline separation could be achieved for these compounds with any addi- tional changes made to the chromatographic conditions when the C18 chromatographic column was used. Based on these findings, the C18 column was replaced with a Waters Acquity UPLC BEH Phenyl 1.7 µm 2.1 × 150 mm column. With the phenyl column, when solvent a was water with 10 mM ammonium acetate and 0.1% formic acid, and solvent b was a mixture of acetonitrile/ methanol: 64/36 containing 10 mM ammonium acetate and 0.1% formic acid, and using an isocratic run with a Figure 1. Representative product ion mass spectra of the diastereomeric amide derivatives of (a) (R)- and (S)-ibu- profen, and (b) (R)- and (S)-flurbiprofen obtained in ES+ with a collision energy (CE) 10 eV. flow rate of 0.2 mL/min, and a mobile phase composition of solvent a/solvent b: 35/65, baseline separation was achieved for (R)- and (S)-ibuprofen, and (R)- and (S)- flurbiprofen. The final gradient programming is detailed in Subsection 2.2. With this chromatographic column, mobile phase composition and gradient programming, (R)- and (S)-flurbiprofen eluted at a retention time of 8.82 Copyright © 2010 SciRes. AJAC  A. SZEITZ ET AL. 53 Figure 2. Proposed fragmentation pattern of diastereomeric amide derivatives of (1) (R)- and (2) (S)-ibuprofen, (3) (R)- and (4) (S)-flurbiprofen obtained in ES+. min and 10.03 min, respectively, and (R)- and (S)-ibu- profen eluted at a retention time 10.12 min and 11.07 min, respectively. A representative chromatogram of the plasma sample taken from a human volunteer 120 min after the oral administration of a 400 mg ibuprofen cap- sule is presented in Figure 3. 3.1.3. Sample Preparation The sample volume required for analysis was reduced from 0.5 mL [29] to 100 µL, and the sample preparation was simplified. The buffering step with sodium phos- phate buffer was removed and the extraction solvent di- ethylether was replaced with methyl-tert-butyl ether which is less flammable, less toxic and easier to use. The mixing time for sample preparation was reduced, and the transfer of the organic layer was made quicker and more efficient by freezing the bottom aqueous layer in the tubes and decanting the top organic layer into a clean set of tubes. After derivatization, the step of passing the samples through solid-phase extraction silica cartridges was eliminated. 3.2. Method Validation 3.2.1. Accuracy and Precision The results for accuracy and precision are presented in Table 1. Accuracy was expressed as the %Deviation for the QC-Low, QC-Mid and QC-High samples. Intra-day accuracy for (R)-ibuprofen ranged between -11.8% and 11.2%, and for (S)-ibuprofen between -8.6% and -0.3%. Inter-day accuracy for (R)-ibuprofen ranged between –10.4% and 4.5%, and for (S)-ibuprofen between –4.8% and –0.6%. Precision was expressed as the %RSD for the QC-Low, QC-Mid and QC-High samples. Intra-day pre- cision for (R)-ibuprofen ranged between 2.2% and 10.3%, and for (S)-ibuprofen between 1.7% and 7.0%. Inter-day precision for (R)-ibuprofen ranged between 5.9% and 11.2%, and for (S)-ibuprofen between 4.0% and 4.8%. The method met the acceptance criteria for accuracy of %Deviation ± 20% for the QC-Low samples, and ± 15% for the QC-Mid, and QC-High samples, and for precision of % RSD 20% for QC-Low samples, and 15% for the QC-Mid, and QC-High samples. This indicated that the method was accurate and precise over the range of the assay. 3.2.2. Linearity and Range Linearity of the calibration curve was evaluated in seven batches over the course of the validation. The coefficient of determination (mean ± SD, n = 7) for (R)-ibuprofen was r2 = 0.995 ± 0.004, and for (S)-ibuprofen r2 = 0.996 ± 0.004. The accuracy (%Deviation) of the calibration curve levels for (R)-ibuprofen ranged between -12.9% and 5.5%, and for (S)-ibuprofen between -4.6% and 3.4%. The precision (%RSD) of the calibration curve levels for (R)-ibuprofen ranged between 2.3% and 4.4%, and for (S)-ibuprofen between 1.2% and 10.2%. The calibration curve met the acceptance criterion for linear- ity of r2 ≥ 0.980 after weighting with 1/X2. The range of the method was established as 50 ng/mL to 5000 ng/mL where the calibration levels met the acceptance criteria of accuracy (%Deviation) ± 15%, and precision (%RSD) ≤ 15%. The results indicated that the calibration curve was linear, accurate, and precise over the range of the method. Copyright © 2010 SciRes. AJAC  A. SZEITZ ET AL. Copyright © 2010 SciRes. AJAC 54 Table 1. Accuracy (intra- and inter-day) and precision (intra-and inter-day) for (R)- and (S)-ibuprofen in human plasma. (R)-ibuprofen (S)-ibuprofen Accuracy Intra-Day Inter-Day Accuracy Intra-Day Inter-Day QC-Low (80 ng/mL) Day 1 (n = 5) Day 2 (n = 6) Day 3 (n = 6) Day 1-3 (n = 17) QC-Low (80 ng/mL) Day 1 (n = 5) Day 2 (n = 6) Day 3 (n = 6) Day 1-3 (n = 17) Mean (ng/mL) 76.7 82.2 81.1 80.2 Mean (ng/mL) 79.7 79.1 79.6 79.5 SD (ng/mL) 2.38 5.11 3.63 4.38 SD (ng/mL) 4.99 5.21 3.69 4.36 %Deviation –4.1 2.7 1.3 0.2 %Deviation –0.3 –1.1 –0.5 –0.6 QC-Mid (250 ng/mL) QC-Mid (250 ng/mL) Mean (ng/mL) 242 261 278 261 Mean (ng/mL) 244 244 249 246 SD (ng/mL) 22.6 10.8 14.5 18.9 SD (ng/mL) 6.72 7.82 8.47 7.62 %Deviation –3.4 4.4 11.2 4.5 %Deviation –2.3 –2.4 –0.5 –1.7 QC-High (2500 ng/mL) QC-High (2500 ng/mL) Mean (ng/mL) 2205 2246 2267 2241 Mean (ng/mL) 2428 2285 2433 2379 SD (ng/mL) 18.1 71.0 43.9 54.0 SD (ng/mL) 37.7 98.4 85.7 104 %Deviation –11.8–10.2 –9.3 –10.4 %Deviation –2.9 –8.6 –2.7 –4.8 (R)-ibuprofen (S)-ibuprofen Precision Intra-Day Inter-DayPrecision Intra-Day Inter-Day QC-Low (80 ng/mL) Day 1 (n = 6) Day 2 (n = 5) Day 3 (n = 6) Day 1-3 (n = 17) QC-Low (80 ng/mL) Day 1 (n = 6) Day 2 (n = 5) Day 3 (n = 6) Day 1-3 (n = 17) Mean (ng/mL) 78.6 89.6 96.7 88.2 Mean (ng/mL) 89.5 90.0 89.0 89.4 SD (ng/mL) 4.88 8.29 5.73 9.87 SD (ng/mL) 3.40 6.28 2.36 3.92 %RSD 6.2 9.2 5.9 11.2 %RSD 3.8 7.0 2.6 4.4 QC-Mid (250 ng/mL) QC-Mid (250 ng/mL) Mean (ng/mL) 268 298 274 279 Mean (ng/mL) 271 267 252 263 SD (ng/mL) 9.25 12.5 10.3 16.4 SD (ng/mL) 4.48 5.20 8.58 10.5 %RSD 3.4 4.2 3.7 5.9 %RSD 1.7 1.9 3.4 4.0 QC-High (2500 ng/mL) QC-High (2500 ng/mL) Mean (ng/mL) 1912 2121 2040 2018 Mean (ng/mL) 2219 2121 2074 2139 SD (ng/mL) 81.7 218 44.5 149 SD (ng/mL) 79.6 110 68.4 103 %RSD 4.3 10.3 2.2 7.4 %RSD 3.6 5.2 3.3 4.8 SD = Standard Deviation; %Deviation = [(measured amount/added amount) × 100]-100 [%]; %RSD = Relative Standard Deviation [%]. 3.2.3. Limit of Quantitation, Selectivity, Limit of Detection LOQ was determined in six replicates of the 50 ng/mL calibration standard. The mean response of the (R)- and (S)-ibuprofen peaks in the samples was higher than 5-times the response obtained in the blank sample. The accuracy (%Deviation) for (R)-ibuprofen ranged between –7.1% and 7.3% and for (S)-ibuprofen between –0.4% and 5.2%. The precision (%RSD) for (R)-ibuprofen was 5.8% and for (S)-ibuprofen 2.0%. Results for the deter- mination of LOQ met the acceptance criteria of the mean response which was at least 5-times the response com- pared to the blank sample, accuracy (%Deviation) ± 20% and precision % RSD ≤ 20%, and the (R)- and (S)-ibu- profen peaks were identifiable, discrete, and reproducible. The method was accurate and precise with an established LOQ of 50 ng/mL of (R)- and (S)-ibuprofen requiring 100 µL of sample. The selectivity of the method was investigated in triplicate samples of pooled human plasma made from three separate lots spiked at LOQ level. Blank human plasma samples from three separate lots were also prepared. The selectivity met the accep- tance criteria that the mean response for (R)- and (S)- ibuprofen was at least 5-times the response compared to the blank samples, and there was no significant interfer- ence at the retention times of (R)- and (S)-ibuprofen and  A. SZEITZ ET AL. 55 (R)- and (S)-flurbiprofen when the blank human plasma samples were compared to the LOQ samples. The results indicated that the method was selective for these analytes. LOD was determined in triplicate samples of 1 ng/mL (R)- and (S)-ibuprofen prepared in human plasma. The mean response (i.e., S/N) of the (R)- and (S)-ibuprofen peaks in the samples was higher than 3-times the re- sponse obtained in the blank sample. The method had an established LOD of 1 ng/mL of (R)- and (S)-ibuprofen requiring 100 µL of sample. Representative chroma- tograms of LOD (1 ng/mL), and blank human plasma samples are presented in Figure 4. 3.2.4. Absolute Recovery and Matrix Effect The mean %Absolute recovery values (n = 6) for (R)-ibuprofen for QC-Low, QC-Mid and QC-High were 81.9%, 86.9% and 84.5%, respectively, and for (S)-ibu- profen 82.2%, 83.4% and 83.7%, respectively. The re- sults indicated that (R)- and (S)-ibuprofen were extracted relatively uniformly over the concentration range of the assay. The mean %Matrix effect values (n = 9) for (R)-ibuprofen for QC-Low, QC-Mid, and QC-High were Figure 3. A representative chromatogram of the plasma sample taken from a human volunteer 120 min after the oral administration of a 400 mg ibuprofen capsule. The MRM signal of m/z 360.2 232.1 for (R)- and (S)-ibupro- fen is on the top, and m/z 398.3 270.1 for internal stan- dards (R)- and (S)-flurbiprofen is on the bottom (the meas- ured (R)- and (S)-ibuprofen concentrations were 803 ng/mL and 1087 ng/mL, respectively). 1.3%, 2.2% and –2.5%, respectively, and for (S)- ibu- profen 2.1%, –6.2%, and –2.0%, respectively. The re- sults met the acceptance criterion of %Matrix effect of no more than 10%. This indicated that the matrix effect from human plasma contributing to the ionization sup- pression or enhancement of (R)- and (S)-ibuprofen was negligible. 3.2.5. Dilution Integrity and Evaluation of Carry-over After the 10-fold dilution of the six aliquot of the QC- High samples, the accuracy (%Deviation, n = 6) for (R)-ibuprofen ranged between –5.5% and 4.1%, and for (S)-ibuprofen between –7.9% and 5.6%. The precision (%RSD, n = 6) for (R)-ibuprofen was 3.7% and for (S)-ibuprofen 4.5%. The results met the acceptance crite- ria of accuracy (%Deviation) ±15% from the actual value (250 ng/mL), and precision (%RSD) ≤ 15%. This indi- cated that samples exceeding the calibration curve con- centrations could be diluted 10-fold to bring them into the range of the assay with accuracy and precision. Carry-over between injections of the QC-Mid and blank plasma samples for (R)-ibuprofen was 0.4%, for (S)-ibuprofen 1.0%, for (R)-flurbiprofen 0.1%, and for (S)-flurbiprofen 0.1%; all met the acceptance criteria of no more than 5%. 3.2.6. Pharmacokinetics of (R)- and (S)-ibuprofen in humans Healthy human volunteers were involved in a pharma- cokinetic study following the administration of a single oral dose of 400 mg ibuprofen capsules. The detailed pharmacokinetic results of this study will be published elsewhere. Here we report the results of four randomly selected subjects to demonstrate the applicability of the developed and validated method to determine the (R)- and (S)-ibuprofen concentrations in human plasma. Plasma samples were collected at various time intervals up to 300 min following the ibuprofen dose. A represen- tative plasma concentration vs. time plot obtained from one subject is presented in Figure 5. (R)- and (S)-ibu- profen concentrations increased during the first 90 min reaching a peak value of 15,026 ng/mL for (R)-ibuprofen, and 18,915 ng/mL for (S)-ibuprofen. After that time, the drug concentrations decreased gradually and remained above 3100 ng/mL for (R)-ibuprofen, and 5800 ng/mL for (S)-ibuprofen at the final sampling time of 300 min. Pharmacokinetic analysis of the plasma concentration data obtained from the four subjects was performed us- ing a non-compartmental analysis (PK Solutions 2.0, Montrose, CO, USA). The results were normalized to body weights. The estimated pharmacokinetic parame- ters for (R)-ibuprofen were as follows (mean ± SD, n = 4): terminal elimination half-life (t1/2): 83.8 ± 8.62 min, Tmax: 37.5 ± 8.66 min, Cmax: 14,076 ± 3160 ng/mL, ap- parent volume of distribution (V/F): 350 ± 50.4 mL/kg, apparent oral clearance (CL/F): 2.91 ± 0.519 mL/min/kg, Copyright © 2010 SciRes. AJAC  56 A. SZEITZ ET AL. Figure 4. Limit of detection (LOD, 1 ng/mL) and blank human plasma samples. (a) shows the MRM m/z 360.2 232.1 for (R)- and (S)-ibuprofen in blank human plasma (top), and in the LOD sample (bottom) (the signal-to-noise [S/N] values are reported on the top of the (R)- and (S)-ibuprofen peaks). (b) shows the MRM m/z 398.3 270.1 for (R)- and (S)-flurbiprofen, internal standard, in blank human plasma (top), and in the LOD sample (bot- tom). Figure 5. Concentration of (R)- and (S)-ibuprofen vs. time profile obtained from a volunteer following a single oral dose of a 400 mg ibuprofen capsule. and mean residence time (MRTINF): 142 ± 23.4 min; and for (S)-ibuprofen (mean ± SD, n = 4): terminal elimina- tion half-life (t1/2): 108 ± 14.6 min, Tmax: 41.3 ± 7.50 min, Cmax: 15,779 ± 4720 ng/mL, apparent volume of distribu- tion (V/F): 325 ± 91.1 mL/kg, apparent oral clearance (CL/F): 2.06 ± 0.303 mL/min/kg, and mean residence time (MRTINF): 173 ± 16.1 min. In summary, the results show that following the oral administration of 400 mg racemic ibuprofen, both enan- tiomer showed rapid absorption and stereoselective dis- position. For (S)-ibuprofen, the plasma concentrations peaked at 41.3 min, reached higher levels (i.e., 15,779 ng/mL), had higher terminal elimination half life (108 min), apparent volume of distribution (325 mL/kg), mean residence time (173 min), and lower apparent oral clear- ance (2.06 mL/min/kg) than those values for (R)-ibuprofen (i.e., Tmax: 37.5 min, Cmax: 14,076 ng/mL, t1/2: 83.8 min, V/F: 350 mL/kg, MRTINF: 142 min, and CL/F: 2.91 mL/ min/kg, respectively). These findings are consistent with the data of in vivo chiral inversion of (R)-ibuprofen to (S)-ibuprofen reported in the literature [9-11]. 4. Conclusions An enantioselective modified UPLC-MS/MS method was developed and validated for the quantitation of (R)- and (S)-ibuprofen enantiomers in human plasma. Com- pared to previously published assays, sample preparation was simplified without the need of post-derivatization sample clean-up [29], sample volume required for analy- sis was reduced at least 5-fold [6,25,29], the range of the calibration curve was extended into the three-digit range [23,25,29], baseline separation of (R)- and (S)-ibuprofen was achieved [20,25] and the sensitivity was increased 2-fold [23-25,29]. The assay was validated with a LOQ of 50 ng/mL, however, the sensitivity of the assay proved to be significantly higher with a LOD of 1 ng/mL. It was not necessary to validate the method at a LOQ less than 50 ng/mL, because of the high concentration of the sam- ples analyzed during this study. However, the LOQ of the present assay can be easily extended to the low ng/mL levels if future studies require a methodology with significantly higher sensitivity. The assay demon- strated good reproducibility and was applied to investi- gate the pharmacokinetics of ibuprofen enantiomers fol- lowing oral administration of the racemate drug. 5. Acknowledgements The authors would like to thank Dr. Cathy Boscarino for her valuable work with the design of the human study; Mrs. Debbie Kerrigan-Brown, Ingrid Smith, Christina Powlesland, and Mr. Kevin Hofer, Robert Limmer, Doug Saunders, Jan Pope for their excellent technical support of the human study. This work was funded by a research contract with Defence Research and Development Can- ada; contract number W7711-088126. Copyright © 2010 SciRes. AJAC  A. SZEITZ ET AL. 57 6. References [1] R. D. Knihinicki, K. M. Williams and R. O. Day, “Chiral Inversion of 2-Arylpropionic Acid Non-Steroidal Anti- Inflammatory Drugs—I. In Vitro Studies of Ibuprofen and Flurbiprofen,” Biochemical Pharmacology, Vol. 38, No. 24, December 1989, pp. 4389-4395. [2] S. M. Sanins, W. J. Adams, D. G. Kaiser, G. W. Halstead, J. Hosley, H. Barnes and T. A. Baillie, “Mechanistic Studies on the Metabolic Chiral Inversion of R-Ibuprofen in the Rat,” Drug Metabolism and Disposition, Vol. 19, No. 2, March-April 1991, pp. 405-410. [3] S. Fournel and J. Caldwell, “Metabolic Chiral Inversion of 2-Phenylpropionic Acid in Rat, Mouse and Rabbit,” Biochemical Pharmacology, Vol. 35, No. 23, December 1986, pp. 4153-4159. [4] J. Caldwell, A. J. Hull and S. Fournel-Gigleux, “The Metabolic Chiral Inversion and Dispositional Enantiose- lectivity of the 2-Arylpropionic Acids and their Biologi- cal Consequences,” Biochemical Pharmacology, Vol. 37, No. 1, January 1988, pp. 105-114. [5] D. G. Kaiser, G. J. Van Giessen, R. J. Reischer and W. J. Wechter, “Isomeric Inversion of Ibuprofen (R)-Enantiomer in Humans,” Journal of Pharmaceutical Sciences, Vol. 65, No. 2, February 1976, pp. 269-273. [6] T. A. Baillie, W. J. Adams, D. G. Kaiser, L. S. Olanoff, G. W. Halstead, H. Harpootlian and G. J. Van Giessen, “Mechanistic Studies of the Metabolic Chiral Inversion of (R)-Ibuprofen in Humans,” Journal of Pharmacology and Experimental Therapeutics, Vol. 249, No. 2, May 1989, pp. 517-523. [7] S. S. Adams, P. Bresloff and C. G. Mason, “Pharmacol- ogical Differences Between Optical Isomers of Ibuprofen: Evidence for Metabolic Inversion of the (–)-Isomer,” Journal of Pharmacy and Pharmacology, Vol. 28, No. 3, March 1976, pp. 256-257. [8] A. J. Hutt and J. Caldwell, “The Metabolic Chiral Inver- sion of 2-Aryl Propionic Acids—A Novel Route with Pharmacological Consequences,” Journal of Pharmacy and Pharmacology, Vol. 35, No. 11, November 1983, pp. 693-704. [9] A. J. Hutt and J. Caldwell, “The Importance of Stereo- chemistry in the Clinical Pharmacokinetics of the 2- Arylpropionic Acid Non-Steroidal Anti-Inflammatory Drugs,” Clinical Pharmacokinetics, Vol. 9, No. 4, July- August 1984, pp. 371-373. [10] S. C. Tan, B. K. Patel, S. H. D. Jackson, C. G. Swift, and J. Hutt, “Stereoselectivity of Ibuprofen Metabolism and Pharmacokinetics Following the Administration of the Racemate to Healthy Volunteers,” Xenobiotica, Vol. 32, No. 8, August 2002, pp. 683-697. [11] H. Hao, G. Wang and J. Sun, “Enantioselective Pharma- cokinetics of Ibuprofen and Involved Mechanisms,” Drug Metabolism Reviews, Vol. 73, No. 1, January 2005, pp. 215-234. [12] E. J. Lee, K. Williams, R. Day, G. Graham and D. Cham- pion, “Stereoselective Disposition of Ibuprofen Enanti- omers in Man,” British Journal of Clinical Pharmacology, Vol. 19, No. 5, May 1985, pp. 669-674. [13] S. C. Tan, B. K. Patel, S. H. Jackson, C. G. Swift and A. J. Hutt, “Influence of Age on the Enantiomeric Disposition of Ibuprofen in Healthy Volunteers,” British Journal of Clinical Pharmacology, Vol. 55, No. 6, June 2003, pp. 579-587. [14] G. F. Lockwood, K. S. Albert, G. J. Szpunar and J. G. Wagner, “Pharmacokinetics of Ibuprofen in Man—III: Plasma Protein Binding,” Journal of Pharmacokinetics & Biopharmaceutics, Vol. 11, No. 5, October 1983, pp. 469-482. [15] J. K. Paliwal, D. E Smith, S. R Cox, R. R Berardi, V. A. Dunn-Kucharski and G. H. Elta, “Stereoselective, Com- petitive, and Nonlinear Plasma Protein Binding of Ibu- profen Enantiomers as Determined in Vivo in Healthy Subjects,” Journal of Pharmacokinetics and Biopharma- ceutics, Vol. 21, No. 2, April 1993, pp. 145-161. [16] J. C. Nielsen, P. Bjerring, L. Arendt-Nielsen and K.-J. Petterson, “A Double-Blind, Placebo Controlled, Cross- over Comparison of the Analgesic Effect of Ibuprofen 400 Mg and 800 Mg on Laser-Induced Pain,” British Journal of Clinical Pharmacology, Vol. 30, No. 5, No- vember 1990, pp. 711-715. [17] P. Camilleri and C. Dyke, “Effect of 2H2O on the Resolu- tion of the Optical Isomers of Ibuprofen on an Α1-Acid Glycoprotein Column,” Journal of Chromatography A, Vol. 518, June 1990, pp. 277-281. [18] S. Menzel-Soglowek, G. Geisslinger and K. Brune, “Stereoselective High-Performance Liquid Chroma- tographic Determination of Ketoprofen, Ibuprofen and Fenoprofen in Plasma Using a Chiral Alpha 1-Acid Gly- coprotein Column,” Journal of Chromatography A, Vol. 532, No. 2, November 1990, pp. 295-303. [19] K. J. Pettersson and A. Olsson, “Liquid Chromatographic Determination of The Enantiomers of Ibuprofen in Plasma Using a Chiral AGP Column,” Journal of Chro- matography A, Vol. 563, No. 2, February 1991, pp. 414-418. [20] W. Naidong and J. W. Lee, “Development and Validation of a Liquid Chromatographic Method for the Quantitation of Ibuprofen Enantiomers in Human Plasma,” Journal of Pharmaceutical and Biomedical Analysis, Vol. 12, No. 4, April 1994, pp. 551-556. [21] H. Y. Aboul-Enein, A. Van Overbeke, G. Vander Weken, W. Baeyens, H. Oda, P. Deprez and A. De Kruif, “HPLC on Chiralcel OJ-R for Enantiomer Separation and Analy- sis of Ketoprofen, from Horse Plasma, as the 9-Amino- phenanthrene Derivative,” Journal of Pharmacy and Pharmacology, Vol. 50, No. 3, March 1998, pp. 291-296. [22] K. Tachibana and A. Ohnishi, “Reversed-Phase Liquid Chromatographic Separation of Enantiomers on Polysac- charide Type Chiral Stationary Phases,” Journal of Chro- matography A, Vol. 906, No. 1-2, January 2001, pp. 127-154. [23] X. W. Teng, S.W. Wang and N. M. Davies, “Stereospeci- fic High-Performance Liquid Chromatographic Analysis of Ibuprofen in Rat Serum,” Journal of Chromatography B, Vol. 796, No. 2, November 2003, pp. 225-231. Copyright © 2010 SciRes. AJAC  A. SZEITZ ET AL. Copyright © 2010 SciRes. AJAC 58 [24] A. Reddy, M. Hashim, Z. Wang. L. Penn, C. J. Stankovic, D. Burdette, N. Surendran and H. Cai, “A Novel Method for Assessing Inhibition of Ibuprofen Chiral Inversion and its Application in Drug Discovery,” International Journal of Pharmaceutics, Vol. 335, No. 1-2, April 2007, pp. 63-69. [25] P. S. Bonato, M. P. Del Lama and R. Carvalho, “Enanti- oselective Determination of Ibuprofen in Plasma by High-Performance Liquid Chromatography-Electrospray Mass Spectrometry,” Journal of Chromatography B, Vol. 796, No. 2, November 2003, pp. 413-420. [26] E. J. D. Lee, K. M. Williams, G. G. Graham, R. O. Day, and G. D. Champion, “Liquid Chromatographic Deter- mination and Plasma Concentration Profile of Optical Isomers of Ibuprofen in Humans,” Journal of Pharma- ceutical Sciences, Vol. 73, No. 11, November 1984, pp. 1542-1544. [27] R. Mehvar, F. JamaII and F. M. Pasutto, “Liquid- Chromatographic Assay of Ibuprofen Enantiomers in Plasma,” Clinical Chemistry, Vol. 34, No. 3, March 1988, pp. 493-496. [28] C. H. Lemko, G. Caille and R. T. Foster, “Stereospecific High-Performance Liquid Chromatographic Assay of Ibuprofen: Improved Sensitivity and Sample Processing Efficiency,” Journal of Chromatography A, Vol. 619, No. 2, September 1993, pp. 330-335. [29] S. C. Tan, S. H. D Jackson, C. G Swift and A. J. Hutt, “Enantiospecific Analysis of Ibuprofen by High Per- formance Liquid Chromatography: Determination of Free and Total Drug Enantiomer Concentrations in Serum and Urine,” Chromatographia, Vol. 46, No. 1-2, July 1997, pp. 23-32. [30] M. J. Hilton and K. V. Thomas, “Determination of Se- lected Human Pharmaceutical Compounds in Effluent and Surface Water Samples by High-Performance Liquid Chromatography-Electrospray Tandem Mass Spectrome- try,” Journal of Chromatography A, Vol. 1015, No. 1-2, October 2003, pp. 129-141. [31] R. Leverence, M. J. Avery, O. Kavetskaia, H. Bi, C. E. Hop and A. I. Gusev, “Signal Suppression/Enhancement in HPLC-ESI-MS/MS from Concomitant Medications,” Biomedical Chromatography, Vol. 21, No. 11, November 2007, pp. 1143-1150. [32] S. Y. Chang, W. Li, S. C. Traeger, B. Wang, D. Cui, H. Zhang, B. Wen and A.D. Rodrigues, “Confirmation that Cytochrome P450 2C8 (CYP2C8) Plays a Minor Role in (S)-(+)- and (R)-(-)-Ibuprofen Hydroxylation in Vitro,” Drug Metabolism and Disposition, Vol. 36, No. 12, De- cember 2008, pp. 2513-2522. [33] G. D. Mendes, F. D. Mendes, C. C. Domingues, R. A de Oliveira, M. A. da Silva, L. S. Chen, J. O. Ilha, C. E. Fer- nandes and G. De Nucci, “Comparative Bioavailability of Three Ibuprofen Formulations in Healthy Human Volun- teers,” International Journal of Clinical Pharmacology and Therapeutics, Vol. 46, No. 6, June 2008, pp. 309- 318. [34] P. Seideman, F. Lohrer, G. G. Graham, M. W. Duncan, K. M. Williams and R. O. Day, “The Stereoselective Dispo- sition of the Enantiomers of Ibuprofen in Blood, Blister and Synovial Fluid,” British Journal of Clinical Phar- macology, Vol. 38, No. 3, September 1994, pp. 221-227. [35] B. A. Way, T. R. Wilhite, C. H. Smith and M. Landt, “Measurement of Plasma Ibuprofen by Gas Chromatog- raphy-Mass Spectrometry,” Journal of Clinical Labora- tory Analysis, Vol. 11, No. 6, April 1997, pp. 336-339. [36] Á. Sebők, A. Vasanits-Zsigrai, Gy. Palkó, Gy. Záray and I. Molnár-Perl, “Identification and Quantification of Ibu- profen, Naproxen, Ketoprofen and Diclofenac Present in Waste-Waters, as their Trimethylsilyl Derivatives, by Gas Chromatography Mass Spectrometry,” Talanta, Vol. 76, No. 3, July 2008, pp. 642-650. |