Paper Menu >>
Journal Menu >>
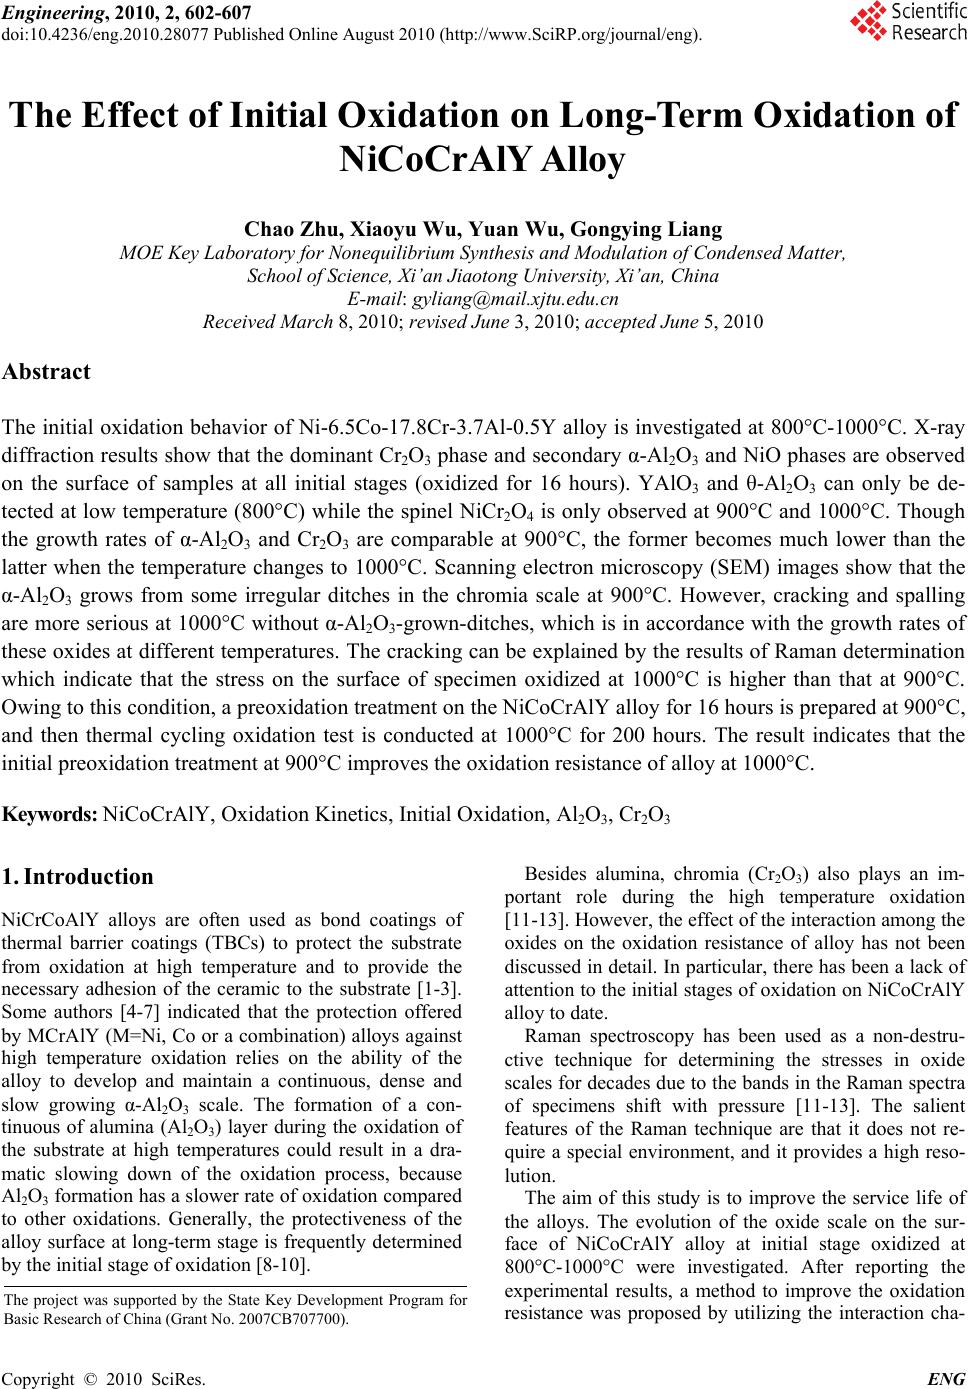 Engineering, 2010, 2, 602-607 doi:10.4236/eng.2010.28077 Published Online August 2010 (http://www.SciRP.org/journal/eng). Copyright © 2010 SciRes. ENG The Effect of Initial Oxidation on Long-Term Oxidation of NiCoCrAlY Alloy Chao Zhu, Xiaoyu Wu, Yuan Wu, Gongying Liang MOE Key Laboratory for Nonequilibrium Synthesis and Modulation of Condensed Matter, School of Science, Xi’an Jiaotong University, Xi’an, China E-mail: gyliang@mail.xjtu.edu.cn Received March 8, 2010; revised June 3, 2010; accepted June 5, 2010 Abstract The initial oxidation behavior of Ni-6.5Co-17.8Cr-3.7Al-0.5Y alloy is investigated at 800°C-1000°C. X-ray diffraction results show that the dominant Cr2O3 phase and secondary α-Al2O3 and NiO phases are observed on the surface of samples at all initial stages (oxidized for 16 hours). YAlO3 and θ-Al2O3 can only be de- tected at low temperature (800°C) while the spinel NiCr2O4 is only observed at 900°C and 1000°C. Though the growth rates of α-Al2O3 and Cr2O3 are comparable at 900°C, the former becomes much lower than the latter when the temperature changes to 1000°C. Scanning electron microscopy (SEM) images show that the α-Al2O3 grows from some irregular ditches in the chromia scale at 900°C. However, cracking and spalling are more serious at 1000°C without α-Al2O3-grown-ditches, which is in accordance with the growth rates of these oxides at different temperatures. The cracking can be explained by the results of Raman determination which indicate that the stress on the surface of specimen oxidized at 1000°C is higher than that at 900°C. Owing to this condition, a preoxidation treatment on the NiCoCrAlY alloy for 16 hours is prepared at 900°C, and then thermal cycling oxidation test is conducted at 1000°C for 200 hours. The result indicates that the initial preoxidation treatment at 900°C improves the oxidation resistance of alloy at 1000°C. Keywords: NiCoCrAlY, Oxidation Kinetics, Initial Oxidation, Al2O3, Cr2O3 1. Introduction NiCrCoAlY alloys are often used as bond coatings of thermal barrier coatings (TBCs) to protect the substrate from oxidation at high temperature and to provide the necessary adhesion of the ceramic to the substrate [1-3]. Some authors [4-7] indicated that the protection offered by MCrAlY (M=Ni, Co or a combination) alloys against high temperature oxidation relies on the ability of the alloy to develop and maintain a continuous, dense and slow growing α-Al2O3 scale. The formation of a con- tinuous of alumina (Al2O3) layer during the oxidation of the substrate at high temperatures could result in a dra- matic slowing down of the oxidation process, because Al2O3 formation has a slower rate of oxidation compared to other oxidations. Generally, the protectiveness of the alloy surface at long-term stage is frequently determined by the initial stage of oxidation [8-10]. Besides alumina, chromia (Cr2O3) also plays an im- portant role during the high temperature oxidation [11-13]. However, the effect of the interaction among the oxides on the oxidation resistance of alloy has not been discussed in detail. In particular, there has been a lack of attention to the initial stages of oxidation on NiCoCrAlY alloy to date. Raman spectroscopy has been used as a non-destru- ctive technique for determining the stresses in oxide scales for decades due to the bands in the Raman spectra of specimens shift with pressure [11-13]. The salient features of the Raman technique are that it does not re- quire a special environment, and it provides a high reso- lution. The aim of this study is to improve the service life of the alloys. The evolution of the oxide scale on the sur- face of NiCoCrAlY alloy at initial stage oxidized at 800°C-1000°C were investigated. After reporting the experimental results, a method to improve the oxidation resistance was proposed by utilizing the interaction cha- The project was supported by the State Key Development Program fo r Basic Research of China (Grant No. 2007CB707700). 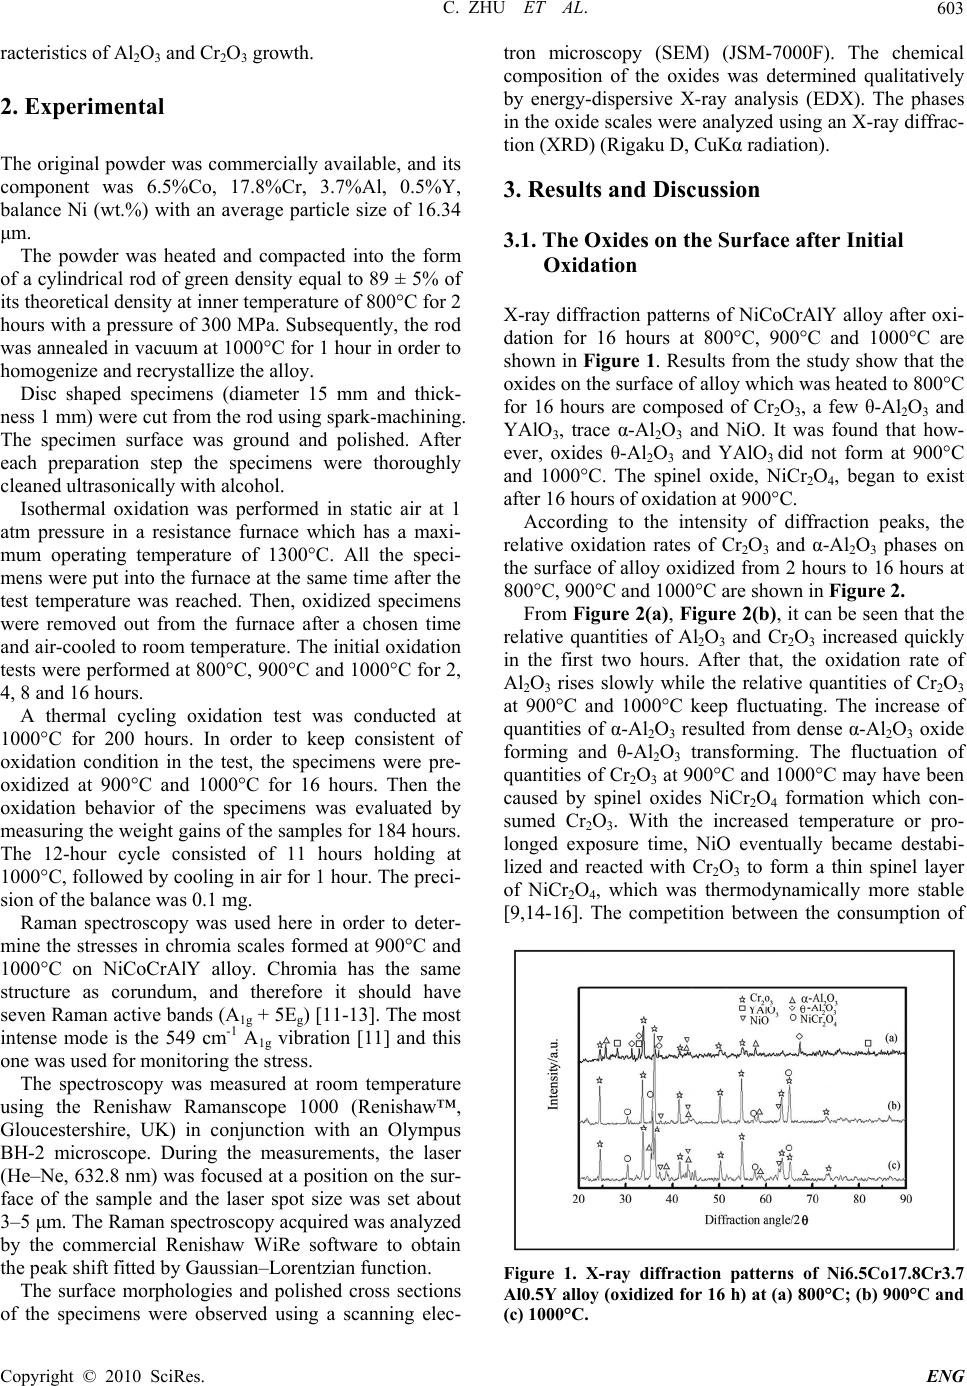 C. ZHU ET AL. Copyright © 2010 SciRes. ENG 603 racteristics of Al2O3 and Cr2O3 growth. 2. Experimental The original powder was commercially available, and its component was 6.5%Co, 17.8%Cr, 3.7%Al, 0.5%Y, balance Ni (wt.%) with an average particle size of 16.34 μm. The powder was heated and compacted into the form of a cylindrical rod of green density equal to 89 ± 5% of its theoretical density at inner temperature of 800°C for 2 hours with a pressure of 300 MPa. Subsequently, the rod was annealed in vacuum at 1000°C for 1 hour in order to homogenize and recrystallize the alloy. Disc shaped specimens (diameter 15 mm and thick- ness 1 mm) were cut from the rod using spark-machining. The specimen surface was ground and polished. After each preparation step the specimens were thoroughly cleaned ultrasonically with alcohol. Isothermal oxidation was performed in static air at 1 atm pressure in a resistance furnace which has a maxi- mum operating temperature of 1300°C. All the speci- mens were put into the furnace at the same time after the test temperature was reached. Then, oxidized specimens were removed out from the furnace after a chosen time and air-cooled to room temperature. The initial oxidation tests were performed at 800°C, 900°C and 1000°C for 2, 4, 8 and 16 hours. A thermal cycling oxidation test was conducted at 1000°C for 200 hours. In order to keep consistent of oxidation condition in the test, the specimens were pre- oxidized at 900°C and 1000°C for 16 hours. Then the oxidation behavior of the specimens was evaluated by measuring the weight gains of the samples for 184 hours. The 12-hour cycle consisted of 11 hours holding at 1000°C, followed by cooling in air for 1 hour. The preci- sion of the balance was 0.1 mg. Raman spectroscopy was used here in order to deter- mine the stresses in chromia scales formed at 900°C and 1000°C on NiCoCrAlY alloy. Chromia has the same structure as corundum, and therefore it should have seven Raman active bands (A1g + 5Eg) [11-13]. The most intense mode is the 549 cm-1 A1g vibration [11] and this one was used for monitoring the stress. The spectroscopy was measured at room temperature using the Renishaw Ramanscope 1000 (Renishaw™, Gloucestershire, UK) in conjunction with an Olympus BH-2 microscope. During the measurements, the laser (He–Ne, 632.8 nm) was focused at a position on the sur- face of the sample and the laser spot size was set about 3–5 μm. The Raman spectroscopy acquired was analyzed by the commercial Renishaw WiRe software to obtain the peak shift fitted by Gaussian–Lorentzian function. The surface morphologies and polished cross sections of the specimens were observed using a scanning elec- tron microscopy (SEM) (JSM-7000F). The chemical composition of the oxides was determined qualitatively by energy-dispersive X-ray analysis (EDX). The phases in the oxide scales were analyzed using an X-ray diffrac- tion (XRD) (Rigaku D, CuKα radiation). 3. Results and Discussion 3.1. The Oxides on the Surface after Initial Oxidation X-ray diffraction patterns of NiCoCrAlY alloy after oxi- dation for 16 hours at 800°C, 900°C and 1000°C are shown in Figure 1. Results from the study show that the oxides on the surface of alloy which was heated to 800°C for 16 hours are composed of Cr2O3, a few θ-Al2O3 and YAlO3, trace α-Al2O3 and NiO. It was found that how- ever, oxides θ-Al2O3 and YAlO3 did not form at 900°C and 1000°C. The spinel oxide, NiCr2O4, began to exist after 16 hours of oxidation at 900°C. According to the intensity of diffraction peaks, the relative oxidation rates of Cr2O3 and α-Al2O3 phases on the surface of alloy oxidized from 2 hours to 16 hours at 800°C, 900°C and 1000°C are shown in Figure 2. From Figure 2(a), Figure 2(b), it can be seen that the relative quantities of Al2O3 and Cr2O3 increased quickly in the first two hours. After that, the oxidation rate of Al2O3 rises slowly while the relative quantities of Cr2O3 at 900°C and 1000°C keep fluctuating. The increase of quantities of α-Al2O3 resulted from dense α-Al2O3 oxide forming and θ-Al2O3 transforming. The fluctuation of quantities of Cr2O3 at 900°C and 1000°C may have been caused by spinel oxides NiCr2O4 formation which con- sumed Cr2O3. With the increased temperature or pro- longed exposure time, NiO eventually became destabi- lized and reacted with Cr2O3 to form a thin spinel layer of NiCr2O4, which was thermodynamically more stable [9,14-16]. The competition between the consumption of Figure 1. X-ray diffraction patterns of Ni6.5Co17.8Cr3.7 Al0.5Y alloy (oxidized for 16 h) at (a) 800°C; (b) 900°C and (c) 1000°C. 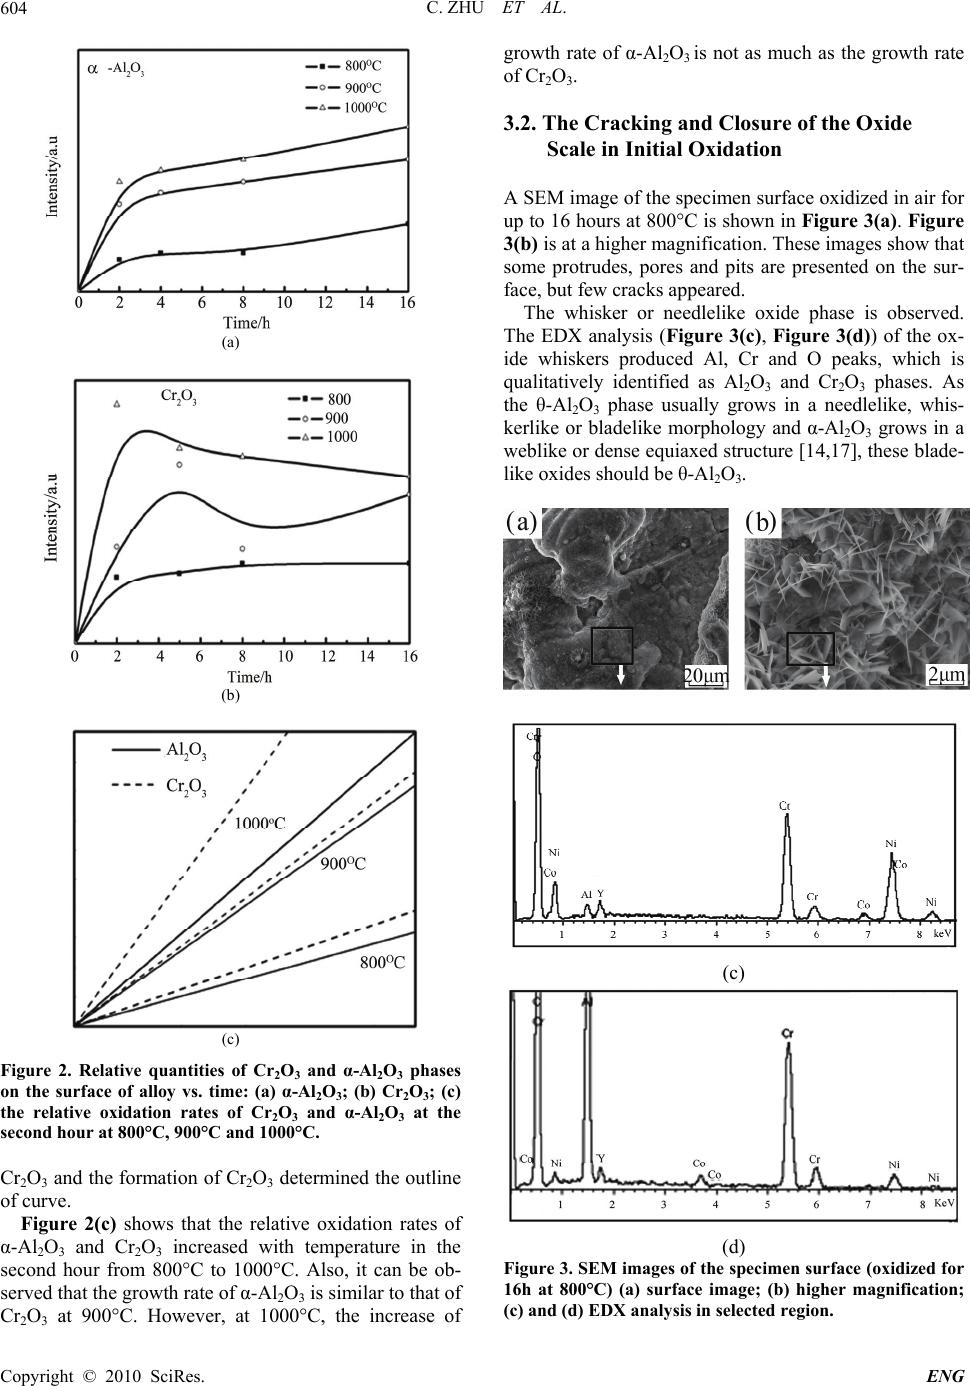 C. ZHU ET AL. Copyright © 2010 SciRes. ENG 604 (a) (b) (c) Figure 2. Relative quantities of Cr2O3 and α-Al2O3 phases on the surface of alloy vs. time: (a) α-Al2O3; (b) Cr2O3; (c) the relative oxidation rates of Cr2O3 and α-Al2O3 at the second hour at 800°C, 900°C and 1000°C. Cr2O3 and the formation of Cr2O3 determined the outline of curve. Figure 2(c) shows that the relative oxidation rates of α-Al2O3 and Cr2O3 increased with temperature in the second hour from 800°C to 1000°C. Also, it can be ob- served that the growth rate of α-Al2O3 is similar to that of Cr2O3 at 900°C. However, at 1000°C, the increase of growth rate of α-Al2O3 is not as much as the growth rate of Cr2O3. 3.2. The Cracking and Closure of the Oxide Scale in Initial Oxidation A SEM image of the specimen surface oxidized in air for up to 16 hours at 800°C is shown in Figure 3(a). Figure 3(b) is at a higher magnification. These images show that some protrudes, pores and pits are presented on the sur- face, but few cracks appeared. The whisker or needlelike oxide phase is observed. The EDX analysis (Figure 3(c), Figure 3(d)) of the ox- ide whiskers produced Al, Cr and O peaks, which is qualitatively identified as Al2O3 and Cr2O3 phases. As the θ-Al2O3 phase usually grows in a needlelike, whis- kerlike or bladelike morphology and α-Al2O3 grows in a weblike or dense equiaxed structure [14,17], these blade- like oxides should be θ-Al2O3. (c) (d) Figure 3. SEM images of the specimen surface (oxidized for 16h at 800°C) (a) surface image; (b) higher magnification; (c) and (d) EDX analysis in selected region. 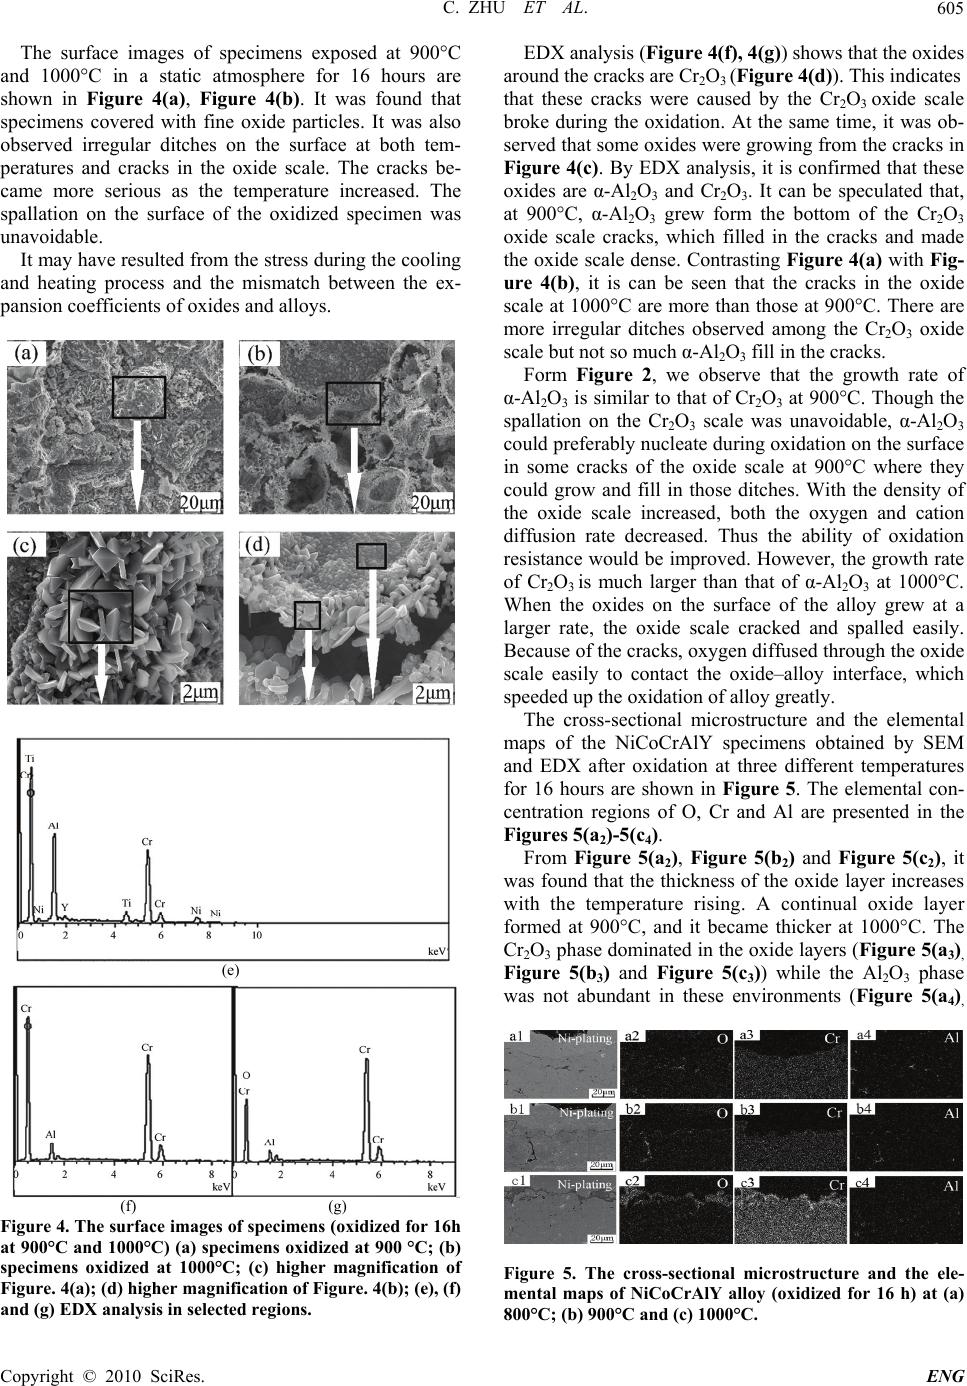 C. ZHU ET AL. Copyright © 2010 SciRes. ENG 605 The surface images of specimens exposed at 900°C and 1000°C in a static atmosphere for 16 hours are shown in Figure 4(a), Figure 4(b). It was found that specimens covered with fine oxide particles. It was also observed irregular ditches on the surface at both tem- peratures and cracks in the oxide scale. The cracks be- came more serious as the temperature increased. The spallation on the surface of the oxidized specimen was unavoidable. It may have resulted from the stress during the cooling and heating process and the mismatch between the ex- pansion coefficients of oxides and alloys. (e) (f) (g) Figure 4. The surface images of specimens (oxidized for 16h at 900°C and 1000°C) (a) specimens oxidized at 900 °C; (b) specimens oxidized at 1000°C; (c) higher magnification of Figure. 4(a); (d) higher magnification of Figure. 4(b); (e), (f) and (g) EDX analysis in selected regions. EDX analysis (Figure 4(f), 4(g)) shows that the oxides around the cracks are Cr2O3 (Figure 4(d)). This indicates that these cracks were caused by the Cr2O3 oxide scale broke during the oxidation. At the same time, it was ob- served that some oxides were growing from the cracks in Figure 4(c). By EDX analysis, it is confirmed that these oxides are α-Al2O3 and Cr2O3. It can be speculated that, at 900°C, α-Al2O3 grew form the bottom of the Cr2O3 oxide scale cracks, which filled in the cracks and made the oxide scale dense. Contrasting Figure 4(a) with Fig- ure 4(b), it is can be seen that the cracks in the oxide scale at 1000°C are more than those at 900°C. There are more irregular ditches observed among the Cr2O3 oxide scale but not so much α-Al2O3 fill in the cracks. Form Figure 2, we observe that the growth rate of α-Al2O3 is similar to that of Cr2O3 at 900°C. Though the spallation on the Cr2O3 scale was unavoidable, α-Al2O3 could preferably nucleate during oxidation on the surface in some cracks of the oxide scale at 900°C where they could grow and fill in those ditches. With the density of the oxide scale increased, both the oxygen and cation diffusion rate decreased. Thus the ability of oxidation resistance would be improved. However, the growth rate of Cr2O3 is much larger than that of α-Al2O3 at 1000°C. When the oxides on the surface of the alloy grew at a larger rate, the oxide scale cracked and spalled easily. Because of the cracks, oxygen diffused through the oxide scale easily to contact the oxide–alloy interface, which speeded up the oxidation of alloy greatly. The cross-sectional microstructure and the elemental maps of the NiCoCrAlY specimens obtained by SEM and EDX after oxidation at three different temperatures for 16 hours are shown in Figure 5. The elemental con- centration regions of O, Cr and Al are presented in the Figures 5(a2)-5(c4). From Figure 5(a2), Figure 5(b2) and Figure 5(c2), it was found that the thickness of the oxide layer increases with the temperature rising. A continual oxide layer formed at 900°C, and it became thicker at 1000°C. The Cr2O3 phase dominated in the oxide layers (Figure 5(a3), Figure 5(b3) and Figure 5(c3)) while the Al2O3 phase was not abundant in these environments (Figure 5(a4), Figure 5. The cross-sectional microstructure and the ele- mental maps of NiCoCrAlY alloy (oxidized for 16 h) at (a) 800°C; (b) 900°C and (c) 1000°C.  C. ZHU ET AL. Copyright © 2010 SciRes. ENG 606 Figure 5(b4) and Figure 5(c4)). This indicated that Cr2O3 formed at the initial oxidation stage. Some brightness Al-containing regions denote the Al2O3 which filled in the Cr2O3 ditches (Figure 5(b4)). This is in good agree- ment with the XRD and surface microstructure results. Though a continuous layer of Al2O3 was not appeared at the onset of the oxidation, an inner zone of isolated Al-containing phase could be observed at all three tem- peratures in Figure 5(a4), Figure 5(b4) and Figure 5(c4). This was in good agreement with the literature [10] and the Al-containing phase should be α-Al2O3. The lateral growth of α-Al2O3 precipitates occurred until they coa- lesce into a continuous α-Al2O3 layer. 3.3. Stress Determination Figure 6 shows the Raman spectrum obtained from the oxide scale formed on the surface of NiCoCrAlY alloys oxidized at 900°C and 1000°C for 16h. The only band which is well-defined in both spectra is the A1g mode at 549 cm-1 in Mougin et al.’s work [11]. In the scales, this mode shifts to 549.53 cm-1 for 900°C specimen and 554.34 cm-1 for 1000°C specimen respectively, resulting in the observed shifts are equal to 0.53 cm-1 and 5.34 cm-1 respectively. Using the law given by Mougin et al. [11] for the frequency dependence with pressure, i.e., 0.307 ± 0.005 GPa/cm-1, it gives the stress values of 0.163 ± 0.005 GPa for 900°C specimen and 1.639 ± 0.005 GPa for 1000°C specimen respectively. The shift direction corresponds to compressive stress. The results exhibited here agree with the previous dis- cussion. The higher growth rate of Cr2O3 at 1000°C re- sulted in a higher stress than the stress generated at a lower temperature. The structure under high stress condition was easier to crack, spall and fracture and was more difficult to self-healing by the Al2O3 growth simultaneously. Figure 6. Raman spectrum for the chromia formed on Ni- CoCrAlY alloys oxidized for 16 h at 900°C and 1000°C. 3.4. The Effect of the Preoxidation Treatment on the Oxidation Resistance Due to the different growth characteristics of α-Al2O3 and Cr2O3 at different temperatures at initial stage of oxidation, two groups of specimen were conducted. One was directly oxidized at 1000°C for 200 hours. The other one was subjected to a preoxidation treatment at 900°C for 16 hours first, aiming to repair micro-cracks in the Cr2O3 scale by subsequent growth of α-Al2O3, then oxi- dized at 1000°C for 184 hours. The oxidation behavior of the specimens was evaluated by a cyclic oxidation test. Figure 7 represents the weight gain as a function of time for the cycle oxidation at 1000°C. In the figure, curve (a) indicates the specimen directly oxidized at 1000°C for 200 hours and curve (b) indicates the speci- men which preoxidixed at 900°C. At the onset of the oxidation, the rate of weight gain of the specimen pre- oxidized at 900°C was slower than that of 1000°C. After the sharp increase of weight gain at the initial oxidation stage, both of the kinetic curves showed an extensive period of very slow weight gain. Obviously, the alloy which preoxidised at 900°C showed lower weight gains than that of 1000°C. With oxidation depth increased, oxygen activity re- duced unceasingly, Al2O3 precipitates would nuclear in subsurface of the alloy but no longer for Cr2O3. This could explain that why the relative quantity of α-Al2O3 at 900°C was larger than that at 1000°C. At 1000°C, a great amount of Cr2O3 formed by the contact between Cr irons and the oxygen through the severe cracks. 4. Conclusions Initial oxidation tests of Ni-6.5Co-17.8Cr-3.7Al-0.5Y alloy specimens was performed at 800°C, 900°C and 1000°C for 16 hours. Cr2O3 was the predominant phase at all three temperatures and the dense Cr2O3 scale play- Figure 7. Weight gain of specimens vs. time in the cyclic oxidation at 1000°C for 200 h (a) directly oxidized at 1000°C; (b) preoxidation treatment at 900°C for 16 h.  C. ZHU ET AL. Copyright © 2010 SciRes. ENG 607 ed an important role in protecting against cracking and oxidation in the first 16 hours of the isothermal oxidation at 800°C. YAlO3 phase was only observed at 800°C. That the growth rate of α-Al2O3 was similar to that of Cr2O3 at 900°C lead to the α-Al2O3 could grow and fill in the ditches on the Cr2O3 scale. However, the growth rate of Cr2O3 at 1000°C was much larger and produced higher stress than that at 900°C, so that the α-Al2O3 grown from the Cr2O3 oxide ditches was not enough to fill in these cracks. Though the spallation on the surface of oxidized specimen was unavoidable at the higher temperature (900°C and 1000°C), a preoxidation treatment at 900°C for 16 hours can cause α-Al2O3-dispersions-in-Cr2O3 scale formed on the surface of the specimen. This could improve the oxidation resistance of NiCoCrAlY alloy in the thermal cycling oxidation. 5. Acknowledgment The project was supported by the State Key Develop- ment Program for Basic Research of China (Grant No. 2007CB707700). 6. References [1] N. P. Padture, M. Gell and E. H. Jordan, “Thermal Bar- rier Coatings for Gas-Turbine Engine Applications,” Sci- ence, Vol. 296, No. 5566, 2002, pp. 280-284. [2] A. G. Evans, D. R. Mumm, J. W. Hutchinson, G. H. Meier and F. S. Pettit, “Mechanisms Controlling the Durability of Thermal Barrier Coatings,” Progress in Materials Science, Vol. 46, No. 5, 2001, pp. 505-553. [3] Y. Fengling and T. D. Bennett, “Phase of Thermal Emission Spectroscopy for Properties Measurements of Delaminating Thermal Barrier Coatings,” Journal of Applied Physics, Vol. 98, No. 10, 2005, pp. 103501- 103508. [4] R. Panat, S. L. Zhang and K. J. Hsia, “Bond Coat Surface Rumpling in Thermal Barrier Coatings,” Acta Materialia, Vol. 51, No. 1, 2003, pp. 239-249. [5] B. Wang, J. Gong, A. Y. Wang, C. Sun, R. F. Huang and L. S. Wen, “Oxidation Behaviour of Nicraly Coatings on Ni-Based Superalloy,” Surface & Coatings Technology, Vol. 149, No. 1, 2002, pp. 70-75. [6] U. Schulz, C. Leyens, K. Fritscher, M. Peters, B. Saruhan-Brings, O. Lavigne, J. M. Dorvaux, M. Poulain, R. Mevrel and M. L. Caliez, “Some Recent Trends in Research and Technology of Advanced Thermal Barrier Coatings,” Aerospace Science and Technology, Vol. 7, No. 1, 2003, pp. 73-80.. [7] R. A. Mahesh, R. Jayaganthan and S. Prakash, “Microstructural Characteristics and Mechanical Pro- perties of HVOF Sprayed Nicral Coating on Super- alloys,” Journal of Alloys and Compounds, Vol. 468, No. 1-2, 2009, pp. 392-405. [8] T. F. An, H. R. Guan, X. F. Sun and Z. Q. Hu “Effect of the Theta-Alpha-Al2O3 Transformation in Scales on the Oxidation Behavior of a Nickel-Base Superalloy with an Aluminide Diffusion Coating,” Oxidation of Metals, Vol. 54, No. 3-4, 2000, pp. 301-316. [9] S. O. Moussa and K. Morsi, “High-Temperature Oxidation of Reactively Processed Nickel Aluminide Intermetallics,” Journal of Alloys and Compounds, Vol. 426, No. 1-2, 2006, pp. 136-143. [10] T. J. Nijdam, N. M. van der Pers and W. G. Sloof, “Oxide Phase Development upon High Temperature Oxidation of Gamma-Nicral Alloys,” Materials and Corrosion- Werkstoffe Und Korrosion, Vol. 57, No. 3, 2006, pp. 269- 275. [11] M. Kemdehoundja, J. F. Dinhut, J. L. Grosseau-Poussard and M. Jeannin, “High Temperature Oxidation of Ni70Cr30 Alloy: Determination of Oxidation Kinetics and Stress Evolution in Chromia Layers,” Materials Science and Engineering A, Vol. 435-436, No. 5, 2006, pp. 666-671. [12] G. Calvarin, A. M. Huntz, A. Hugot Le Goff, S. Joiret and M. C. Bernard, “Oxide Scale Stress Determination by Raman Spectroscopy Application to the Nicr/Cr2O3 System and Influence of Yttrium,” Scripta Materialia, Vol. 38, No. 11, 1998, pp. 1649-1658. [13] P. Kofstadt, “High Temperature Corrosion,” Elsevier, New York, 1988. [14] D. Lee, M. L. Santella, I. M. Anderson and G. M. Pharr “Thermal Aging Effects on the Microstructure and Short- Term Oxidation Behavior of a Cast Ni3Al Alloy,” Intermetallics, Vol. 13, No. 2, 2005, pp. 187-196. [15] S. Seal, S. C. Kuiry and L. A. Bracho, “Surface Chemistry of Oxide Scale on IN-738LC Superalloy: Effect of Long-Term Exposure in Air at 1173 K,” Oxidation of Metals, Vol. 57, No. 3-4, 2002, pp. 297-322. [16] S. C. Choi, H. J. Cho and D. B. Lee, “Effect of Cr, Co, and Ti Additions on the High-Temperature Oxidation Behavior of Ni3Al,” Oxidation of Metals, Vol. 46, No. 1-2, 1996, pp. 109-127. [17] H. H. Angermann, K. Nishi, Y. Aono, M. Inagaki and H. Kodama, “Evolution of Oxides on Ni-Base ODS Superalloys,” Oxidation of Metals, Vol. 48, No. 1-2, 1997, pp. 1-39. |