Creative Education
2012. Vol.3, No.8, 1320-1325
Published Online December 2012 in SciRes (http://www.SciRP.org/journal/ce) http://dx.doi.org/10.4236/ce.2012.38193
Copyright © 2012 SciRes.
1320
Building a Better Mousetrap: Replacing Subjective Writing
Rubrics with More Empirically-Sound Alternatives for EFL
Learners
Andrew D. Schenck, Eoin Daly*
English Education, Department of Liberal Arts Education (LAEC), Ju Si-Gyeong College, Pai Chai University,
Daejeon, South Korea
Email: Schenck@hotmail.com, *eointeacher@yahoo.com
Received October 2nd, 2012; revised November 5th, 2012; accepted November 9th, 2012
Although writing rubrics can provide valuable feedback, the criteria they use are often subjective, which
compels raters to employ their own tacit biases. The purpose of this study is to see if discreet empirical
characteristics of texts can be used in lieu of the rubric to objectively assess the writing quality of EFL
learners. The academic paragraphs of 38 participants were evaluated according to several empirically
calculable criteria related to cohesion, content, and grammar. Values were then compared to scores ob-
tained from holistic scoring by multiple raters using a multiple regression formula. The resulting correla-
tion between variables (R = .873) was highly significant, suggesting that more empirical, impartial means
of writing evaluation can now be used in conjunction with technology to provide student feedback and
teacher training.
Keywords: Writing Rubrics; Writing Evaluation; Cohesion; Grammar; Word Frequency
Introduction
Several studies recognize the efficacy of the rubric as a
means to score writing and provide feedback (Cope, Kalantzis,
McCarthey, Vojak, & Kline, 2011; Mansilla, Duraisingh, Wolfe,
& Haynes, 2009; Peden & Carroll, 2008). A study by Beyreli
and Ari (2009), for example, found that it could be accurately
used to assess ten properties related to structure, language, and
organization with a fair degree of inter-rater reliability (from
65% to 81%). Another study revealed that it could be used to
evaluate writing holistically, regardless of the participants’ L1
(Sévigny, Savard, & Beaudoin, 2009). Recent adaptations of
the rubric have even discovered the potential to increase forma-
tive feedback through the use of both technology and self-as-
sessment strategies (Cope, Kalantzis, McCarthey, Vojak, & Kline,
2011; Peden & Carroll, 2008).
While rubrics can provide a systematic means to evaluate
student writing, their reliability and validity can be questionable.
This is exemplified by recent studies, which reveal that rater
bias and invalidity of writing assessments are negatively impac-
ting summative student evaluation (Graham, Hebert, & Harris,
2011: p. 10; Johnson & VanBrackle, 2012). To overcome these
shortcomings, educators have advocated the use of more au-
thentic assessment methods such as self-assessment checklists,
writing conferences, and writing portfolios (Schulz, 2009).
Current problems with reliability and validity of the writing
rubric may be caused by the subjectivity of rubric criteria. As
pointed out by Fang and Wang (2011), such criteria contain ex-
pressions such as “exceptionally clear”, “effectively organized”,
“carefully chosen”, and “strong control”, which force teachers to
“rely on their own intuition and discursive knowledge in mak-
ing judgment calls” (Fang & Wang, 2011: p. 148). In reality,
this use of vague, subjective descriptors for different categories
of writing reflect a deficiency in understanding of what consti-
tutes good writing. Exploration of more objective, empirical
measures of writing quality may improve this understanding,
thereby allowing for the development of more effective evalua-
tion techniques (Sévigny, Savard, & Beaudoin, 2009). The pur-
pose of this study, therefore, is to examine multiple empirical
criteria and their influence on overall writing quality.
Disparities between Writing Rubrics
Many educators have attempted to increase the validity and
reliability of writing evaluation through the development of ru-
brics. Although they are a useful step forward, key limitations
remain. One of the largest problems with such rubrics is the
subjectivity and ambiguity of language they contain. Holistic
rubrics, for example, which rely upon general impressions of
quality based upon descriptors contained within each proficien-
cy level, often contain vague language which masks the signifi-
cance of results and lessens the potential for washback (Brown,
2004). Consider the following examples contained within levels
4 and 5 of the Test of English as a Foreign Language (TOEFL)
rubric for academic writing (Educational Testing Service, 2008):
Criteria for Rubric Level 4
1) Addresses the topic and task well, though some points
may not be fully elaborated.
2) Is generally well organized and well developed, using ap-
propriate and sufficient explanations, exemplifications, and/or
details.
3) Displays unity, progression, and coherence, though it may
contain occasional redundancy, digression, or unclear connec-
tions.
*Corresponding author.
A. D. SCHENCK, E. DALY
4) Displays facility in the use of language, demonstrating syn-
tactic variety and range of vocabulary, though it will probably
have occasional noticeable minor errors in structure, word form,
or use of idiomatic language that do not interfere with meaning.
Criteria for Rubric Level 5
1) Effectively addresses the topic and task.
2) Is well organized and well developed, using clearly ap-
propriate explanations, exemplifications, and/or details.
3) Displays unity, progression, and coherence.
4) Displays consistent facility in the use of language, demon-
strating syntactic variety, appropriate word choice, and idio-
maticity, though it may have minor lexical or grammatical er-
rors.
As revealed by the words highlighted in bold text, criteria
within levels four and five can be decidedly subjective. Expres-
sions such as “effectively addresses the topic” or “addresses the
topic and task well”, for example, cannot be assigned an em-
pirical value, since they rely primarily on the opinion of an eva-
luator. Raters must use their own intuition to interpret whether
the text is “effective” by using their unique personal experi-
ences and cultural backgrounds. Other terms, such as “appro-
priate”, “sufficient”, “occasional”, and “probably”, are also am-
biguous, and may be interpreted differently depending upon
personal characteristics of the reviewer. It is this ambiguity that
requires extensive training to attain an acceptable level of inter-
rater reliability (Brown, 2004). Due to such problems with ho-
listic writing rubrics, it is imperative that more objective means
of evaluating writing are developed to increase reliability and
decrease the need for extensive training of multiple raters.
In addition to problems with subjectivity, rubric criteria often
evaluate disparate traits, making assertions of validity problem-
atic. The TOEFL IBT rubric, for example, evaluates factors such
as organization, unity, coherence, grammar, and idiomatic lan-
guage of the academic essay genre (Educational Testing Ser-
vice, 2008), while the American Council on the Teaching of Fo-
reign Languages (ACTFL) evaluates multiple genres in con-
junction with factors such as fluency, use of low-frequency
structures, and vocabulary (American Council on the Teaching
of Foreign Languages, 2012). Yet another writing rubric de-
signed by Peregoy & Boyle (2005) includes sentence variety in
addition to elements included in both the TOEFL and ACTFL
rubrics.
In summary, criteria within rubrics have a great deal of am-
biguity and disparity, which make determinations of validity
and reliability more problematic. Raters are compelled to inter-
pret criteria differently, leading to the introduction of personal
biases during the writing evaluation process. This behavior is
exemplified through a study by Hunter and Docherty (2011),
which reveals that raters use their own tacit expectations to
interpret and evaluate aspects of writing structure, content, and
expression. Because of problems with rubrics and associated
rater behaviors, more objective empirical measures of writing
quality are needed. Such measures can increase validity and re-
liability by ensuring that multiple raters assess precisely what is
prescribed within set criteria. Moreover, the use of these meas-
ures can allow for extensive automation of writing evaluation.
While some empirical measures of writing quality have now
been developed, they continue to yield EFL writing scores that
differ significantly from those assigned by human raters (Cho-
dorow & Burstein, 2004; Weigle, 2010). More study is needed
to understand how empirical criteria may be used to evaluate
the overall writing quality of diverse learners. The purpose of
this study, therefore, is to see if multiple empirical measures
can be used to accurately assess the quality of academic writing
composed by EFL learners.
Research Questions
1) Can empirical methods of text evaluation (e.g., cohesion,
content, and grammatical accuracy) be collectively used in lieu
of a holistic scale to accurately rate the writing of EFL learn-
ers?
2) How can empirical measures of writing quality be used to
improve evaluation and education in an EFL setting?
Method
The purpose of this quasi-experimental study was to see if
writing quality could be accurately assessed through using em-
pirical measures of EFL writing. Due to the complexity of de-
veloping measures for multiple types of discourse, only one
genre, that of academic writing, was examined within this study.
Traditional evaluation methods, which required multiple raters
and a holistic scoring rubric, were statistically compared to
empirical values of writing quality.
Participants
This study included participants from two 6-month in-service
training programs for English teachers in Seoul, South Korea.
There were a total of 38 participants, all of whom spoke Korean
as their L1. All participants were middle and high school Eng-
lish teachers with extensive language training. They ranged in
age from 30 to 56 years old, and had extensive teaching ex-
perience that often surpassed 20 years.
Procedure
To obtain writing samples, the participants were each asked
to write an academic paragraph about the cell phone’s influence
on society. Following the collection of the writings, they were
evaluated using a holistic writing rubric designed for the Test of
English as a Foreign Language (TOEFL) (Educational Testing
Service, 2008). Two native English-speaking EFL instructors
independently rated each writing using the holistic rubric. Sub-
sequently, scores were averaged to provide a benchmark for
comparison to empirical methods of evaluation. Both instruc-
tors had over 10 years of experience as EFL teachers in South
Korea, and had received extensive training in EFL assessment
at the graduate level.
To empirically determine the quality of each academic para-
graph, quantitative strategies for the analysis of cohesion, con-
tent, and grammatical accuracy were developed. These strate-
gies are further explained within the following sections.
Empirical Evaluation of Cohesion
Cohesion, which refers to relationships within a text that
make it appear unified, was operationally defined through the
work of Halliday and Hasan (1976), which asserts that cohesion
is maintained through lexical repetition, reference, conjunctions,
ellipsis, and substitution. Lexical repetition was evaluated ac-
cording to eight categories (Hasan, 1984: p. 202):
Copyright © 2012 SciRes. 1321
A. D. SCHENCK, E. DALY
Type Example
1) Repetition leave, leaving, left
2) Synonymy leave, depart
3) Antonymy leave, arrive
4) Hyponymy travel, leave/arrive
(leave and arrive are included in the word, travel)
5) Meronymy hand, finger (finger is part of the hand)
6) Equivalence the doctor was their dad
7) Naming the dolphin was named flipper
8) Semblance the girl looked like an angel
According to these categories, examples within texts that
used versions of the same word, synonyms, and antonyms;
more specific forms of a word, called hyponyms (fork is a hy-
ponym of silverware); constituent parts of a word, called me-
ronyms (finger is a constituent of hand); or seemingly different
words to refer to the same object, as in the examples of equiva-
lence, naming, and semblance, were all tallied for each text.
The information was then entered into a database for analysis.
In addition to examples of lexical cohesion, conjunctions
(e.g., however, and, but, in contrast), which connect different
sentences or clauses; references (pronouns and determiners),
which denote a semantic relationship to other words within a
text; substitution, the insertion of a word or phrase for another;
and ellipsis, the omission of a word or phrase, were all tallied
for each text (Hoey, 1996).
After empirical values of cohesion were collected for a para-
graph, they were divided by the total number of words within
the respective paragraph from which they were taken. This en-
sured that text length did not skew the significance of the em-
pirical values.
Empirical Evaluation of Content, Fluency, and
Vocabulary
Content was empirically evaluated by calculating lexical den-
sity, sentence length, the presence of low-frequency vocabulary,
and the presence of hard words in each text. First, lexical den-
sity, which describes the proportion of content words (nouns,
adjectives, verbs, and adverbs) to the total number of words,
may reveal how much information is contained within the text
(Johansson, 2008). Second, texts containing longer sentences
may reveal higher fluency and more sophistication of gramma-
tical features. Third, the frequency of low-frequency vocabu-
lary (vocabulary that appears less often within a corpus) and
hard words (words with three or more syllables) may indicate
that the student is using more sophisticated vocabulary. While
not all long words may be considered difficult (e.g., asparagus),
academic texts with longer words may reveal an overall trend
toward the use of more sophisticated vocabulary.
Free software programs were used to calculate lexical density,
sentence length, vocabulary frequency, and hard words. Sen-
tence length and vocabulary frequency could be determined th-
rough using the Lexile Analyzer freely available at lexile.com,
while lexical density and hard words were determined by using
the free Text Analyser included at usingenglish.com. Since nei-
ther of these programs included all of the criteria for evaluating
text content, both programs were used.
Empirical Evaluati on of Grammar
Grammar was empirically assessed by tallying each error
within a text. Errors were further divided into the following ca-
tegories for more detailed analysis: prepositions, verb tense/
agreement, count/non-count, plurals/article, run-on sentence,
sentence fragment, word form, other.
After empirical values of grammar were collected for a para-
graph, they were divided by the total number of words within
the respective paragraph from which they were taken. This en-
sured that text length did not skew the significance of the em-
pirical values.
Data Analysis
After empirical values for cohesion, content, and grammar
were obtained for each academic paragraph, they were used to
predict inter-rater writing scores using the multiple regression
formula. Issues of multicollinearity were also examined, and
texts were qualitatively examined to interpret the significance
of the quantitative results.
Results and Discussion
After rating and averaging writing scores from two raters,
scores were compiled into a chart (Appendix A). Although rat-
ings on the TOEFL rubric range from 0 to 5, inter-rater scores
revealed a range from 1.5 to 4.5. Although writing evaluation
by individual raters was generally similar, there were some
differences, resulting in a moderate Cronbach’s alpha value (α
= .622). There was a normal distribution of scores along a
Gaussian curve, with most of the scores falling between 2.5 to
3.5.
Comparison of inter-rater scores with empirical values of
cohesion, content, and grammar revealed substantially signifi-
cant results. Using multiple regression, the empirical values of
cohesion, content, and grammar correlated highly (R = .873) to
inter-rater determinations of writing quality (Table 1).
ANOVA results further confirm the significance of relation-
ships between variables, yielding an F score of 4.702 which is
significant to the .001 probability level. The high correlation
between the dependent variable (inter-rater scores) and inde-
pendent variables (empirical values of cohesion, content, and
grammar) suggests that purely quantitative assessments of writ-
ing may have a high degree of predictive validity. The R-square
value further indicates that 76.2% of the scores assigned th-
rough inter-rater evaluation can be explained using the indepen-
dent variables within this study.
Analysis of individual variables in the multiple regression
model yields a more holistic understanding of the results (See
Table 2). None of the variables of cohesion (lexical repetition,
reference words, or conjunctions) show a significant relation-
ship to inter-rater scores. This may mean that the empirical
method for calculating cohesion is problematic. It may also
signify that problems with cohesion were not prominent within
the texts, which were created by EFL middle and high school
English teachers with a great deal of experience. Albeit insig-
nificant, the positive t values for reference words and conjunct-
Table 1.
Multiple regression model summary.
Model R R SquareAdjusted R Square Std. Error of the Estimate
1 .873.762 .600 .48086
Copyright © 2012 SciRes.
1322
A. D. SCHENCK, E. DALY
Copyright © 2012 SciRes. 1323
Table 2.
Independent variables included in the multiple regression analysis.
Unstandardized Coefficients Std. Coefficient
B Std. Error Beta
t Sig.
(Constant) 16.283 4.048 4.022 .001
Lexical Repetition –.029 .030 –.163 –.941 .357
Reference Words .061 .037 .364 1.639 .115
Conjunctions .019 .048 .060 .391 .700
Sentence Length .061 .031 .271 1.968 .062
Word Frequency –3.216 1.088 –.547 –2.955 .007
Hard Words .003 .032 .019 .108 .915
Lexical Density –.042 .020 –.354 –2.127 .045
Preposition –12.054 16.540 –.109 –.729 .474
Subject Verb Agreement/Verb Tense –76.722 25.051 –.433 –3.063 .006
Count/Noncount –52.925 23.646 –.316 –2.238 .036
Plurals/Article –2.326 5.938 –.055 –.392 .699
Run-on Sentence –28.983 17.608 –.215 –1.646 .114
Sentence Fragment –13.819 37.914 –.057 –.364 .719
Part of Speech –41.029 21.404 –.272 –1.917 .068
Cohesion
Content
Grammar
Other –40.219 17.763 –.308 –2.264 .034
tions (t = 1.639; t = .391) suggest that these cohesive devices
were used more often as writing quality increased; the negative
t value for lexical repetition –.941, in contrast, suggests that a
larger number of repetition was employed in writings of lower
quality. From a qualitative perspective, learners who scored low
on the holistic writing rubric appeared to employ simple repeti-
tion (e.g., repeating the subject cell phone) much more often
than those with a high rubric score. In writings with higher
scores, sophisticated references (e.g., this form of technology, a
new device) and conjunctions (e.g., Moreover, In contrast, etc.)
were used more often than simple repetition. Unlike texts with
lower scores, the highest quality texts also included examples
of semblance, as in the sentence “A cell phone is a new door to
a new era.”
In the category of content, both word frequency and lexical
density were significantly correlated to inter-rater scores when
other independent variables were controlled for, yielding p
values of .007 an .045, respectively. Sentence length, while
insignificant at the .05 probability level, was nearly significant
(p = .062). In contrast to other variables within the content
category, hard words appear to have a miniscule influence on
inter-rater scoring, yielding an insignificant score of p = .915.
Overall, empirical measures of writing seem to accurately pre-
dict inter-rater scores. Positive t values of sentence length and
hard words (t = .108; t = 1.968) may suggest that both of these
factors increase as writing quality increases, while negative t
values of word frequency and lexical density (t = –2.955; t =
–2.127) suggest that both of these factors decrease in intensity
as writing quality increases. This supports qualitative observa-
tion of texts. Consider the following examples:
1) Participant 6 (Rating 4.5)
Cell phone is a new education tool that leads you to a new
educational process. Mobile learning is a topic that people are
interested in these days. You can get new information or learn
via cell phones from the web as well as from textbooks. Third,
its a new device to get whatever information you need by us-
ing wireless connection to the Internet.
2) Participant 12 (Rating 2)
Cell phone is used for educational purpose for their kids.
Cell phone can be books, dictionary, and teachers that give all
the information children need all the time. Cel l phone can be a
toy for their children.
Writings with higher ratings tended to have longer sentences,
which were lengthened using sophisticated conjunctions and
more difficult vocabulary. In example one, relative clauses,
prepositions, and conjunctions are freely employed (e.g., that
people, that leads, whatever information, by using, or), thereby
lengthening sentences and increasing writing quality. Moreover,
this text includes difficult vocabulary, such as device, wireless
communication, and mobile, increasing the sophistication of the
text. In the second example, conjunctions are hardly used, and
sentence length appears to be limited by the proficiency of the
learner. The example is more lexically dense because less gram-
matical features are used to make sophisticated sentences. Sim-
ple nouns, such as cell phone, are repeatedly used to convey
meaning, without the use of complex grammatical features.
Like content, the grammar category of empirical evaluation
has several independent variables that appear to predict inter-
rater scores of participant writings. The subject agreement/tense,
countable/uncountable, and miscellaneous “other” categories
(this category predominantly contained errors with gerund use),
were the most significant predictors of inter-rater writing scores,
yielding p values of .006, .036, and .034 respectively. Incorrect
use of part of speech was nearly significant at p = .068. When
viewed holistically, trends in grammar use reveal a distinct
pattern. Grammatical errors steadily decrease as scores rise from
1.5 to 4.5. Not only do errors within grammatical error catego-
ries steadily decrease, but the number of error categories de-
crease as inter-rater writing scores increase (See Appendix B).
While variables within each category differ in their degree of
significance, the overall high correlation of combined variables
in the multiple regression model suggests that multiple vari-
ables may be involved in the assignment of inter-rater scores.
Analysis of multicollinearity further suggests that each factor
A. D. SCHENCK, E. DALY
may independently contribute to the assignment of a holistic
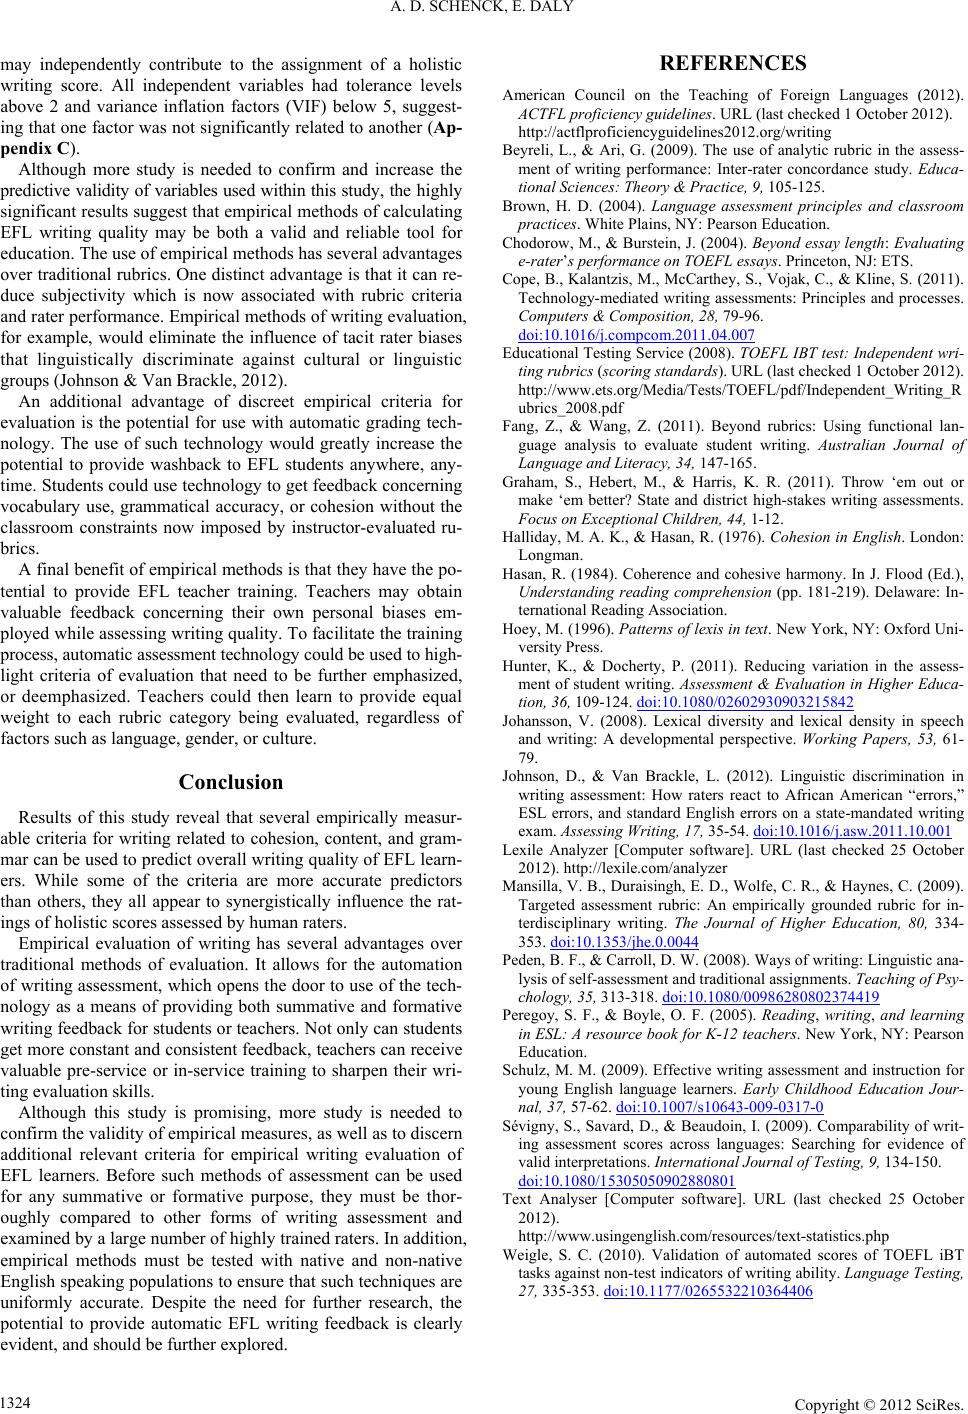
writing score. All independent variables had tolerance levels
above 2 and variance inflation factors (VIF) below 5, suggest-
ing that one factor was not significantly related to another (Ap-
pendix C).
Although more study is needed to confirm and increase the
predictive validity of variables used within this study, the highly
significant results suggest that empirical methods of calculating
EFL writing quality may be both a valid and reliable tool for
education. The use of empirical methods has several advantages
over traditional rubrics. One distinct advantage is that it can re-
duce subjectivity which is now associated with rubric criteria
and rater performance. Empirical methods of writing evaluation,
for example, would eliminate the influence of tacit rater biases
that linguistically discriminate against cultural or linguistic
groups (Johnson & Van Brackle, 2012).
An additional advantage of discreet empirical criteria for
evaluation is the potential for use with automatic grading tech-
nology. The use of such technology would greatly increase the
potential to provide washback to EFL students anywhere, any-
time. Students could use technology to get feedback concerning
vocabulary use, grammatical accuracy, or cohesion without the
classroom constraints now imposed by instructor-evaluated ru-
brics.
A final benefit of empirical methods is that they have the po-
tential to provide EFL teacher training. Teachers may obtain
valuable feedback concerning their own personal biases em-
ployed while assessing writing quality. To facilitate the training
process, automatic assessment technology could be used to high-
light criteria of evaluation that need to be further emphasized,
or deemphasized. Teachers could then learn to provide equal
weight to each rubric category being evaluated, regardless of
factors such as language, gender, or culture.
Conclusion
Results of this study reveal that several empirically measur-
able criteria for writing related to cohesion, content, and gram-
mar can be used to predict overall writing quality of EFL learn-
ers. While some of the criteria are more accurate predictors
than others, they all appear to synergistically influence the rat-
ings of holistic scores assessed by human raters.
Empirical evaluation of writing has several advantages over
traditional methods of evaluation. It allows for the automation
of writing assessment, which opens the door to use of the tech-
nology as a means of providing both summative and formative
writing feedback for students or teachers. Not only can students
get more constant and consistent feedback, teachers can receive
valuable pre-service or in-service training to sharpen their wri-
ting evaluation skills.
Although this study is promising, more study is needed to
confirm the validity of empirical measures, as well as to discern
additional relevant criteria for empirical writing evaluation of
EFL learners. Before such methods of assessment can be used
for any summative or formative purpose, they must be thor-
oughly compared to other forms of writing assessment and
examined by a large number of highly trained raters. In addition,
empirical methods must be tested with native and non-native
English speaking populations to ensure that such techniques are
uniformly accurate. Despite the need for further research, the
potential to provide automatic EFL writing feedback is clearly
evident, and should be further explored.
REFERENCES
American Council on the Teaching of Foreign Languages (2012).
ACTFL proficiency guidelines. URL (last checked 1 October 2012).
http://actflproficiencyguidelines2012.org/writing
Beyreli, L., & Ari, G. (2009). The use of analytic rubric in the assess-
ment of writing performance: Inter-rater concordance study. Educa-
tional Sciences: Theory & Practice, 9, 105-125.
Brown, H. D. (2004). Language assessment principles and classroom
practices. White Plains, NY: Pearson Education.
Chodorow, M., & Burstein, J. (2004). Beyond essay length: Evaluating
e-raters performance on TOEFL essays. Princeton, NJ: ETS.
Cope, B., Kalantzis, M., McCarthey, S., Vojak, C., & Kline, S. (2011).
Technology-mediated writing assessments: Principles and processes.
Computers & Composition, 28, 79-96.
doi:10.1016/j.compcom.2011.04.007
Educational Testing Service (2008). TOEFL IBT test: Independent wri-
ting rubrics (scoring standards). URL (last checked 1 October 2012).
http://www.ets.org/Media/Tests/TOEFL/pdf/Independent_Writing_R
ubrics_2008.pdf
Fang, Z., & Wang, Z. (2011). Beyond rubrics: Using functional lan-
guage analysis to evaluate student writing. Australian Journal of
Language and Literacy, 34, 147-165.
Graham, S., Hebert, M., & Harris, K. R. (2011). Throw ‘em out or
make ‘em better? State and district high-stakes writing assessments.
Focus on Exceptional Children, 44, 1-12.
Halliday, M. A. K., & Hasan, R. (1976). Cohesion in English. London:
Longman.
Hasan, R. (1984). Coherence and cohesive harmony. In J. Flood (Ed.),
Understanding reading comprehension (pp. 181-219). Delaware: In-
ternational Reading Association.
Hoey, M. (1996). Patterns of lexis in text. New York, NY: Oxford Uni-
versity Press.
Hunter, K., & Docherty, P. (2011). Reducing variation in the assess-
ment of student writing. Assessment & Evaluation in Higher Educa-
tion, 36, 109-124. doi:10.1080/02602930903215842
Johansson, V. (2008). Lexical diversity and lexical density in speech
and writing: A developmental perspective. Working Papers, 53, 61-
79.
Johnson, D., & Van Brackle, L. (2012). Linguistic discrimination in
writing assessment: How raters react to African American “errors,”
ESL errors, and standard English errors on a state-mandated writing
exam. Assessing Writing, 17, 35-54. doi:10.1016/j.asw.2011.10.001
Lexile Analyzer [Computer software]. URL (last checked 25 October
2012). http://lexile.com/analyzer
Mansilla, V. B., Duraisingh, E. D., Wolfe, C. R., & Haynes, C. (2009).
Targeted assessment rubric: An empirically grounded rubric for in-
terdisciplinary writing. The Journal of Higher Education, 80, 334-
353. doi:10.1353/jhe.0.0044
Peden, B. F., & Carroll, D. W. (2008). Ways of writing: Linguistic ana-
lysis of self-assessment and traditional assignments. Teaching of Psy-
chology, 35, 313-318. doi:10.1080/00986280802374419
Peregoy, S. F., & Boyle, O. F. (2005). Reading, writing, and learning
in ESL: A resource book for K-12 teachers. New York, NY: Pearson
Education.
Schulz, M. M. (2009). Effective writing assessment and instruction for
young English language learners. Early Childhood Education Jour-
nal, 37, 57-62. doi:10.1007/s10643-009-0317-0
Sévigny, S., Savard, D., & Beaudoin, I. (2009). Comparability of writ-
ing assessment scores across languages: Searching for evidence of
valid interpretations. International Journal of Testing, 9, 134-150.
doi:10.1080/15305050902880801
Text Analyser [Computer software]. URL (last checked 25 October
2012).
http://www.usingenglish.com/resources/text-statistics.php
Weigle, S. C. (2010). Validation of automated scores of TOEFL iBT
tasks against non-test indicators of writing ability. Language Testing,
27, 335-353. doi:10.1177/0265532210364406
Copyright © 2012 SciRes.
1324
A. D. SCHENCK, E. DALY
Copyright © 2012 SciRes. 1325
Appendix A Appendix C
Table C.
Collinearity statistics for independent variables.
Collinearity Statistics
Tolerance VIF
(Constant)
Lexical Repetition .572 1.748
Reference Words .315 3.170
Conjunctions .350 2.856
Sentence Length .391 2.559
Word Frequency .362 2.761
Hard Words .219 4.564
Lexical Density .457 2.191
Preposition .486 2.057
Subject Verb Agreement/Verb Tense .542 1.846
Count/Noncount .541 1.847
Plurals/Article .544 1.838
Run-on Sentence .632 1.582
Sentence Fragment .438 2.281
Part of Speech .538 1.858
Cohesion
Content
Grammar
Other .582 1.718
Figure A.
Inter-rater writing score values.
Appendix B
Figure B.
Grammatical errors within writings (separated by score).