Paper Menu >>
Journal Menu >>
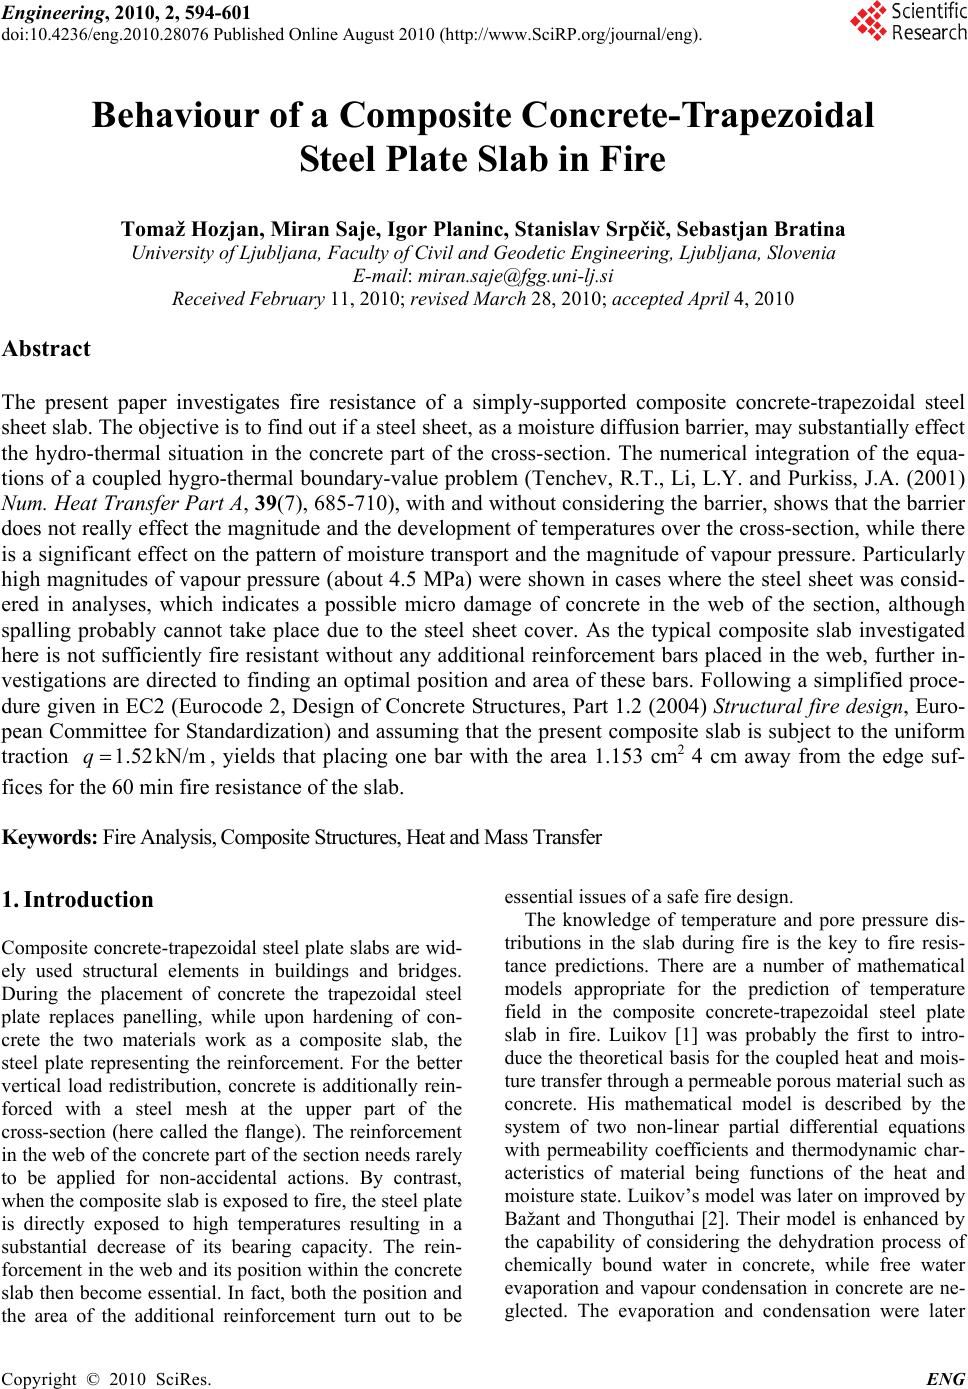 Engineering, 2010, 2, 594-601 doi:10.4236/eng.2010.28076 Published Online August 2010 (http://www.SciRP.org/journal/eng). Copyright © 2010 SciRes. ENG Behaviour of a Composite Concrete-Trapezoidal Steel Plate Slab in Fire Tomaž Hozjan, Miran Saje, Igor Planinc, Stanislav Srpčič, Sebastjan Bratina University of Ljubljana, Faculty of Civil and Geodetic Engineering, Ljubljana, Slovenia E-mail: miran.saje@fgg.uni-lj.si Received February 11, 2010; revised March 28, 2010; accepted April 4, 2010 Abstract The present paper investigates fire resistance of a simply-supported composite concrete-trapezoidal steel sheet slab. The objective is to find out if a steel sheet, as a moisture diffusion barrier, may substantially effect the hydro-thermal situation in the concrete part of the cross-section. The numerical integration of the equa- tions of a coupled hygro-thermal boundary-value problem (Tenchev, R.T., Li, L.Y. and Purkiss, J.A. (2001) Num. Heat Transfer Part A, 39(7), 685-710), with and without considering the barrier, shows that the barrier does not really effect the magnitude and the development of temperatures over the cross-section, while there is a significant effect on the pattern of moisture transport and the magnitude of vapour pressure. Particularly high magnitudes of vapour pressure (about 4.5 MPa) were shown in cases where the steel sheet was consid- ered in analyses, which indicates a possible micro damage of concrete in the web of the section, although spalling probably cannot take place due to the steel sheet cover. As the typical composite slab investigated here is not sufficiently fire resistant without any additional reinforcement bars placed in the web, further in- vestigations are directed to finding an optimal position and area of these bars. Following a simplified proce- dure given in EC2 (Eurocode 2, Design of Concrete Structures, Part 1.2 (2004) Structural fire design, Euro- pean Committee for Standardization) and assuming that the present composite slab is subject to the uniform traction 1.52kN/mq, yields that placing one bar with the area 1.153 cm2 4 cm away from the edge suf- fices for the 60 min fire resistance of the slab. Keywords: Fire Analysis, Composite Structures, Heat and Mass Transfer 1. Introduction Composite concrete-trapezoidal steel plate slabs are wid- ely used structural elements in buildings and bridges. During the placement of concrete the trapezoidal steel plate replaces panelling, while upon hardening of con- crete the two materials work as a composite slab, the steel plate representing the reinforcement. For the better vertical load redistribution, concrete is additionally rein- forced with a steel mesh at the upper part of the cross-section (here called the flange). The reinforcement in the web of the concrete part of the section needs rarely to be applied for non-accidental actions. By contrast, when the composite slab is exposed to fire, the steel plate is directly exposed to high temperatures resulting in a substantial decrease of its bearing capacity. The rein- forcement in the web and its position within the concrete slab then become essential. In fact, both the position and the area of the additional reinforcement turn out to be essential issues of a safe fire design. The knowledge of temperature and pore pressure dis- tributions in the slab during fire is the key to fire resis- tance predictions. There are a number of mathematical models appropriate for the prediction of temperature field in the composite concrete-trapezoidal steel plate slab in fire. Luikov [1] was probably the first to intro- duce the theoretical basis for the coupled heat and mois- ture transfer through a permeable porous material such as concrete. His mathematical model is described by the system of two non-linear partial differential equations with permeability coefficients and thermodynamic char- acteristics of material being functions of the heat and moisture state. Luikov’s model was later on improved by Bažant and Thonguthai [2]. Their model is enhanced by the capability of considering the dehydration process of chemically bound water in concrete, while free water evaporation and vapour condensation in concrete are ne- glected. The evaporation and condensation were later 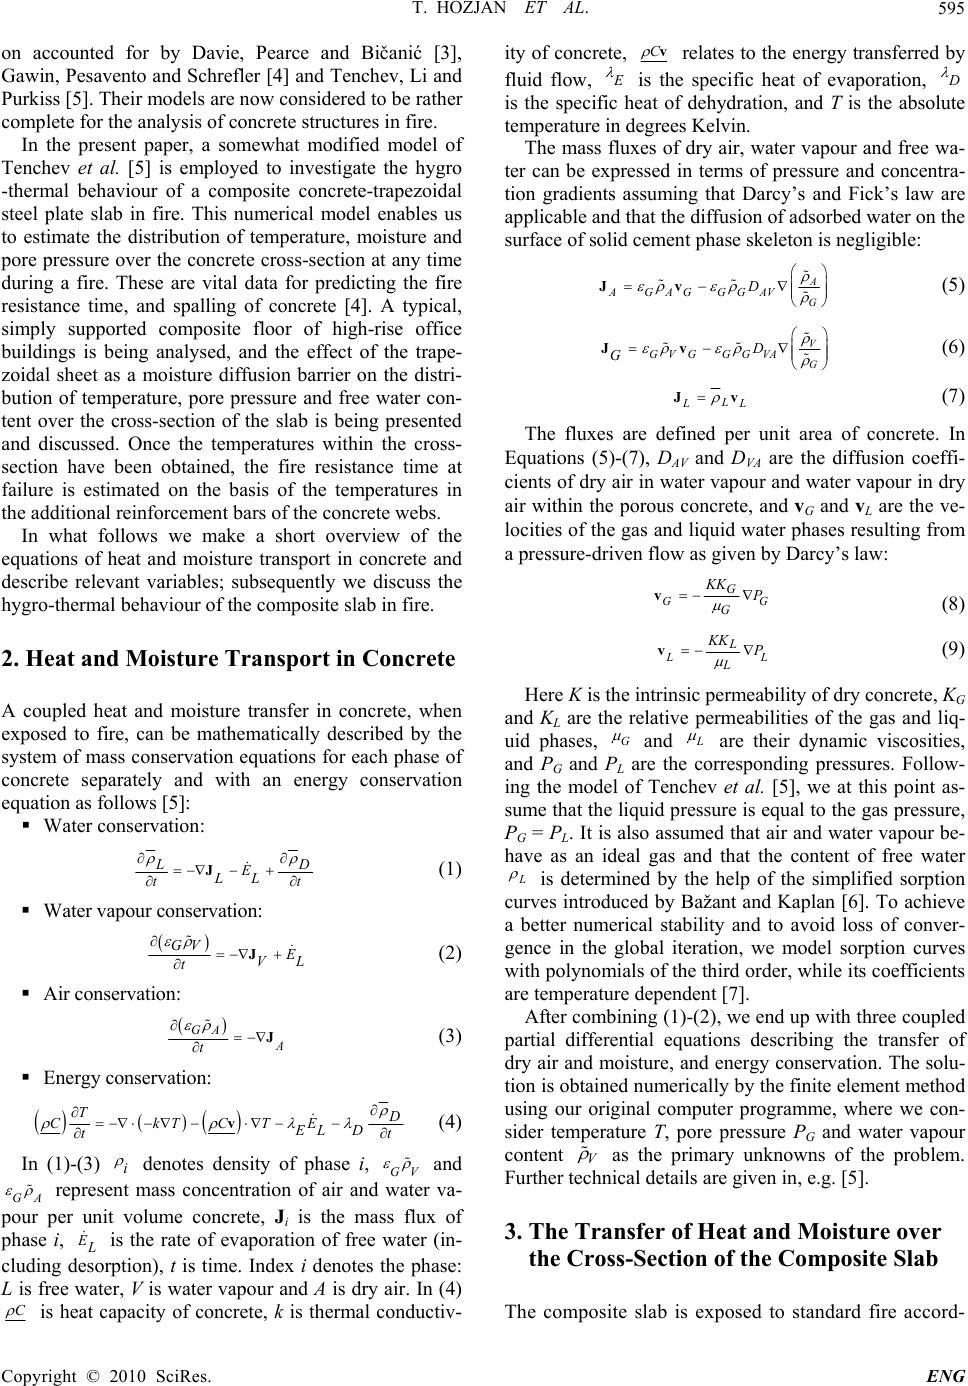 T. HOZJAN ET AL. Copyright © 2010 SciRes. ENG 595 on accounted for by Davie, Pearce and Bičanić [3], Gawin, Pesavento and Schrefler [4] and Tenchev, Li and Purkiss [5]. Their models are now considered to be rather complete for the analysis of concrete structures in fire. In the present paper, a somewhat modified model of Tenchev et al. [5] is employed to investigate the hygro -thermal behaviour of a composite concrete-trapezoidal steel plate slab in fire. This numerical model enables us to estimate the distribution of temperature, moisture and pore pressure over the concrete cross-section at any time during a fire. These are vital data for predicting the fire resistance time, and spalling of concrete [4]. A typical, simply supported composite floor of high-rise office buildings is being analysed, and the effect of the trape- zoidal sheet as a moisture diffusion barrier on the distri- bution of temperature, pore pressure and free water con- tent over the cross-section of the slab is being presented and discussed. Once the temperatures within the cross- section have been obtained, the fire resistance time at failure is estimated on the basis of the temperatures in the additional reinforcement bars of the concrete webs. In what follows we make a short overview of the equations of heat and moisture transport in concrete and describe relevant variables; subsequently we discuss the hygro-thermal behaviour of the composite slab in fire. 2. Heat and Moisture Transport in Concrete A coupled heat and moisture transfer in concrete, when exposed to fire, can be mathematically described by the system of mass conservation equations for each phase of concrete separately and with an energy conservation equation as follows [5]: Water conservation: LD E LL tt J (1) Water vapour conservation: GV E VL t J (2) Air conservation: GA A t J (3) Energy conservation: TD CkTCTE EL D tt v (4) In (1)-(3) i denotes density of phase i, GV and GA represent mass concentration of air and water va- pour per unit volume concrete, Ji is the mass flux of phase i, E L is the rate of evaporation of free water (in- cluding desorption), t is time. Index i denotes the phase: L is free water, V is water vapour and A is dry air. In (4) C is heat capacity of concrete, k is thermal conductiv- ity of concrete, C v relates to the energy transferred by fluid flow, E is the specific heat of evaporation, D is the specific heat of dehydration, and T is the absolute temperature in degrees Kelvin. The mass fluxes of dry air, water vapour and free wa- ter can be expressed in terms of pressure and concentra- tion gradients assuming that Darcy’s and Fick’s law are applicable and that the diffusion of adsorbed water on the surface of solid cement phase skeleton is negligible: A G AGAGGGAV D Jv (5) V G GV GGG VA D G Jv (6) L L L Jv (7) The fluxes are defined per unit area of concrete. In Equations (5)-(7), DAV and DVA are the diffusion coeffi- cients of dry air in water vapour and water vapour in dry air within the porous concrete, and vG and vL are the ve- locities of the gas and liquid water phases resulting from a pressure-driven flow as given by Darcy’s law: GG G G KK P v (8) L L L L KK P v (9) Here K is the intrinsic permeability of dry concrete, KG and KL are the relative permeabilities of the gas and liq- uid phases, G and L are their dynamic viscosities, and PG and PL are the corresponding pressures. Follow- ing the model of Tenchev et al. [5], we at this point as- sume that the liquid pressure is equal to the gas pressure, PG = PL. It is also assumed that air and water vapour be- have as an ideal gas and that the content of free water L is determined by the help of the simplified sorption curves introduced by Bažant and Kaplan [6]. To achieve a better numerical stability and to avoid loss of conver- gence in the global iteration, we model sorption curves with polynomials of the third order, while its coefficients are temperature dependent [7]. After combining (1)-(2), we end up with three coupled partial differential equations describing the transfer of dry air and moisture, and energy conservation. The solu- tion is obtained numerically by the finite element method using our original computer programme, where we con- sider temperature T, pore pressure PG and water vapour content V as the primary unknowns of the problem. Further technical details are given in, e.g. [5]. 3. The Transfer of Heat and Moisture over the Cross-Section of the Composite Slab The composite slab is exposed to standard fire accord- 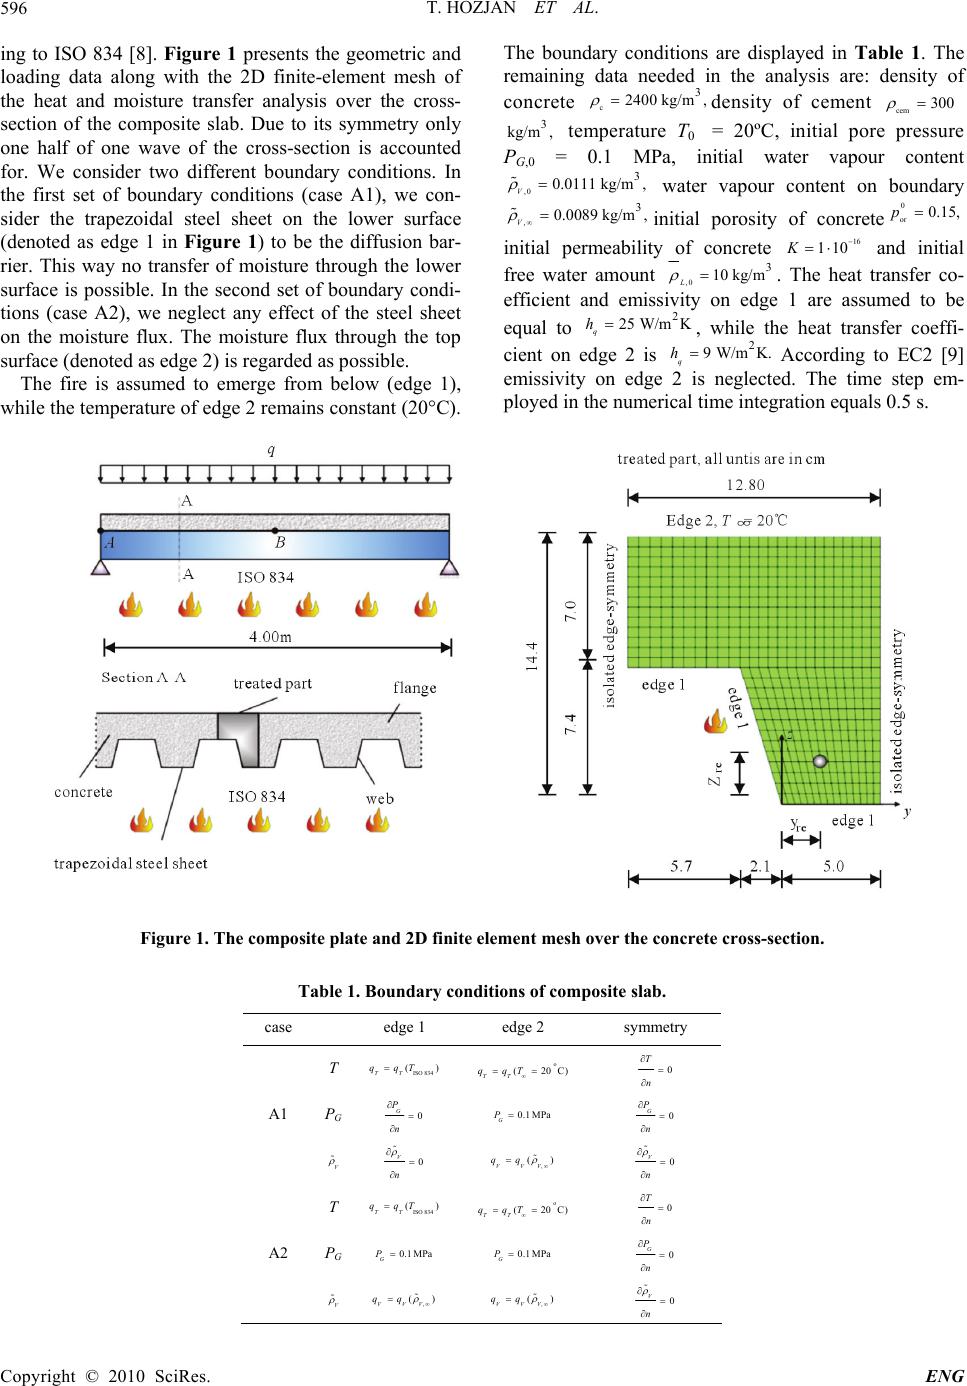 T. HOZJAN ET AL. Copyright © 2010 SciRes. ENG 596 ing to ISO 834 [8]. Figure 1 presents the geometric and loading data along with the 2D finite-element mesh of the heat and moisture transfer analysis over the cross- section of the composite slab. Due to its symmetry only one half of one wave of the cross-section is accounted for. We consider two different boundary conditions. In the first set of boundary conditions (case A1), we con- sider the trapezoidal steel sheet on the lower surface (denoted as edge 1 in Figure 1) to be the diffusion bar- rier. This way no transfer of moisture through the lower surface is possible. In the second set of boundary condi- tions (case A2), we neglect any effect of the steel sheet on the moisture flux. The moisture flux through the top surface (denoted as edge 2) is regarded as possible. The fire is assumed to emerge from below (edge 1), while the temperature of edge 2 remains constant (20°C). The boundary conditions are displayed in Table 1. The remaining data needed in the analysis are: density of concrete c 3 2400 kg/m, density of cement cem300 3 kg/m, temperature T0 = 20ºC, initial pore pressure PG,0 = 0.1 MPa, initial water vapour content ,0 3 0.0111 kg/m, V water vapour content on boundary , 3 0.0089 kg/m, V initial porosity of concrete 0 or 0.15,p initial permeability of concrete 16 110K and initial free water amount ,0 3 10 kg/m L . The heat transfer co- efficient and emissivity on edge 1 are assumed to be equal to 2 25 W/mK q h, while the heat transfer coeffi- cient on edge 2 is 2 9 W/mK. q hAccording to EC2 [9] emissivity on edge 2 is neglected. The time step em- ployed in the numerical time integration equals 0.5 s. Figure 1. The composite plate and 2D finite element mesh over the concrete cross-section. Table 1. Boundary conditions of composite slab. case edge 1 edge 2 symmetry T ISO 834 () TT qqTo (20C) TT qqT 0 T n A1 PG 0 G P n 0.1 MPa G P 0 G P n V 0 V n , () VVV qq 0 V n T ISO 834 () TT qqTo (20C) TT qqT 0 T n A2 PG 0.1 MPa G P 0.1 MPa G P 0 G P n V , () VVV qq , () VVV qq 0 V n  T. HOZJAN ET AL. Copyright © 2010 SciRes. ENG 597 The development of the temperature field over the cross-section of the slab at 15, 30 and 60 min is presented in Figure 2. Although the slab is exposed to the standard fire according to ISO 834, in which case the initial heating rate is rather high, an overall heating of the composite section is quite slow. Figure 2 shows that at 60 minutes the isothermal for 500ºC stays rather close to the lower edge, i.e., only about 2.5 cm away. According to the sim- plified method in EC2, Annex B [9], the contour line T = 500ºC is important in determining the fire resistance of the composite slab exposed to fire, enabling one to neglect the part of concrete whose temperature is greater than 500ºC. To assess the effect of steel sheet as the diffusion bar- rier, we present in Figure 3 the increase of temperatures with time in some characteristic points within the web of the cross-section, whose positions are convenient for placing additional reinforcement bars to achieve a suffi- cient fire resistance. The coordinates of the points are presented in Table 2. The comparison of the results for cases A1 and A2 shows that the temperatures differ only a little and that the increase of temperature is slower in case A1. Similar results have been obtained for the same class of composite cross-sections of various height di- mensions by separate numerical investigations. Thus we can conclude that the steel sheet essentially does not af- fect the temperatures. As observed from Figure 3, the temperature gradient at characteristic points A, B, C and D at 60 min is about 65°C per 1 cm, which results in the temperature decrease between points A and D to be roughly 200ºC per 2.5 cm. It is now clear that we can increase the fire resistance of the composite slab substantially, if we change the posi- tion of the bars for only a few centimeters away from the lower surface of the composite slab. Note that such a change of the position results in a somewhat smaller static height. This should not be critical during fire when the imposed actions and the safety factor are assumed smaller than regularly. (a) temperature T [℃],case A1 t = 15 min t = 30 min t = 60 min 0.14 0.12 0.1 0.08 0.06 0.04 0.02 0 0.14 0.12 0.1 0.08 0.06 0.04 0.02 0 0.14 0.12 0.1 0.08 0.06 0.04 0.02 0 0 0.02 0.04 0.06 0.08 0.1 0.12 0 0.02 0.04 0.06 0.08 0.1 0.12 0 0.02 0.04 0.06 0.08 0.1 0.12 1000 900 800 700 600 500 400 300 200 Figure 2. Distribution of temperature over the cross-section. Figure 3. Variation of temperature with time in points A, B, C and D.  T. HOZJAN ET AL. Copyright © 2010 SciRes. ENG 598 Table 2. Coordinates of characteristic points A, B, C, D. point yre [cm] zre [cm] A 2.5 2.5 B 2.5 3 C 2.5 4 D 2.5 5 While the steel sheet as a diffusion barrier has only a small effect on the temperature distributions, its effect on pore pressures is substantial. This is clearly seen in Fig- ure 4. In case A1, where the transfer of water and water vapour through edge 1 is blocked, the whole amount of free water and water vapour is pushed by the temperature and pore pressure gradients towards edge 2. This is de- picted in Figure 5, showing the distribution of free water content over the cross-section at various instants. Beyond 200ºC the chemically bounded water starts releasing and further increases the volume of free water (Figure 5(a)). At some point a full saturation of pores takes place which causes the substantial rise of the pore pressure. This is more pronounced in case A1, where the magni- tude of pore pressure at 30 min is about 4.5 MPa and is almost homogeneous over the web of the concrete slab (Figure 4(a)). By contrast, in case A2 (Figure 4(b)), vapour can also escape through the lower edge; in fact, the inspection of the results shows that moisture is largely released through the lower edge. As a result, the magnitude of the pore pressure in con- crete is in this case significantly lower (less than 3 MPa) both in the flange and in the web of the cross-section. Comparing the distributions of free water content over the cross-section (Figure 5) shows that the patterns are similar, yet the magnitudes of the water content are dif- ferent. It is obvious that the effect of the steel sheet on the water content is high due to impervious edge 1. The results prove that the steel sheet plays a signifi- cant role in the distribution of pore pressures as well as their magnitudes. While this may result in damage of concrete and the contact between concrete and steel sheet, it is still not clear if solely high pressures could be re- sponsible for explosive spalling of concrete. The absence of explosive spalling may, however, be due to the dam- aged contact between the steel sheet and concrete. Some water vapour could therefore escape either through the lower edge or in the axial direction, causing drop in the pore pressure. Numerous studies also show that pore pressures need not be the main reason for explosive spalling of concrete to occur [4,10]. (a) pore pressure P G [MPa],case A1 t = 15 min t = 30 min t = 60 min (b) pore pressure P G [MPa],case A2 t = 15 min t = 30 min t = 60 min 4.5 4 3.5 3 2.5 2 1.5 1 0.5 0.14 0.12 0.1 0.08 0.06 0.04 0.02 0 0 0.02 0.04 0.06 0.08 0.1 0.12 0.14 0.12 0.1 0.08 0.06 0.04 0.02 0 0 0.02 0.04 0.06 0.08 0.1 0.12 0.14 0.12 0.1 0.08 0.06 0.04 0.02 0 0 0.02 0.04 0.06 0.08 0.1 0.12 4.5 4 3.5 3 2.5 2 1.5 1 0.5 0.14 0.12 0.1 0.08 0.06 0.04 0.02 0 0 0.0 2 0.0 4 0.0 6 0.08 0.1 0.1 2 0.14 0.12 0.1 0.08 0.06 0.04 0.02 0 0 0.0 2 0.0 4 0.0 6 0.08 0.1 0.1 2 0.14 0.12 0.1 0.08 0.06 0.04 0.02 0 0 0.02 0.04 0.06 0.08 0.1 0.12 Figure 4. Distribution of pore pressures over the cross-section at t = 15, 30, and 60 min. (a) case A1; (b) case A2.  T. HOZJAN ET AL. Copyright © 2010 SciRes. ENG 599 30 25 20 15 10 5 0 30 25 20 15 10 5 0 0 0.02 0.04 0.06 0.08 0.1 0.12 0.14 0.12 0.1 0.08 0.06 0.04 0.02 0 0 0.02 0.04 0.06 0.08 0.1 0.12 0.14 0.12 0.1 0.08 0.06 0.04 0.02 0 0 0.02 0.04 0.06 0.08 0.1 0.12 0.14 0.12 0.1 0.08 0.06 0.04 0.02 0 0 0.02 0.04 0.06 0.08 0.1 0.12 0.14 0.12 0.1 0.08 0.06 0.04 0.02 0 0 0.02 0.04 0.06 0.08 0.1 0.12 0.14 0.12 0.1 0.08 0.06 0.04 0.02 00 0.02 0.04 0.06 0.08 0.1 0.12 0.14 0.12 0.1 0.08 0.06 0.04 0.02 0 (b) free water content F W [kg/m 3 ],case A2 t = 15 min t = 30 min t = 60 min (a) free water content F W [kg/m 3 ], case A1 t = 15 min t = 30 min t = 60 min Figure 5. Distribution of free water content over the cross-section at t = 15, 30, and 60 min. (a) case A1; (b) case A2. Figure 6. (a) Variation of temperature with time for different vertical positions of reinforcement bars; (b) Variation of tem- perature with vertical position zre at t = 30, 60, and 90 min. As the steel sheet is directly exposed to high tempera- tures, it loses its bearing capacity shortly after fire begins. The presence of additional reinforcement bars, if any, is essential in such cases. That is why fire resistance of composite slab in terms of the resistance time can be rather well estimated on the basis of actual temperatures in the additional reinforcement bars placed in the web. It is well known that creep strains of mild steel start in- creasing at about 400ºC [11]. At roughly 500ºC, the creep strain rates become pronounced and dictate the failure of the slab. Therefore it is plausible to estimate the resistance time of the composite slab on the basis of the critical temperature in the additional reinforcement. Thus we may assume that loss of resistance is strongly related to the instant when the temperature of the addi- tional reinforcement bar reaches 500ºC. Figure 6(a) shows the time development of temperatures at various vertical locations, zre, appropriate for placing additional  T. HOZJAN ET AL. Copyright © 2010 SciRes. ENG 600 reinforcement bars in the cross-section. The horizontal position of the bars is kept at yre = 2.5 cm in all cases. As expected, the rise of temperature in the reinforcement bar is smaller for bars placed higher. The critical temperature, Tcr = 500ºC, for zre = 4 cm is reached in 58 min and for zre = 6 cm in 83 min. A big difference in time compared to a relatively small change in the vertical position is no- ticeable. This becomes even more clear in Figure 6(b), where the dependency of temperature on the vertical posi- tion zre is presented for t = 30, 60, and 90 min. The idea of a critical temperature can serve as a means to develop a method for a simplified design. Once the fire resistance class (in minutes) and the position of the additional reinforcement bar have been decided on, the temperature of the bar is obtained from the temperature- time distributions over the cross-section found by the nu- merical analysis. Finally, using the simplified EC2 [9] Annex procedure gives the minimum area of the steel bar. The above procedure has been validated by the non- linear mechanical analysis [7] of the simply supported beam discussed here (Figure 1), subjected to the uniform non-accidental external load 1.52 kN/mq [7]. Assum- ing zre = 4 cm and class R60 (i.e., the 60 min fire resis- tance time), the above proposed simplified EC2 [9] pro- cedure yields the area of the bar 1.153 cm2. Using the above reinforcement data and the calculated temperature distributions in the non-linear mechanical analysis [7] gives the fire resistance time to be 69 min. This rather accurate and conservative prediction of the fire resistance time proves that the graphs given in Figure 6 enable us to fairly accurately choose the position and the area of the additional reinforcement bars for a given fire resis- tance class. The details of the mechanical analysis [7] are out of the scope of the present paper and are here omitted. 4. Discussion The simply-supported composite concrete-trapezoidal steel sheet slab is a widely used structural element in engineering. Often its fire resistance applied from below is of prime importance. The steel sheet acts as a moisture diffusion barrier. In order to find out if such a barrier may substantially affect the hydro-thermal situation in the concrete part of the cross-section, we compared the numerical results of the coupled hygro-thermal bound- ary-value problem obtained with and without considering the barrier. The results showed that the barrier does not really affect the magnitude and the development of tem- peratures over the cross-section, while the effect on the pattern of moisture transport and the magnitude of va- pour pressure is significant. Particularly high magnitudes of vapour pressure (about 4.5 MPa) were experienced in analyses when considering the steel sheet, which indi- cates a possible micro damage of concrete in the web of the section, although explosive spalling probably cannot take place due to the steel sheet cover. Our recent mechanical analyses have shown [7] that the composite slab investigated here is not sufficiently fire resistant without placing an additional reinforcement in the web. The objective of the present study was hence to find the area and optimal position of the steel rein- forcement bar in the web such that its fire resistance is within a chosen time resistance class. Due to a slow tem- perature diffusion in concrete, a big difference in the resistance time follows after a small change in the verti- cal position of the bar. For the composite slab investi- gated herein, the area of 1.153 cm2 and the distance of only 4 cm away from the lower surface suffice for the 60 min fire resistance. The resistance time obtained this way is well in keeping with the resistance time obtained by the sophisticated mechanical analysis [7]. 5. References [1] A. V. Luikov, “Systems of Differential Equations of Heat and Mass Transfer on Capillary-Porous Bodies,” Inter- national Journal of Heat and Mass Transfer, Vol. 18, No. 1, 1975, pp. 1-14. [2] Z. P. Bažant and W. Thonguthai, “Pore Pressure and Drying of Concrete at High-Temperature,” Journal of Engineering Mechanics Division-ASCE, Vol. 104, No. 5, 1978, pp. 1059-1079. [3] C. T. Davie, C. J. Pearce and N. Bičanić, “Coupled Heat and Moisture Transport in Concrete at Elevated Tempera- tures - Effects of Capillary Pressure and Absorbed Water,” Numerical Heat Transfer Part A, Vol. 49, No. 8, 2006, pp. 733-763. [4] D. Gawin, F. Pesavento and B. A. Schrefler, “Towards Prediction of the Thermal Spalling Risk through a Multi- Phase Porous Media Model of Concrete,” Computer Methods in Applied Mechanics and Engineering, Vol. 195, No. 41-43, 2003, pp. 5707-5729. [5] R. T. Tenchev, L. Y. Li and J. A. Purkiss, “Finite Ele- ment Analysis of Coupled Heat and Moisture Transfer in Concrete Subjected to Fire,” Numerical Heat Transfer Part A, Vol. 39, No. 7, 2001, pp. 685-710. [6] Z. P. Bažant and M. F. Kaplan, “Concrete at High Tem- peratures: Material Properties and Mathematical Mo- dels,” Longman, Harlow, 1996. [7] T. Hozjan, “Non-Linear Analysis of Composite Planar Structures Exposed to Fire,” Ph.D. Dissertation, Uni- versity of Ljubljana, Faculty of Civil and Geodetic Engineering, 2009. [8] ISO 834, “Fire Resistance Tests-Elements of Building Constructions,” International Standard ISO 834, 1975. [9] Eurocode 2, “Design of Concrete Structures, Part 1.2, Structural Fire Design,” European Committee for Stand- ardization, 2004.  T. HOZJAN ET AL. Copyright © 2010 SciRes. ENG 601 [10] G. A. Khoury, C. E. Majorana, F. Pesavento and B. A. Schrefler, “Modelling of Heated Concrete,” Magazine of Concrete Research, Vol. 54, No. 2, 2002, pp. 77-101. [11] G. Williams-Leir, “Creep of Structural Steel in Fire: Ana- lytical Expressions,” Fire and Materials, Vol. 7, No. 2, 1983, pp. 73-78. |