Paper Menu >>
Journal Menu >>
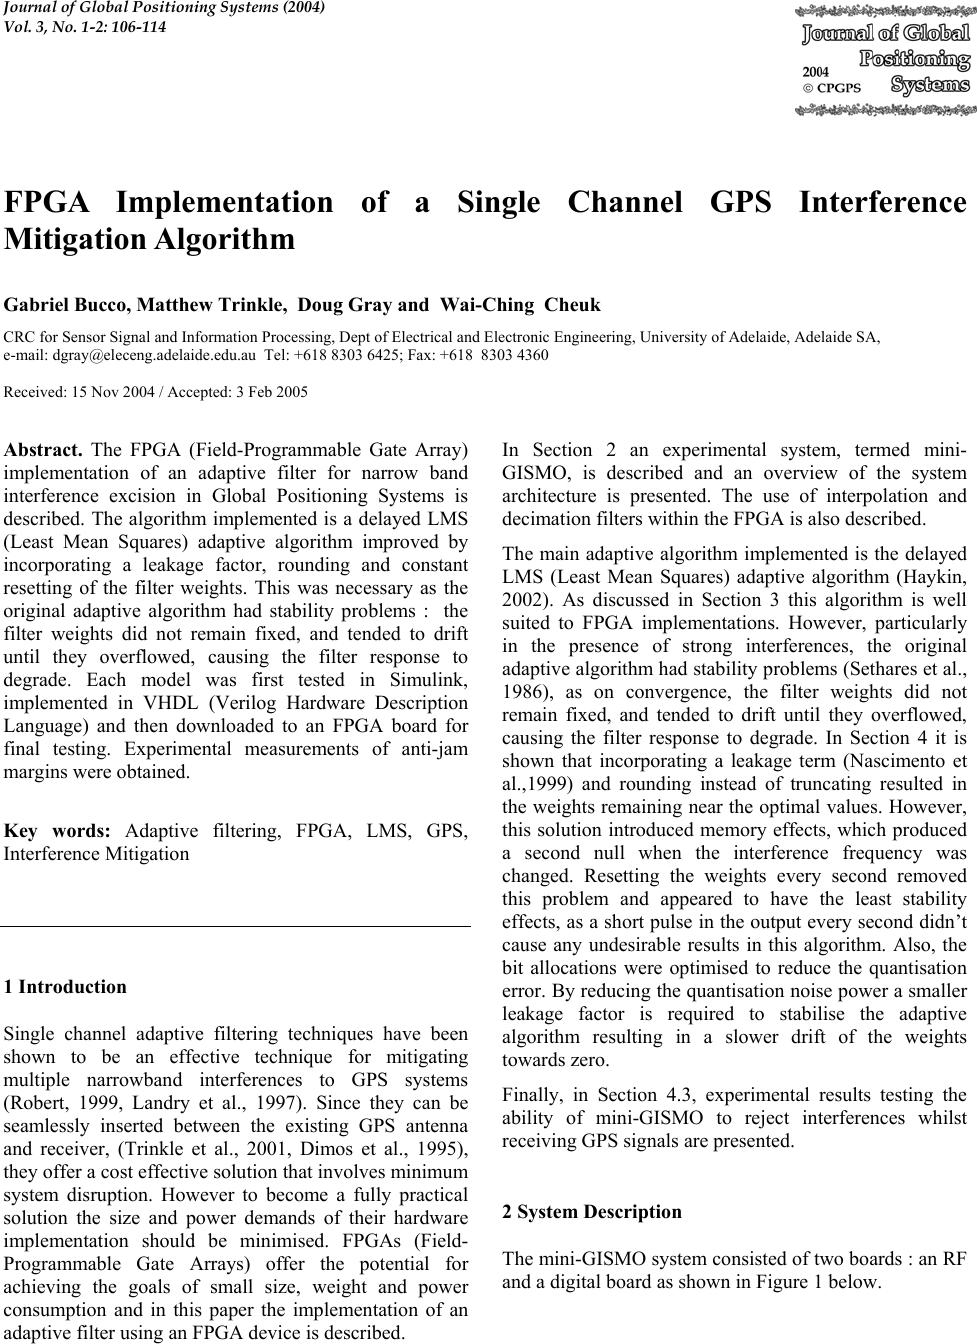 Journal of Global Positioning Systems (2004) Vol. 3, No. 1-2: 106-114 FPGA Implementation of a Single Channel GPS Interference Mitigation Algorithm Gabriel Bucco, Matthew Trinkle, Doug Gray and Wai-Ching Cheuk CRC for Sensor Signal and Inf ormation Processing, Dept of Electrical and Electronic Engineering, University of Adelaide, Adelaide SA, e-mail: dgray@eleceng.adelaide.edu.au Tel: +618 8303 6425; Fax: +618 8303 4360 Received: 15 Nov 2004 / Accepted: 3 Feb 2005 Abstract. The FPGA (Field-Programmable Gate Array) implementation of an adaptive filter for narrow band interference excision in Global Positioning Systems is described. The algorithm implemented is a delayed LMS (Least Mean Squares) adaptive algorithm improved by incorporating a leakage factor, rounding and constant resetting of the filter weights. This was necessary as the original adaptive algorithm had stability problems : the filter weights did not remain fixed, and tended to drift until they overflowed, causing the filter response to degrade. Each model was first tested in Simulink, implemented in VHDL (Verilog Hardware Description Language) and then downloaded to an FPGA board for final testing. Experimental measurements of anti-jam margins we re obt ained. Key words: Adaptive filtering, FPGA, LMS, GPS, Interference Mitigation 1 Introduction Single channel adaptive filtering techniques have been shown to be an effective technique for mitigating multiple narrowband interferences to GPS systems (Robert, 1999, Landry et al., 1997). Since they can be seamlessly inserted between the existing GPS antenna and receiver, (Trinkle et al., 2001, Dimos et al., 1995), they offer a cost effective solution that involves minimum system disruption. However to become a fully practical solution the size and power demands of their hardware implementation should be minimised. FPGAs (Field- Programmable Gate Arrays) offer the potential for achieving the goals of small size, weight and power consumption and in this paper the implementation of an adaptive filter using an FPGA device is d escribed. In Section 2 an experimental system, termed mini- GISMO, is described and an overview of the system architecture is presented. The use of interpolation and decimation filters within the FPGA is also described. The main adaptive algorithm implemented is the delayed LMS (Least Mean Squares) adaptive algorithm (Haykin, 2002). As discussed in Section 3 this algorithm is well suited to FPGA implementations. However, particularly in the presence of strong interferences, the original adaptive algorithm had stability pro blems (Sethares et al., 1986), as on convergence, the filter weights did not remain fixed, and tended to drift until they overflowed, causing the filter response to degrade. In Section 4 it is shown that incorporating a leakage term (Nascimento et al.,1999) and rounding instead of truncating resulted in the weights remaining near the optimal values. However, this solution introduced memory effects, which produced a second null when the interference frequency was changed. Resetting the weights every second removed this problem and appeared to have the least stability effects, as a short pulse in the output every second didn’t cause any undesirable results in this algorithm. Also, the bit allocations were optimised to reduce the quantisation error. By reducing the quan tisation noise power a smaller leakage factor is required to stabilise the adaptive algorithm resulting in a slower drift of the weights towards zero. Finally, in Section 4.3, experimental results testing the ability of mini-GISMO to reject interferences whilst receiving GPS signals are presented. 2 System Description The mini-GISMO system consisted of two boards : an RF and a digital board as shown in Figure 1 below. 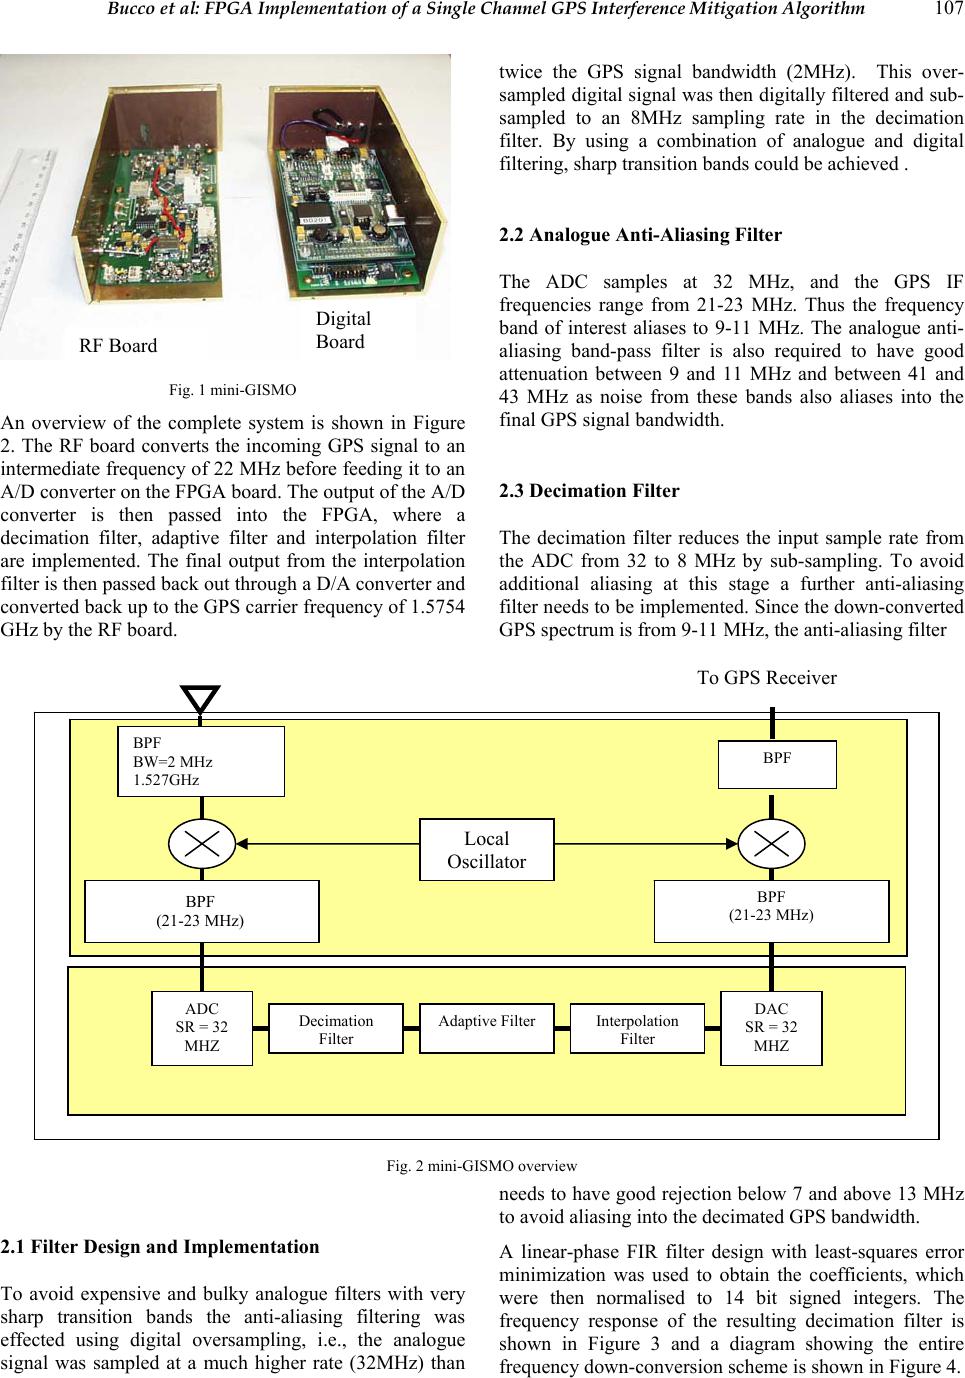 Bucco et al: FPGA Implementation of a Single Channel GPS Interference Mitigation Algorithm 107 Fig. 1 mini-GISMO An overview of the complete system is shown in Figure 2. The RF board converts the incoming GPS signal to an intermediate frequency of 22 MHz before feeding it to an A/D converter on the FPGA board. The output of the A/D converter is then passed into the FPGA, where a decimation filter, adaptive filter and interpolation filter are implemented. The final output from the interpolation filter is then passed back out through a D/A converter and converted b ack up to th e GPS carrier frequ ency of 1.5754 GHz by the RF board. 2.1 Filter Design and Implementation To avoid expensive and bulky analogue filters with very sharp transition bands the anti-aliasing filtering was effected using digital oversampling, i.e., the analogue signal was sampled at a much higher rate (32MHz) than twice the GPS signal bandwidth (2MHz). This over- sampled digital signal was then digitally filtered and sub- sampled to an 8MHz sampling rate in the decimation filter. By using a combination of analogue and digital filtering, sharp transition bands could b e achieved . 2.2 Analo gue Ant i-Aliasi ng Filter The ADC samples at 32 MHz, and the GPS IF frequencies range from 21-23 MHz. Thus the frequency band of interest aliases to 9-11 MHz. The analogue anti- aliasing band-pass filter is also required to have good attenuation between 9 and 11 MHz and between 41 and 43 MHz as noise from these bands also aliases into the final GPS signal bandwidth. 2.3 Decimation Filter The decimation filter reduces the input sample rate from the ADC from 32 to 8 MHz by sub-sampling. To avoid additional aliasing at this stage a further anti-aliasing filter needs to be implemented. Since the down-converted GPS spectrum is from 9-11 MHz, the anti-aliasing filter needs to have good rejection below 7 and above 13 MHz to avoid aliasing into the decimated GPS bandwidth. A linear-phase FIR filter design with least-squares error minimization was used to obtain the coefficients, which were then normalised to 14 bit signed integers. The frequency response of the resulting decimation filter is shown in Figure 3 and a diagram showing the entire frequency down-conversion scheme is shown in Figure 4. RF Board Digital Board BPF (21- 23 M H z) ADC SR = 32 MHZ Decimation Filte r Adaptive Filter Interpolation Filte r BPF (21-23 MHz) DAC SR = 32 MHZ To GPS Receiver Local Oscillato r BPF BW=2 MHz 1.527GHz BPF Fig. 2 mini-GISMO overview 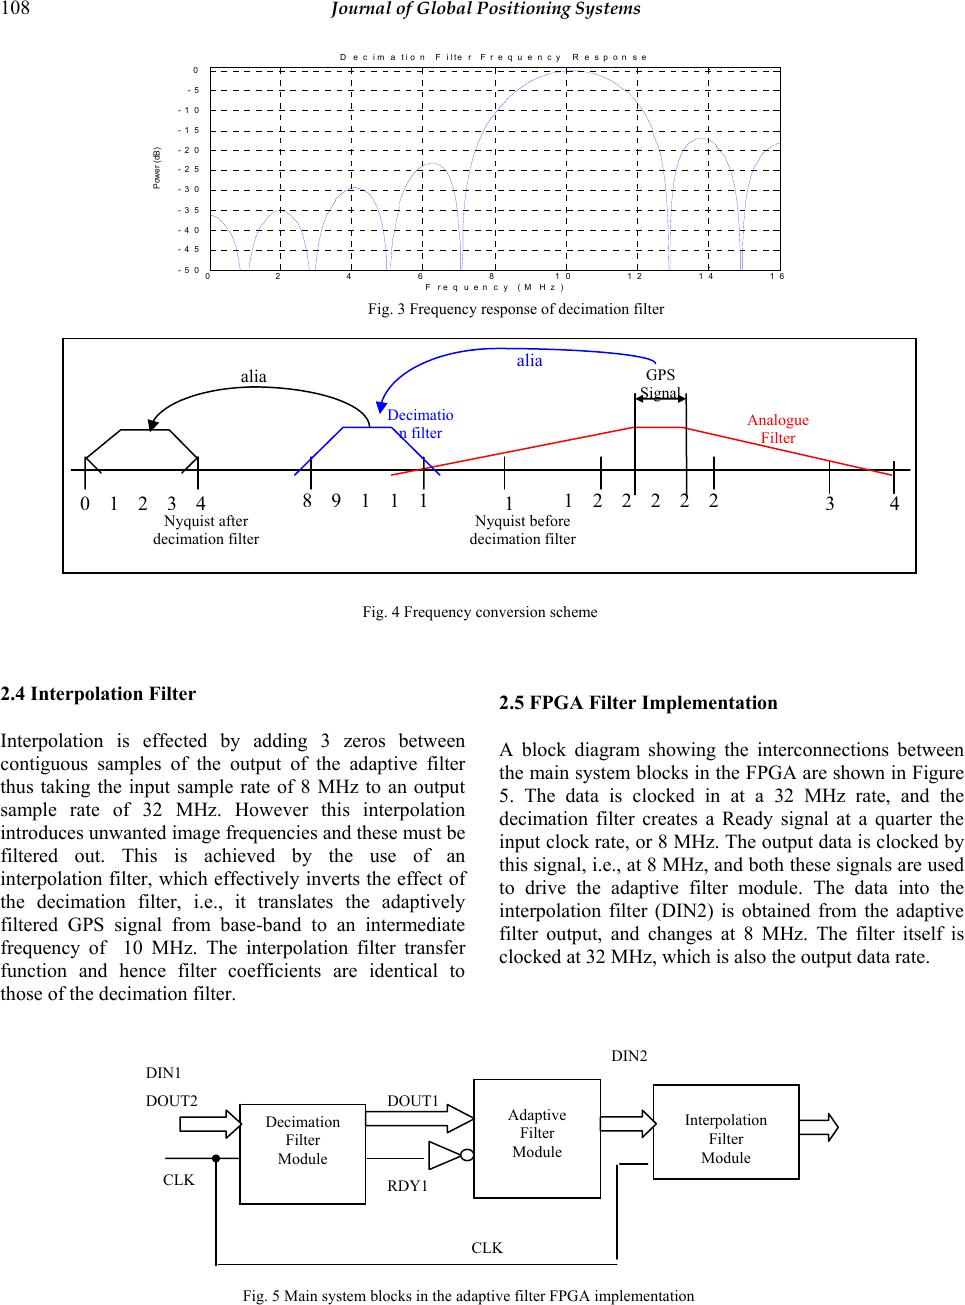 108 Journal of Global Positioning Systems 2.4 Interpolation Filter Interpolation is effected by adding 3 zeros between contiguous samples of the output of the adaptive filter thus taking the input sample rate of 8 MHz to an output sample rate of 32 MHz. However this interpolation introduces unwanted image frequencies and these must be filtered out. This is achieved by the use of an interpolation filter, which effectively inverts the effect of the decimation filter, i.e., it translates the adaptively filtered GPS signal from base-band to an intermediate frequency of 10 MHz. The interpolation filter transfer function and hence filter coefficients are identical to those of the decimation filter. 2.5 FPGA Filter Implementation A block diagram showing the interconnections between the main system blocks in the FPGA are shown in Figure 5. The data is clocked in at a 32 MHz rate, and the decimation filter creates a Ready signal at a quarter the input clock rate, or 8 MHz. The output data is clocked by this signal, i.e., at 8 MHz, and both these signals are used to drive the adaptive filter module. The data into the interpolation filter (DIN2) is obtained from the adaptive filter output, and changes at 8 MHz. The filter itself is clocked at 32 MHz, which is also the output data rate. 02 4 6 810 12 14 16 -50 -45 -40 -35 -30 -25 -20 -15 -10 -5 0 Frequency (M Hz) Power (dB) Decimation Filter Frequency Response 3 2 1 2 2 2 2 4 2 1 0 3 1 1 9 8 1 1 4 GPS Si g nal Nyquist before decimation filte r Nyquist after decimation filte r Analogue Filte r Decimatio n filter alia alia DIN2 Decimation Filter Module Adaptive Filter Module Interpolation Filter Module DIN1 DOUT2 RDY1 DOUT1 CL K CL K Fig. 3 Frequency response of decimation filter Fig. 4 Frequency conversion scheme Fig. 5 Main system blocks in the adaptive filter FPGA implementation  Bucco et al: FPGA Implementation of a Single Channel GPS Interference Mitigation Algorithm 109 2.6 FPGA Decimation/Interpolation Filter Testing The frequency responses of the decimation/interpolation filter were measured by passing white noise into the system and measuring the output spectrum. The results are shown in Figure 6 where the power spectrum of the input ‘white noise’ is shown in black and the output spectrum in blue. The input white noise spectrum is measured after the analogue anti-aliasing filter. The results show that the filters give at least 15-20 dB of attenuation from the pa ss-band to the cut-off regions. Att 20 dB * B Ref-10 dBm 3.1 MHz/Start1 MHzStop32 MHz * * RBW 30 kHz VBW 300 Hz SWT 3.5 s 1 AP V IEW * 2 AP CLRW R PRN -110 -100 -90 -80 -70 -60 -50 -40 -30 -20 -10 1 Marker 1 [T1 ] -49.58 dBm 22.000000000 MHz 2 Delta 2 [T1 ] -6.01 dB 1.000000000 MHz 3 Delta 3 [T1 ] -2.95 dB -1.000000000 MHz ↑ D1 0 dBm D2 -100 dBm F1 Date: 28.OCT.2003 09:58:25 Figure 6 Output power of interpolation f ilter when input is w hite noise A comparison of Figure 3 (theoretical) and Figure 6 (measured) indicate a good agreement, allowing for the appropriate shifts of the frequency axis, as the attenuation side lobe levels appear consistent. The insert in Figure 6 shows an expanded view of the frequency response in the pass-band of the decimation/interpolation filter. Whilst it shows that the attenuation in the 21-23 MHz pass-band is quite flat, the attenuation at the edges reaches almost 3dB on one side, and 5.5dB on the other side, which is a bit uneven. The response could be improved by adding more taps, but due to space limitations on the FPGA, the limit was set to 13 taps. 3 Adaptive Filter The adaptive filter implemented in the FPGA is the symmetric delayed LMS adaptive prediction-filtering algorithm, shown in Figure 7 below. The implementation of the LMS algorithm for updating the filter weights is a modified version of the leaky LMS leakage algorithm that also included periodic re-initialisation of the weights. 3.1 Adaptive Filter FPGA Implementation The Adaptive Filter was implemented in schematic VHDL using four main blocks as illustrated in Figure 8. The following diagram shows these blocks, the Coefficient Update Block, the Input Signal Delay Block, the FIR Algorithm Block and the Tree Adder Block. Each of the modules carries out the following operations Coefficient Update Block : Updates weights using a variant of the LMS algorithm and scalings. Input Signal Delay Block : Delays input signal according to a 33 tap symmetric FIR filter. FIR Algorithm Block : Carries out weight vector multiplications and scalings Tree Adder Block : Carries out summations When designing the scaling both truncation and rounding were investigated. Input signal spectrum Output signal spectrum Att 20 dB * CLRW R B Ref-10 dBm 500 kHz/Center22 MHzSpan5 MHz * * RBW 30 kHz VBW 300 Hz SWT 1.15 s 1 AP PRN -110 -100 -90 -80 -70 -60 -50 -40 -30 -20 -10 1 Marker 1 [T1 ] -50.93 dBm 22.000000000 MHz 2 Delta 2 [T1 ] -5.54 dB 1.000000000 MHz 3 Delta 3 [T1 ] -2.72 dB -1.000000000 MHz ↑ D1 0 dBm D2 -100 dBm ← F 1 Date: 28.OCT.2003 09:45:09 Pass- band expa nded  110 Journal of Global Positioning Systems s[k] x 1(k) xN-1(k) µ w 1 w2 wN-1 wN e[k] Filter output Fig. 7 Symmetric Adaptive Prediction Filter 4. Adaptive Filter Development and Testing The adaptive filter was first tested using a Simulink model to evaluate the effect of various quantisation schemes, (Sherwood et al., 1987), convergence times and weight vector drift. Then the VHDL code was downloaded onto the FPGA and the experimental system was evaluated. These results are presented in the following sections. 4.1 Simulink T e st s The adaptive filter uses 33 taps and has a sampling rate of 8 MHz, thus the convergence time should be between 10.8µs and 21.7µs for typical interferences. Whilst Simulink analysis confirmed convergence times of around 20µs it also confirmed that weight vector drift, due to finite precision arithmetic, in the standard delayed LMS algorithm was a serious problem. The drift caused most of the weights to become very large, thus distorting the frequency response of the filter. This is illustrated in Figure 9 below where the transfer function of the standard delayed LMS adaptive filter is plo tted over a 10 second period. + d[k] y[k] Z-1 Z-1 Z-1 Z-1 Z-1 Z-1 + + + + x xx x + + x LMS update algorithm with leakage µ 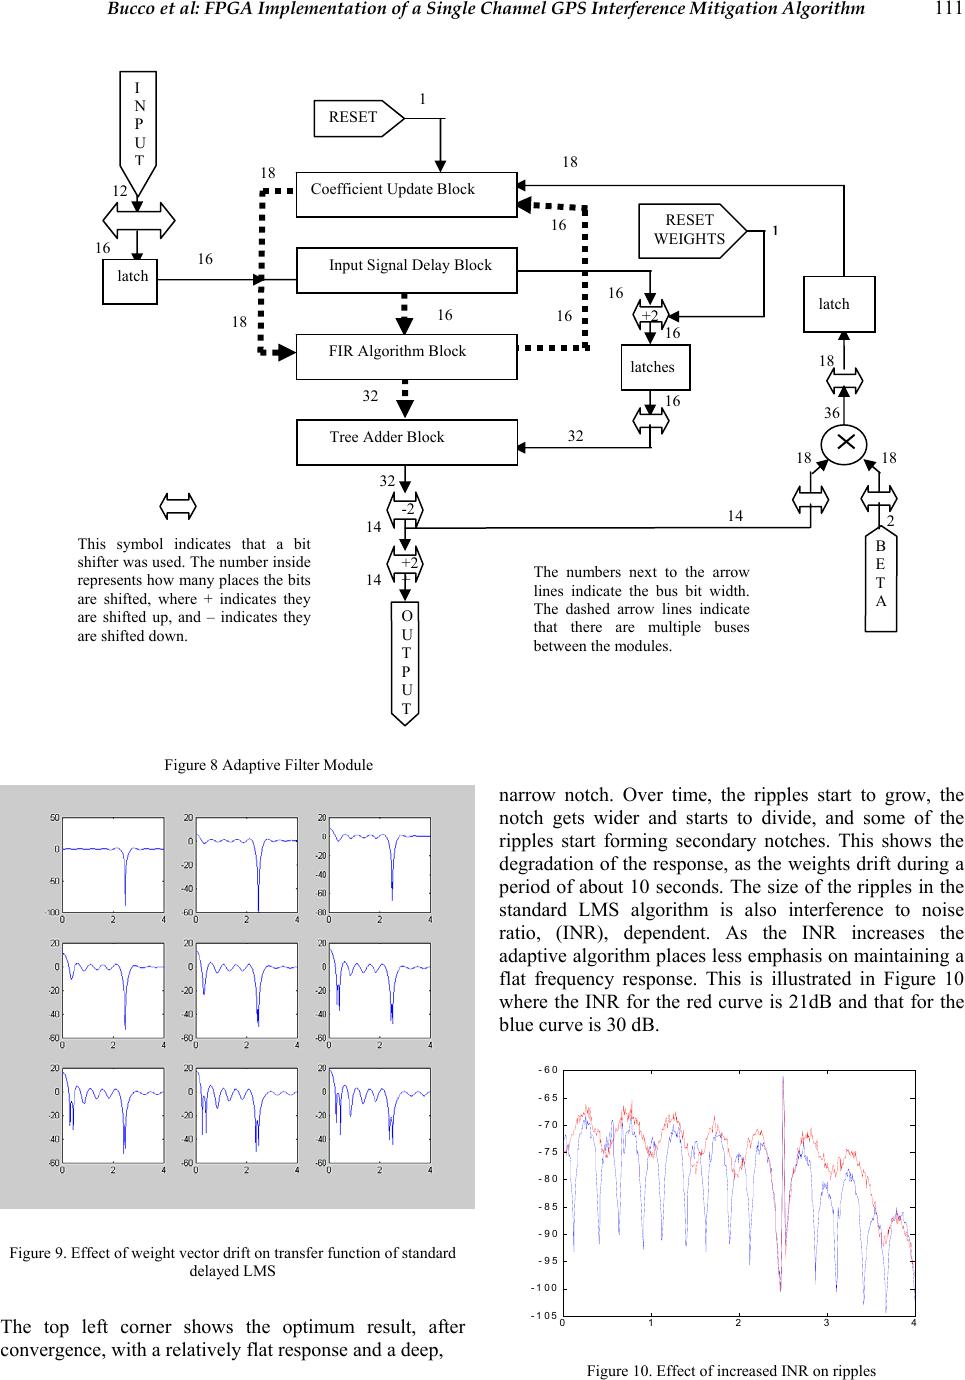 Bucco et al: FPGA Implementation of a Single Channel GPS Interference Mitigation Algorithm 111 Figure 8 Adaptive Filter Module Figure 9. Effect of weight vecto r drift on transfer fu nc ti on of standard delayed LMS The top left corner shows the optimum result, after convergence, with a relatively flat response and a deep, narrow notch. Over time, the ripples start to grow, the notch gets wider and starts to divide, and some of the ripples start forming secondary notches. This shows the degradation of the response, as the weights drift during a period of about 10 seconds. The size of the ripples in the standard LMS algorithm is also interference to noise ratio, (INR), dependent. As the INR increases the adaptive algorithm places less emphasis on maintaining a flat frequency response. This is illustrated in Figure 10 where the INR for the red curve is 21dB and that for the blue curve is 30 dB. 01 23 4 -105 -100 -95 -90 -85 -80 -75 -70 -65 -60 Figure 10. Effect of increased INR on ripples This symbol indicates that a bit shifter was used. The number inside represents how many places the bits are shifted, where + indicates they are shifted up, and – indicates they are shifted down. RESET WEIGHTS latch 1 B E T A 2 18 16 16 18 1 latches The numbers next to the arrow lines indicate the bus bit width. The dashed arrow lines indicate that there are multiple buses between the modules . Tree Adder Block 32 18 FIR Algorithm Block 16 RESET Input Signal Delay Block 1 8 1 Coefficient Update Blo c k I N P U T latch 12 16 16 O U T P U T 32 14 14 + -2 +2 32 +2 16 36 16 16 18 1 8 14  112 Journal of Global Positioning Systems One way of minimizing weight vector drift investigated was to use a modified version of the leaky LMS algorithm. The effect of the leakage term is to eventually draw the weights towards zero, preventing them from overflowing. Simulink analysis confirmed this behaviour. However whilst this approach is good in the short term, over a long period of several seconds many components of the weight vectors get drawn to zero, reducing the effective number of filter taps. Thus although the sharp null-steering capability is retained, a lumpier frequency response curve results. This is illu strated below in Figure 11. The behaviour of the leaky algorithm was not found to be strongly dependent on the INR. Figure 11. Effect of weight ve c to r drift on transfer funct i on of delayed LMS with leakage. Rounding rather than truncation was also investigated and found to be particularly effective in reducing weight vector drift. Truncation always pulls the numbers in the same direction, causing the weights to also start drifting in the same direction, whereas the random nature of rounding keeps the weights oscillating around a constant value. Thus in theory, rounding should mitigate weight vector drift as it removes the biased nature of truncation. 4.2 FPGA Tests The leaky adaptive filter code incorporating leakage was downloaded onto the FPGA board, and an interference signal with an INR of 21 dB was used. The output of the mini-GISMO system was input to a spectrum analyser and spectra were recorded approximately every second. During the collection period of about 10 mins the frequency of the interference was varied to check how the adaptive filter handled a chang ing interference frequen cy. In the results presented below the logged spectra are plotted as a colour image with the horizontal axis representing frequency bins, the vertical axis time and the intensity is colour coded with the colour bar indicating strength in dBs. Figure 12 presents results obtained implementing the delayed LMS algorithm with leakage. The results show that although the leakage term has been effective in reducing weight vector drift thus maintaining cancellation of the interference, the spectrum still has a number of deep ripples (red) and rolls off on the right faster (blue) than on the left. However, the notch appears to be quite narrow, quickly tracks and effectively knocks out the interference signal. Figure 12. FPGA results - d el ay e d LMS with leakage As discussed in Section 4.1 rounding with no leakage was particularly effective in reducing weight vector drift whilst maintaining a flat frequency response. This was tested using the mini-GISMO system with an interference whose INR was 30dB. The results, Figure 13, indicate the output spectrum is flatter than that of Figure 11 but the filter now exhibits a relatively long memory effect, maintaining a notch at the previous interference frequency for some time and only slowly converging to the new interference frequency. As the INR increased this memory effect was found to become more prominent. That is, as the time taken for the notches to combine increases, the response became less flat and the notch less sharp. Figure 13. FPGA results - delayed LMS with rounding  Bucco et al: FPGA Implementation of a Single Channel GPS Interference Mitigation Algorithm 113 4.3 Mini-GISMO Imple mentation and Testing The investigations detailed in Section 4.2 indicated that whilst either adding a leakage term and modifying the quantisation scheme reduced the effect of weight vector drift, there were disadvantages to both approaches. The scheme chosen for the final implementation was the following combination of the above approaches. (a) A leakage term was used. (b) The weights were reset to zero every second. (c) Due to FPGA capacity constraints combined rounding and leakage was not implemented. However a detailed analysis of the quantisation effects of the LMS algorithm was carried out and an improved bit allocation scheme, which lowered the quantisation noise due to tru ncation, was adopted. This reduced the effect of frequency r esp o nse deteriora t i on o ver time. A typical example of the power spectrum for two different INRs is shown in Figure 14. Figure 14. FPGA results – optimised algorithm The frequency responses when the interference signal is at the same frequency but different power levels are shown. Both interference power levels give a similar result, apart from a deeper notch for the stronger interference. The responses are relatively flat, without any extra ripples or notches forming in the pass-band region This adaptive algorithm was download ed onto the PROM and testing was carried out with mini-GISMO inserted between an antenna and a small GPS receiver. An insertion loss of approximately 3dB was measured by measuring the GPS signal strengths prior to and after insertion of mini-GISMO. A continuous-wave interference was added to the antenna output prior to the mini-GISMO and the output spectrum was logged. The results for a changing interference frequency of power –60dBm are illustrated in Figure 15. The spectra are relatively flat, the notch is quite narrow and is quite deep. However there is still some residual distortion and ripple around the notch frequency as seen by the cyan colouring. This distortion was worse when the interference frequency was close to the centre of the pass- band however this did not seem to cause a significant loss in GPS signal strength as the receiver was still able to maintain lock on the satellite sign a ls. Figure 15. mini-GISMO results –interference power of –60dBm In a separate test the strengths of four GPS signals in the presence of –60dBm and –70dBm interferences were recorded as the frequency of the interference was changed. These results are plotted in Figure 16 below. Figure 16. Measured GPS signal strengths as int erference frequency was changed The GPS signal strengths were averaged and normalised by the signal strength in the absence of the interference. These results indicated that the system whilst effectively cancelling the interference was causing a loss in the GPS signal strength varying from 0dB at the band edges to –5 dB at the centre of the band. This variation across the band is probably due to the adaptive filter attempting to flatten the coloured response across the pass-band caused by the decimation filter and resulted in an apparent gain when the interference frequency was at the high end of the pass-band. Finally the anti-jam gain of mini-GISMO was measured by comparing the interference power levels at which an Interference Power 50 mV rms, 210 mV rms  114 Journal of Global Positioning Systems unprotected and protected receiver lost lock on the GPS signals. Without mini-GISMO the GPS receiver lost lo ck when the interference po wer level was greater than about –95 to -90dBm whilst with mini-GISMO inserted the threshold was about –57 dBm indicating that mini- GISMO provided about 35dB of anti-jam gain. 5 Conclusion s The single channel delayed LMS ad aptive algorithm is an effective technique for removing narrow-band interfering signals from GPS receivers. It can be effectively implemented using FPGA technology that can be seamlessly inserted between a GPS antenna and receiver. Measurements indicate that the experimental mini- GISMO system can provide around 35dB of anti-jam gain against such interferences. Careful design of the delayed LMS algorithm was required to prevent overflows due to weight vector drift. Several improvements were tested and the results showed that incorporating a leakage factor, replacing truncation by rounding and periodically resetting the weights all contributed to mitigating this problem. In the final FPGA implementation resetting the weights every second, incorporating a leakage factor and careful allocation of the bit allocations when truncating produc ed good results. References Robert S. (1999): The Impact of Interference on Civil GPS. ION 55th Annual Meeting, June 1999 pp. 821-828 Landry R.; Renard A. (1997) Analysis of Potential Interference Sources and Assessment of Present Solutions For GPS/GNSS Receivers, 4th Saint-Petersburg International Conference on Integrated Navigation Systems, May 1997. Trinkle M.; Gray D. (2001) GPS Interference Mitigation; Overview and experimental Results. SatNav 2001, July, 2001. Dimos G.; Upadhyay T.; Jenkins T. (1995) Low-Cost Solution to Narrowband GPS Interference Problem Proc IEEE 1995 Naecon Meeting, vol I pp145-153 May 1995. Haykin S. (2002) Adaptive Filter Theory 4th Edition, Prentice Hall. Sethares W.; Lawrence D.; Johnson C.;, Bitmead R.; (1986) Parameter Drift in LMS Adaptive Filters IEEE Transactions on Acoustic, Speech and Signal Processing Vol. ASSP-34, No 4, August 1986. Nascimento V.; Sayed A. (1999) Unbiased and Stable Leakage-Based Adaptive Filter IEEE Transactions on Signal Processing, Vol. 47, No. 12 December 1999. Sherwood D.; Bershad N. (1987) Quantization effect in the Complex LMS Adaptive Algorithm: Linearization Using Dither-Theory IEEE Transaction on Circuits and System, Vol. CAS-34, No. 7, July 1987. |