 Journal of Minerals and Materials Characterization and Engineering, 2012, 11, 1085-1094 Published Online November 2012 (http://www.SciRP.org/journal/jmmce) Wear Behaviour of Al-SiCp Metal Matrix Composites and Optimization Using Taguchi Method and Grey Relational Analysis Shouvik Ghosh, *Prasanta Sahoo, Goutam Sutradhar Department of Mechanical Engineering, Jadavpur University, Kolkata, India Email: *psjume@gmail.com Received July 25, 2012; revised August 28, 2012; accepted September 7, 2012 ABSTRACT Aluminium metal matrix composite is a relatively new material that has proved its position in automobile, aerospace and other engineering design applications due to its wear resistance and substantial hardness. Need for improved tri- bological performance has led to the design and selection of newer variants of the composite. The present investigation deals with the study of wear behaviour of Al-SiCp metal matrix composite for varying reinforcement content, applied load, sliding speed and time. Aluminium metal matrix composites reinforced with SiC particles are prepared by liquid metallurgy route using LM6 alumin ium alloy an d silicon carb ide particles (size ~ 37 µm) by varying the weight fraction of SiC in the range of 5% - 10%. The material is synthesized by stir casting process in an electric melting furnace. The materials are then subjected to wear testing in a multitribotester using block on roller configuration. A plan of experi- ments based on L27 Taguchi orthogonal array is used to acq uire the wear data in a controlled way. An analysis of vari- ance is employed to investigate the influence of four controlling parameters, viz., SiC content, normal load, sliding speed and sliding time on dry sliding wear of the compos ites. It is observed that SiC conten t, sliding speed and normal load significantly affect the dry sliding wear. The optimal combination of the four controlling parameters is also ob- tained for minimum wear. The microstructure study of worn surfaces indicates nature of wear to be mostly abrasive. Keywords: Metal Matrix Composite; Al-SiCp; Wear; Optimization; Grey-Taguchi 1. Introduction Metal Matrix Composites (MMC) synthesized by incor- porating hard ceramic particles like Silicon Carbide (SiC) into aluminium alloys achieve good mechanical proper- ties. These composites are both light weight and show good hardness property which qualifies it as structural material especially for wear resistant and weight critical applications. Such applications motivate researchers to study the wear behaviour of this category of metal matrix composites. The composites are synthesized by different techniques but mostly pressure infiltration technique [1], powder metallurgy [2-6] and stir casting techniques [7-9] are used. Researchers in general consider the volume fraction of reinforcement silicon carbide in the range of 0% - 30% [2-21]. Some researchers have used higher volume frac- tion in the range of 60% [1] and 10% - 40% [19,20]. The wear tests are conducted by varying applied load and sliding speed. Al-Rubaie et al. [2,3] studied the abra- sive wear behaviour of Al-SiC MMC by varying the volume fraction of SiC reinforcement in the range of 5% - 20% and particle size 10, 27 and 43 µm. Thus a varied range of abrasive study was conducted and the results showed that wear rates increase with increase in abrasive particle size but decreased with increase in volume frac- tion. Another abrasive wear test conducted by Ahlatci et al. [1] for varying particle size of Al2O3 abrasive particle infers that with increase in particle size of Al2O3 the wear rate increased. Thus the infiltration of SiC increases the abrasive wear resistance of the aluminium alloy. The effect of applied load on wear behaviour of Al- 5%SiC and Al-10%SiC was studied by Chen et al. [8]. The results suggested that with increase in volume frac- tion of reinforcement particle th e wear rate increased but with gradual increase in applied load the wear rates de- creased. Chen et al. [9] considered the effect of heat treat- ment on the fretting wear behaviour of Al-SiC MMC syn- thesized by reinforcing 15 vol% SiC in A356 aluminium alloy and observed that heat treatment of the composite increases the hardness of the mater ial thus increasing fret- ting wear resistance. Wear behaviour of Al-Mg-Cu alloy reinforced with SiC *Corresponding author. Copyright © 2012 SciRes. JMMCE 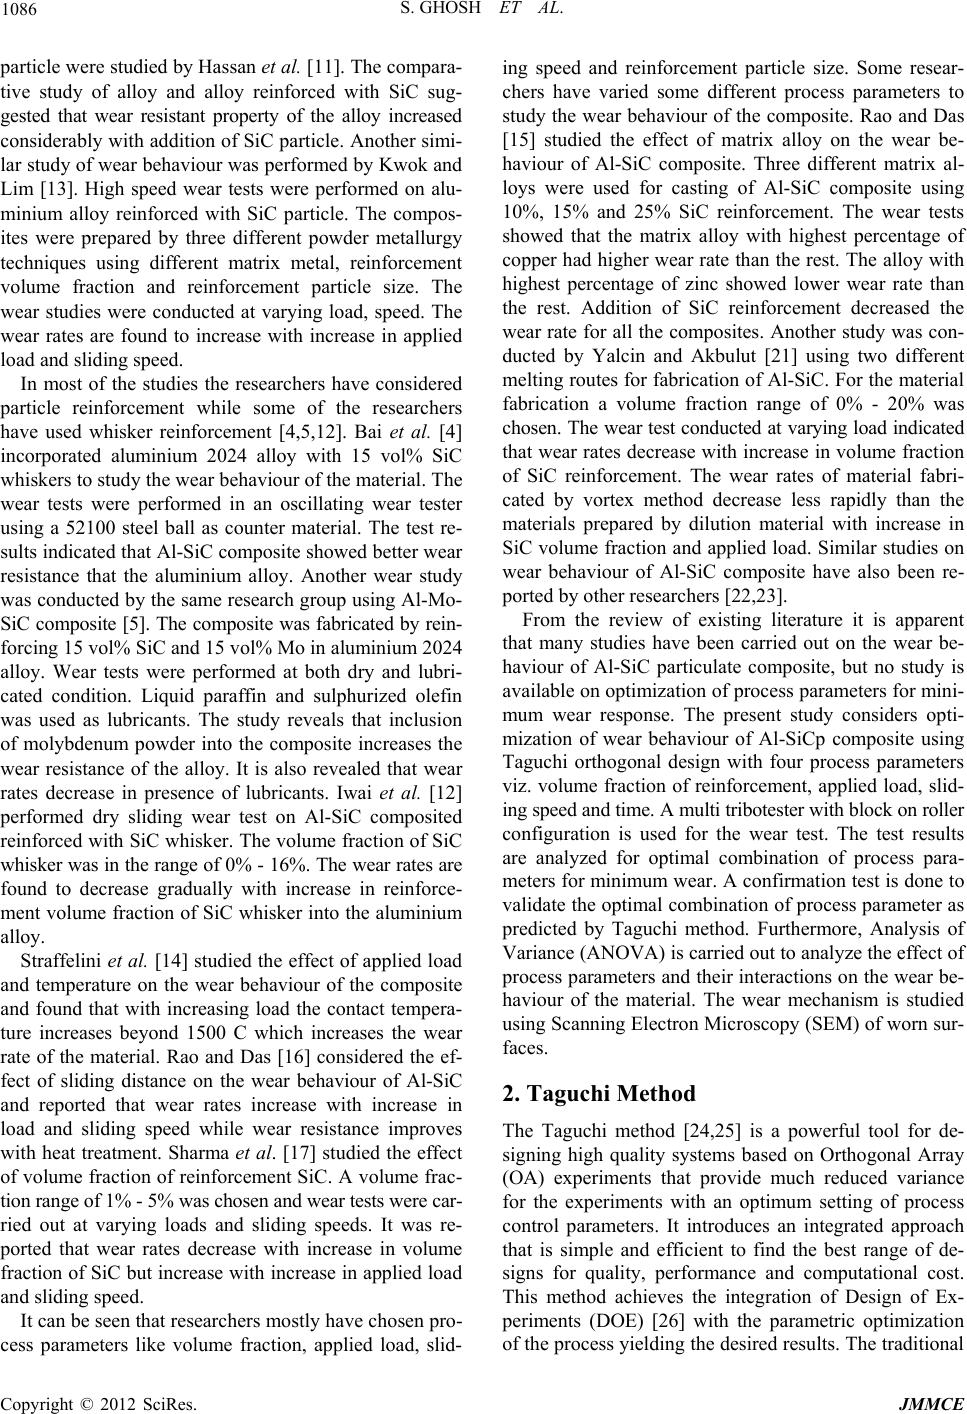 S. GHOSH ET AL. 1086 particle were studied by Hassan et al. [11]. The compara- tive study of alloy and alloy reinforced with SiC sug- gested that wear resistant property of the alloy increased considerably with addition of SiC particle. Another simi- lar study of wear behaviour was performed by Kwok and Lim [13]. High speed wear tests were performed on alu- minium alloy reinforced with SiC particle. The compos- ites were prepared by three different powder metallurgy techniques using different matrix metal, reinforcement volume fraction and reinforcement particle size. The wear studies were conducted at varying load, speed. The wear rates are found to increase with increase in applied load and sliding speed. In most of the studies the researchers have considered particle reinforcement while some of the researchers have used whisker reinforcement [4,5,12]. Bai et al. [4] incorporated aluminium 2024 alloy with 15 vol% SiC whiskers to study the wear behaviour of the material. The wear tests were performed in an oscillating wear tester using a 52100 steel ball as counter material. The test re- sults indicated that Al-SiC composite showed better wear resistance that the aluminium alloy. Another wear study was conducted b y the same research group using Al-Mo- SiC composite [5]. The composite was fabricated by rein- forcing 15 vol% SiC and 15 vol% Mo in aluminium 2024 alloy. Wear tests were performed at both dry and lubri- cated condition. Liquid paraffin and sulphurized olefin was used as lubricants. The study reveals that inclusion of molybdenum powder into the composite increases the wear resistance of the alloy. It is also revealed that wear rates decrease in presence of lubricants. Iwai et al. [12] performed dry sliding wear test on Al-SiC composited reinforced with SiC whisker. The volume fraction of SiC whisker was in the range of 0% - 16%. The wear rates are found to decrease gradually with increase in reinforce- ment volume fraction of SiC whisker into the aluminium alloy. Straffelini et al. [14] studied the effect of applied load and temperature on the wear behaviour of the composite and found that with increasing load the contact tempera- ture increases beyond 1500 C which increases the wear rate of the material. Rao and Das [16] considered the ef- fect of sliding distance on the wear behaviour of Al-SiC and reported that wear rates increase with increase in load and sliding speed while wear resistance improves with heat treatment. Sharma et al. [17] studied the effect of volume fraction of reinforcement SiC. A volume frac- tion range of 1% - 5% was chosen and wear t est s were car- ried out at varying loads and sliding speeds. It was re- ported that wear rates decrease with increase in volume fraction of SiC but increase with increase in applied load and sliding speed. It can be seen that researchers mostly have chosen pro- cess parameters like volume fraction, applied load, slid- ing speed and reinforcement particle size. Some resear- chers have varied some different process parameters to study the wear behaviour of the composite. Rao and Das [15] studied the effect of matrix alloy on the wear be- haviour of Al-SiC composite. Three different matrix al- loys were used for casting of Al-SiC composite using 10%, 15% and 25% SiC reinforcement. The wear tests showed that the matrix alloy with highest percentage of copper had higher wear rate than the rest. The allo y with highest percentage of zinc showed lower wear rate than the rest. Addition of SiC reinforcement decreased the wear rate for all the composites. Another study was con- ducted by Yalcin and Akbulut [21] using two different melting routes for fabricatio n of Al-SiC. For th e material fabrication a volume fraction range of 0% - 20% was chosen. The wear test conducted at varying load indicated that wear rates decrease with increase in volume fraction of SiC reinforcement. The wear rates of material fabri- cated by vortex method decrease less rapidly than the materials prepared by dilution material with increase in SiC volume fraction and applied load. Similar studies on wear behaviour of Al-SiC composite have also been re- ported by other researchers [22,23]. From the review of existing literature it is apparent that many studies have been carried out on the wear be- haviour of Al-SiC particulate composite, but no study is available on optimization of process parameters for mini- mum wear response. The present study considers opti- mization of wear behaviour of Al-SiCp composite using Taguchi orthogonal design with four process parameters viz. volume fraction of reinforcement, applied load, slid- ing speed and time. A multi tribotester with block on roller configuration is used for the wear test. The test results are analyzed for optimal combination of process para- meters for minimum wear. A confirmation test is done to validate the optimal combinatio n of process parameter as predicted by Taguchi method. Furthermore, Analysis of Variance (ANOVA) is carried out to analyze the effect of process parameters and their in teractions on the wear be- haviour of the material. The wear mechanism is studied using Scanning Electron Microscopy (SEM) of worn sur- faces. 2. Taguchi Method The Taguchi method [24,25] is a powerful tool for de- signing high quality systems based on Orthogonal Array (OA) experiments that provide much reduced variance for the experiments with an optimum setting of process control parameters. It introduces an integrated approach that is simple and efficient to find the best range of de- signs for quality, performance and computational cost. This method achieves the integration of Design of Ex- periments (DOE) [26] with the parametric optimization of the process yielding the desired results. Th e traditional Copyright © 2012 SciRes. JMMCE 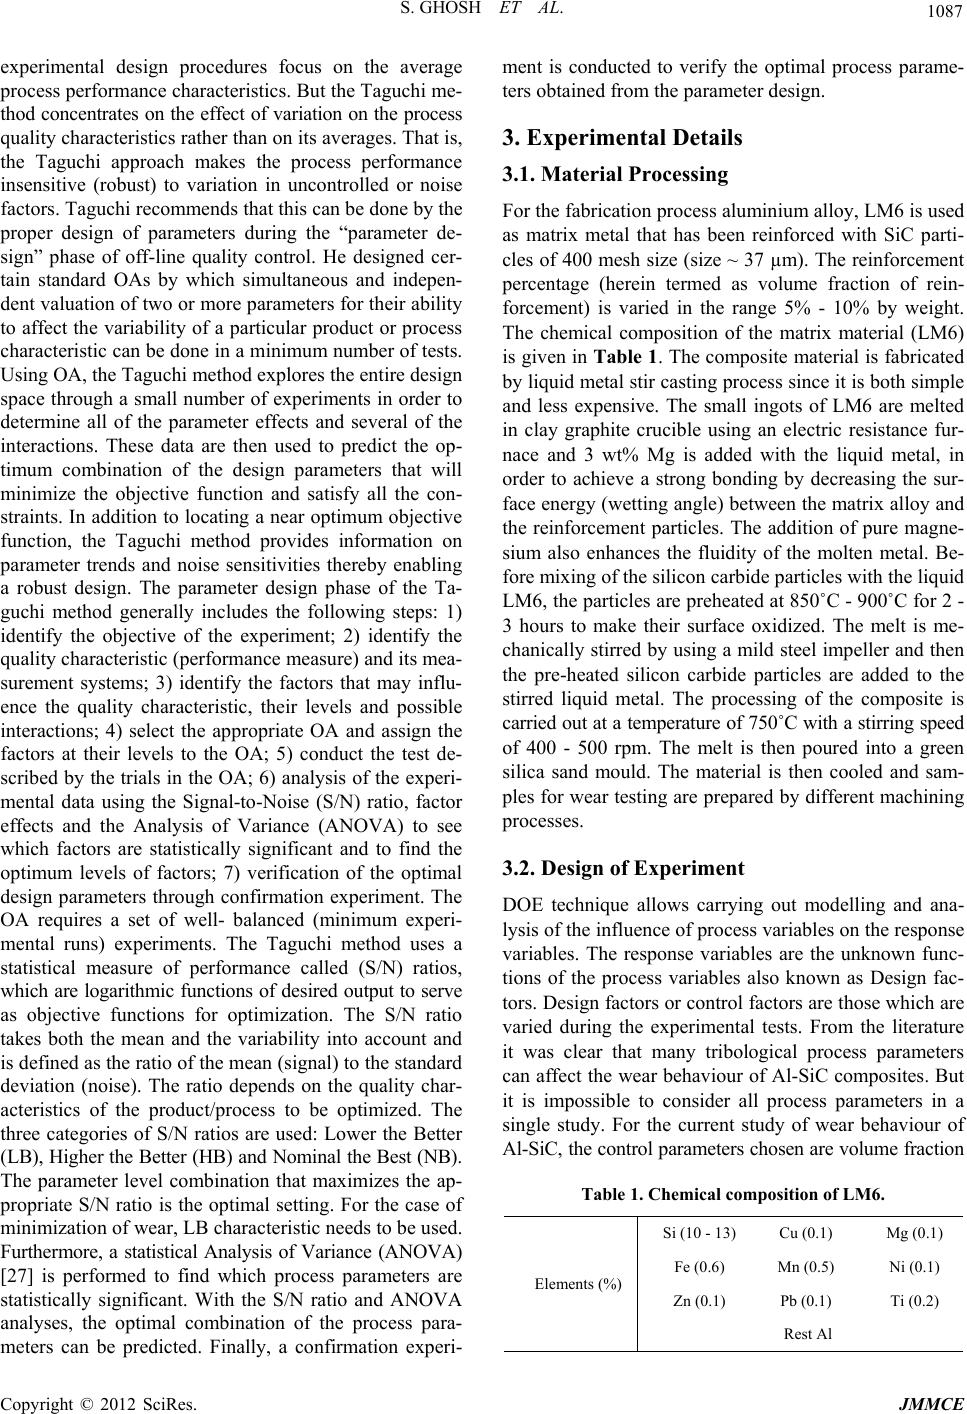 S. GHOSH ET AL. 1087 experimental design procedures focus on the average process performance characteristics. But the Taguchi me- thod concentrates on the effect of variation on the process quality characteristics rather than on its averages. That is, the Taguchi approach makes the process performance insensitive (robust) to variation in uncontrolled or noise factors. Taguchi recommends that this can be done by the proper design of parameters during the “parameter de- sign” phase of off-line quality control. He designed cer- tain standard OAs by which simultaneous and indepen- dent valuation of two or more parameters for their ab ility to affect the variability of a particular product or process characteristic can be done in a minimum number of tests. Using OA, the Taguchi method explores the entire design space through a small number of experiments in order to determine all of the parameter effects and several of the interactions. These data are then used to predict the op- timum combination of the design parameters that will minimize the objective function and satisfy all the con- straints. In addition to locating a near optimum objective function, the Taguchi method provides information on parameter trends and noise sensitivities thereby enabling a robust design. The parameter design phase of the Ta- guchi method generally includes the following steps: 1) identify the objective of the experiment; 2) identify the quality characteristic (performance measure) and its mea- surement systems; 3) identify the factors that may influ- ence the quality characteristic, their levels and possible interactions; 4) select the appropriate OA and assign the factors at their levels to the OA; 5) conduct the test de- scribed by the trials in the OA; 6) analysis of the experi- mental data using the Signal-to-Noise (S/N) ratio, factor effects and the Analysis of Variance (ANOVA) to see which factors are statistically significant and to find the optimum levels of factors; 7) verification of the optimal design parameters through confirmation experiment. The OA requires a set of well- balanced (minimum experi- mental runs) experiments. The Taguchi method uses a statistical measure of performance called (S/N) ratios, which are logarithmic functions of desired output to serve as objective functions for optimization. The S/N ratio takes both the mean and the variability into account and is defined as the ratio of the mean (signal) to the standard deviation (noise). The ratio depends on the quality char- acteristics of the product/process to be optimized. The three categories of S/N ratios are used: Lower the Better (LB), Higher th e Better (HB) and Nominal the Best (NB). The parameter level combination that maximizes the ap- propriate S/N ratio is the optimal setting. For the case of minimization of wear, LB characteristic needs to be used. Furthermore, a statistical Analysis of Variance (ANOVA) [27] is performed to find which process parameters are statistically significant. With the S/N ratio and ANOVA analyses, the optimal combination of the process para- meters can be predicted. Finally, a confirmation experi- ment is conducted to verify the optimal process parame- ters obtained from the parameter design. 3. Experimental Details 3.1. Material Processing For the fabrication process aluminium alloy, LM6 is used as matrix metal that has been reinforced with SiC parti- cles of 400 mesh size (size ~ 37 µm). The reinforcement percentage (herein termed as volume fraction of rein- forcement) is varied in the range 5% - 10% by weight. The chemical composition of the matrix material (LM6) is given in Table 1. The composite material is fabricated by liquid metal stir casting process since it is both simple and less expensive. The small ingots of LM6 are melted in clay graphite crucible using an electric resistance fur- nace and 3 wt% Mg is added with the liquid metal, in order to achieve a strong bonding by decreasing the sur- face energy (wetting angle) between the matrix alloy and the reinforcement particles. The addition of pure magne- sium also enhances the fluidity of the molten metal. Be- fore mixing of the silicon carbide particles with the liqu id LM6, the particles are preheated at 850˚C - 900˚C for 2 - 3 hours to make their surface oxidized. The melt is me- chanically stirred by using a mild steel impeller and then the pre-heated silicon carbide particles are added to the stirred liquid metal. The processing of the composite is carried out at a temperature of 750˚C with a stirrin g speed of 400 - 500 rpm. The melt is then poured into a green silica sand mould. The material is then cooled and sam- ples for wear testing are prepared by different machining processes. 3.2. Design of Experiment DOE technique allows carrying out modelling and ana- lysis of the influence of process variables on the response variables. The response variables are the unknown func- tions of the process variables also known as Design fac- tors. Design factors or control factors are those which are varied during the experimental tests. From the literature it was clear that many tribological process parameters can affect the wear behaviour of Al-SiC composites. But it is impossible to consider all process parameters in a single study. For the current study of wear behaviour of Al-SiC, the control parameters chosen are volume fraction Table 1. Chemical composition of LM6. Si (10 - 13) Cu (0.1) Mg (0.1) Fe (0.6) Mn (0.5) Ni (0.1) Zn (0.1) Pb (0.1) Ti (0.2) Elements (%) Rest Al Copyright © 2012 SciRes. JMMCE 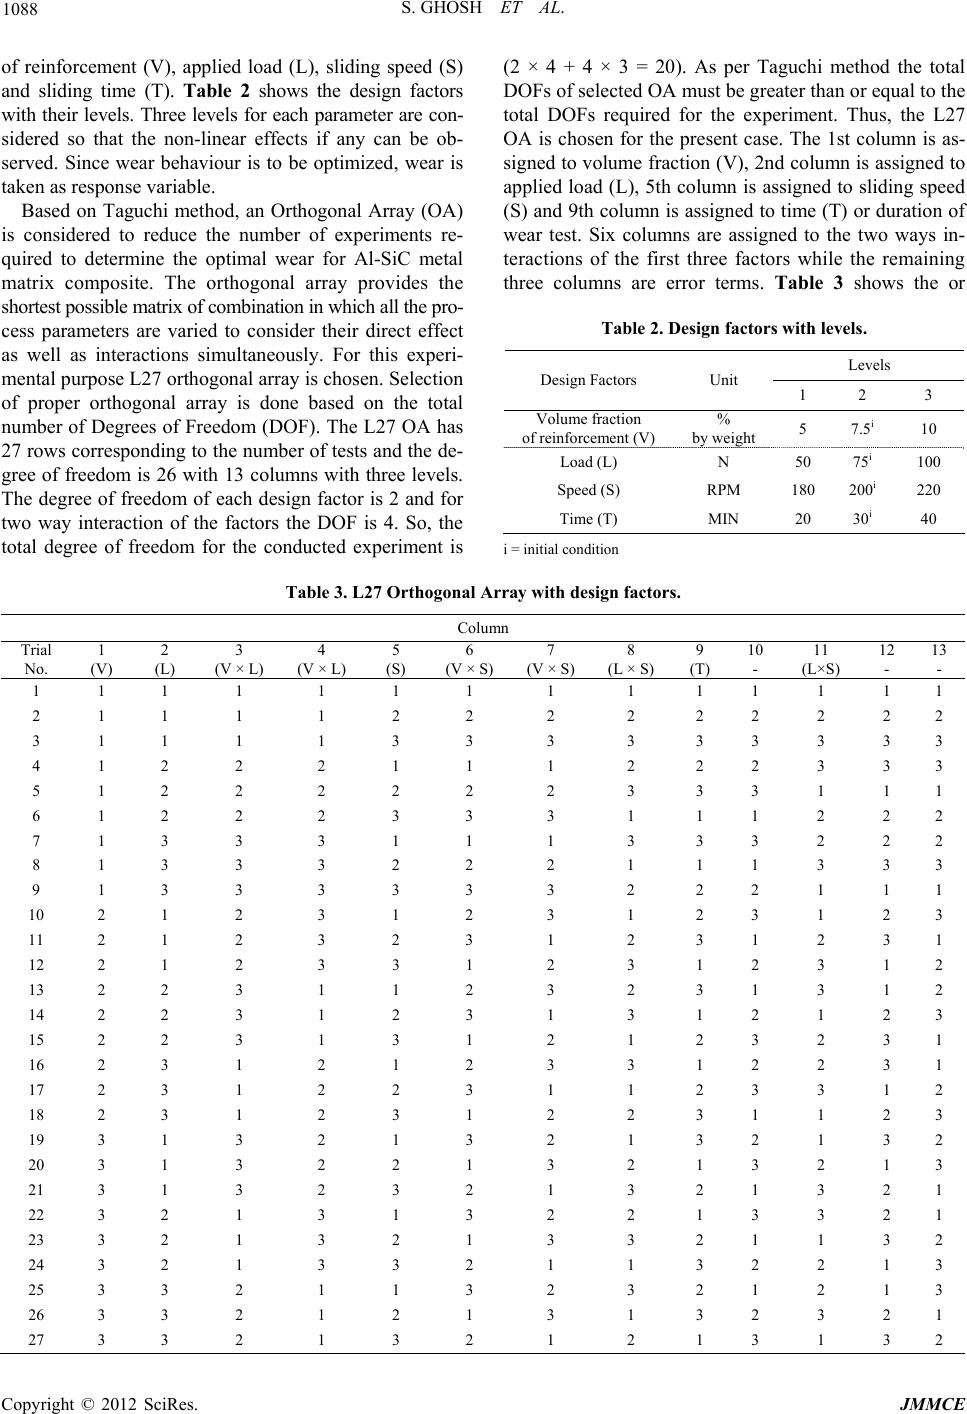 S. GHOSH ET AL. Copyright © 2012 SciRes. JMMCE 1088 of reinforcement (V), applied load (L), sliding speed (S) and sliding time (T). Table 2 shows the design factors with their levels. Three levels for each parameter are con- sidered so that the non-linear effects if any can be ob- served. Since wear behaviour is to be optimized, wear is taken as response variable. Based on Taguchi method, an Orthogonal Array (OA) is considered to reduce the number of experiments re- quired to determine the optimal wear for Al-SiC metal matrix composite. The orthogonal array provides the shortest possible matrix of combination in which all the pro- cess parameters are varied to consider their direct effect as well as interactions simultaneously. For this experi- mental purpose L27 orthogon al array is cho sen . Selection of proper orthogonal array is done based on the total number of Degrees of Freedom (DOF). The L27 OA has 27 rows corresponding to the number of tests and the de- gree of freedom is 26 with 13 columns with three levels. The degree of freedom of each design factor is 2 and for two way interaction of the factors the DOF is 4. So, the total degree of freedom for the conducted experiment is (2 × 4 + 4 × 3 = 20). As per Taguchi method the total DOFs of selected OA must be greater than or equal to the total DOFs required for the experiment. Thus, the L27 OA is chosen for the present case. The 1st column is as- signed to volume fraction (V), 2nd column is assigned to applied load (L), 5th column is assigned to sliding speed (S) and 9th column is assigned to time (T) or duration of wear test. Six columns are assigned to the two ways in- teractions of the first three factors while the remaining three columns are error terms. Table 3 shows the or Table 2. Design factors with levels. Levels Design Factors Unit 1 2 3 Volume fraction of reinforcement (V) % by weight 5 7.5i 10 Load (L) N 50 75i 100 Speed (S) RPM 180 200i 220 Time (T) MIN 20 30i 40 i = initial condition Table 3. L27 Orthogonal Array with design factors. Column Trial No. 1 (V) 2 (L) 3 (V × L) 4 (V × L) 5 (S) 6 (V × S) 7 (V × S) 8 (L × S) 9 (T) 10 - 11 (L×S) 12 - 13 - 1 1 1 1 1 1 1 1 1 1 1 1 1 1 2 1 1 1 1 2 2 2 2 2 2 2 2 2 3 1 1 1 1 3 3 3 3 3 3 3 3 3 4 1 2 2 2 1 1 1 2 2 2 3 3 3 5 1 2 2 2 2 2 2 3 3 3 1 1 1 6 1 2 2 2 3 3 3 1 1 1 2 2 2 7 1 3 3 3 1 1 1 3 3 3 2 2 2 8 1 3 3 3 2 2 2 1 1 1 3 3 3 9 1 3 3 3 3 3 3 2 2 2 1 1 1 10 2 1 2 3 1 2 3 1 2 3 1 2 3 11 2 1 2 3 2 3 1 2 3 1 2 3 1 12 2 1 2 3 3 1 2 3 1 2 3 1 2 13 2 2 3 1 1 2 3 2 3 1 3 1 2 14 2 2 3 1 2 3 1 3 1 2 1 2 3 15 2 2 3 1 3 1 2 1 2 3 2 3 1 16 2 3 1 2 1 2 3 3 1 2 2 3 1 17 2 3 1 2 2 3 1 1 2 3 3 1 2 18 2 3 1 2 3 1 2 2 3 1 1 2 3 19 3 1 3 2 1 3 2 1 3 2 1 3 2 20 3 1 3 2 2 1 3 2 1 3 2 1 3 21 3 1 3 2 3 2 1 3 2 1 3 2 1 22 3 2 1 3 1 3 2 2 1 3 3 2 1 23 3 2 1 3 2 1 3 3 2 1 1 3 2 24 3 2 1 3 3 2 1 1 3 2 2 1 3 25 3 3 2 1 1 3 2 3 2 1 2 1 3 26 3 3 2 1 2 1 3 1 3 2 3 2 1 27 3 3 2 1 3 2 1 2 1 3 1 3 2  S. GHOSH ET AL. 1089 thogonal array with design factors and their interactions assigned. Here each column represents a specific factor, each row represents an experimental run and the cell va- lues indicate the factor settings for the run. The cell va- lues in the main factor columns (i.e. V, L, S, and T) in- dicate their levels (1, 2 or 3) while the same in interac- tion columns (two cell fields in two columns for a par- ticular interaction) indicate the combination of the levels of the main factors concerned. For example, the interac- tion V × L occupies columns 3 and 4, and for trial no 1, the cell fields show 1 in column 3 and 1 in column 4. Thus V × L has the value 11 which means it is the com- bination of level 1 of V and level 1 of L. Similarly there are 9 such combinations (11, 22, 33, 12, 21, 23, 32, 13, and 31) for V × L interaction in columns 3 and 4. A similar procedure applies to other interaction terms as well. However, the experimental run is controlled by the settings of the controllable design factors, i.e. V, L, S and T and not by the interactions. The cell values in interac- tion columns and error columns are used in ANOVA for determination of their percentage contribution to the total effect. In this case, if the full factorial design were used, it would have 34 = 81 runs for consideration of even the four main factors only. The L27 OA requires only 27 runs, a fraction of the full factorial design. This array is orthogonal; factor levels are weighted equally across the entire design. 3.3. Wear Tests The wear tests are carried out in a block on roller Multi- tribotester TR25 (Ducom, India) (Figure 1). It is used to measure the wear behaviour of Al-SiC under dry non lubricated condition and at ambient temperature (280˚C) and relative humidity of abo ut 85%. The Al-SiC samples (size 20 mm × 20 mm × 8 mm) are pressed against a ro- tating steel roller (diameter 50 mm, thickness 50 mm and material EN32 steel) of hardness 65 HRc. The setup is placed in such a way that the rotating roller serves as the counter face material and stationary plate serves as the test specimen. A 1:5 ratio loading lever is used to apply normal load on top specimen. The loading lever is pi- voted near the normal load sensor and carries a counter weight at one end while at the other end a loading pan is suspended for placing the dead weights. The wear rate is measured in terms of displacement with the help of a linear voltage resistance transducer. The wear displace- ment sensor allows obtaining direct measurement of the loading lever’s d eflection, which corresponds to th e wear of the specimen plate plus the wear of the counterface surface. It may be noted here that wear behaviour is nor- mally expressed as wear volume or weight loss while in the present experimental set u p, wear is measured in terms of displacement. Thus to acces s the accuracy of wear mea- surement, the displacement results for wear are compared with weight loss and it shows almost linear relationship for the range of test parameters considered in the present study. The wear tests are carried out as per L27 OA in Table 3. 3.4. Microstructure Study After wear tests Scanning Electron Micro scopy (SEM) is done to study the wear tracks of the specimens. The mi- Figure 1. Schematic diagram of Multi Tribotester used for wear testing. Copyright © 2012 SciRes. JMMCE 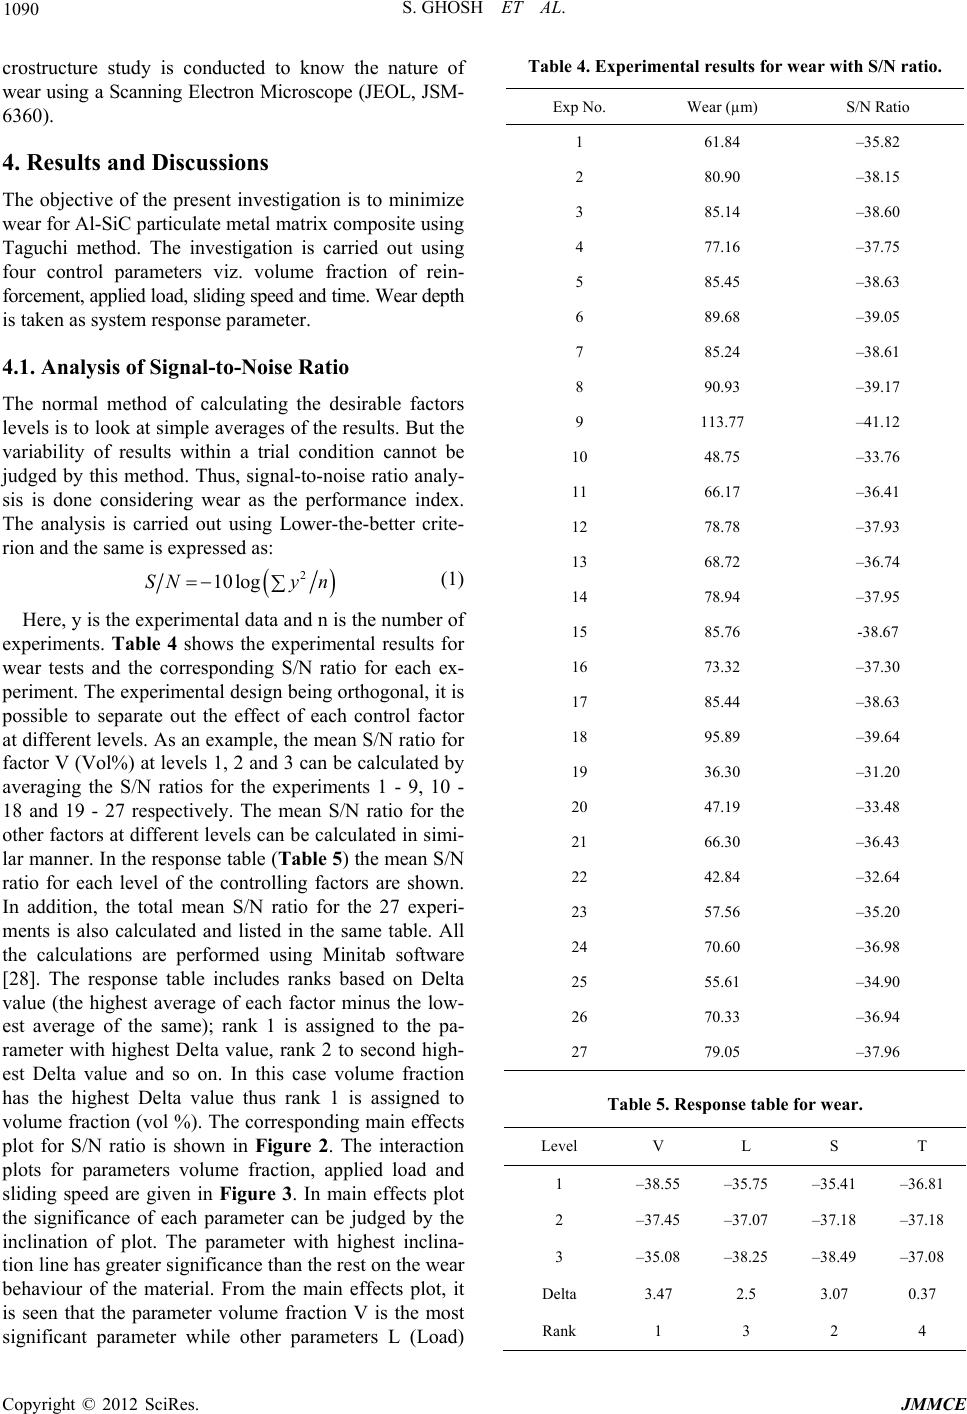 S. GHOSH ET AL. 1090 crostructure study is conducted to know the nature of wear using a Scanning Electron Microscope (JEOL, JSM- 6360). 4. Results and Discussions The objective of the present investigation is to minimize wear for Al-SiC particulate metal matrix composite using Taguchi method. The investigation is carried out using four control parameters viz. volume fraction of rein- forcement, app lied lo ad, sl id ing sp eed and time . Wear depth is taken as system response parameter. 4.1. Analysis of Signal-to-Noise Ratio The normal method of calculating the desirable factors levels is to look at simple averages of the results. But the variability of results within a trial condition cannot be judged by this method. Thus, signal-to-noise ratio analy- sis is done considering wear as the performance index. The analysis is carried out using Lower-the-better crite- rion and the same is expressed as: 2 10logSNy n (1) Here, y is the experimental data and n is the number of experiments. Table 4 shows the experimental results for wear tests and the corresponding S/N ratio for each ex- periment. The experimental design being orthogonal, it is possible to separate out the effect of each control factor at different levels. As an example, the mean S/N ratio for factor V (Vol%) at levels 1, 2 and 3 can be calculated by averaging the S/N ratios for the experiments 1 - 9, 10 - 18 and 19 - 27 respectively. The mean S/N ratio for the other factors at different levels can be calculated in simi- lar manner. In the response table (Table 5) the mean S/N ratio for each level of the controlling factors are shown. In addition, the total mean S/N ratio for the 27 experi- ments is also calculated and listed in the same table. All the calculations are performed using Minitab software [28]. The response table includes ranks based on Delta value (the highest average of each factor minus the low- est average of the same); rank 1 is assigned to the pa- rameter with highest Delta value, rank 2 to second high- est Delta value and so on. In this case volume fraction has the highest Delta value thus rank 1 is assigned to volume fraction (vol %). The corresponding main effects plot for S/N ratio is shown in Figure 2. The interaction plots for parameters volume fraction, applied load and sliding speed are given in Figure 3. In main effects plot the significance of each parameter can be judged by the inclination of plot. The parameter with highest inclina- tion line has greater significance than the rest on the wear behaviour of the material. From the main effects plot, it is seen that the parameter volume fraction V is the most significant parameter while other parameters L (Load) Table 4. Experimental results for wear with S/N ratio. Exp No. Wear (µm) S/N Ratio 1 61.84 –35.82 2 80.90 –38.15 3 85.14 –38.60 4 77.16 –37.75 5 85.45 –38.63 6 89.68 –39.05 7 85.24 –38.61 8 90.93 –39.17 9 113.77 –41.12 10 48.75 –33.76 11 66.17 –36.41 12 78.78 –37.93 13 68.72 –36.74 14 78.94 –37.95 15 85.76 -38.67 16 73.32 –37.30 17 85.44 –38.63 18 95.89 –39.64 19 36.30 –31.20 20 47.19 –33.48 21 66.30 –36.43 22 42.84 –32.64 23 57.56 –35.20 24 70.60 –36.98 25 55.61 –34.90 26 70.33 –36.94 27 79.05 –37.96 Table 5. Response table for wear. Level V L S T 1 –38.55 –35.75 –35.41 –36.81 2 –37.45 –37.07 –37.18 –37.18 3 –35.08 –38.25 –38.49 –37.08 Delta 3.47 2.5 3.07 0.37 Rank 1 3 2 4 Copyright © 2012 SciRes. JMMCE 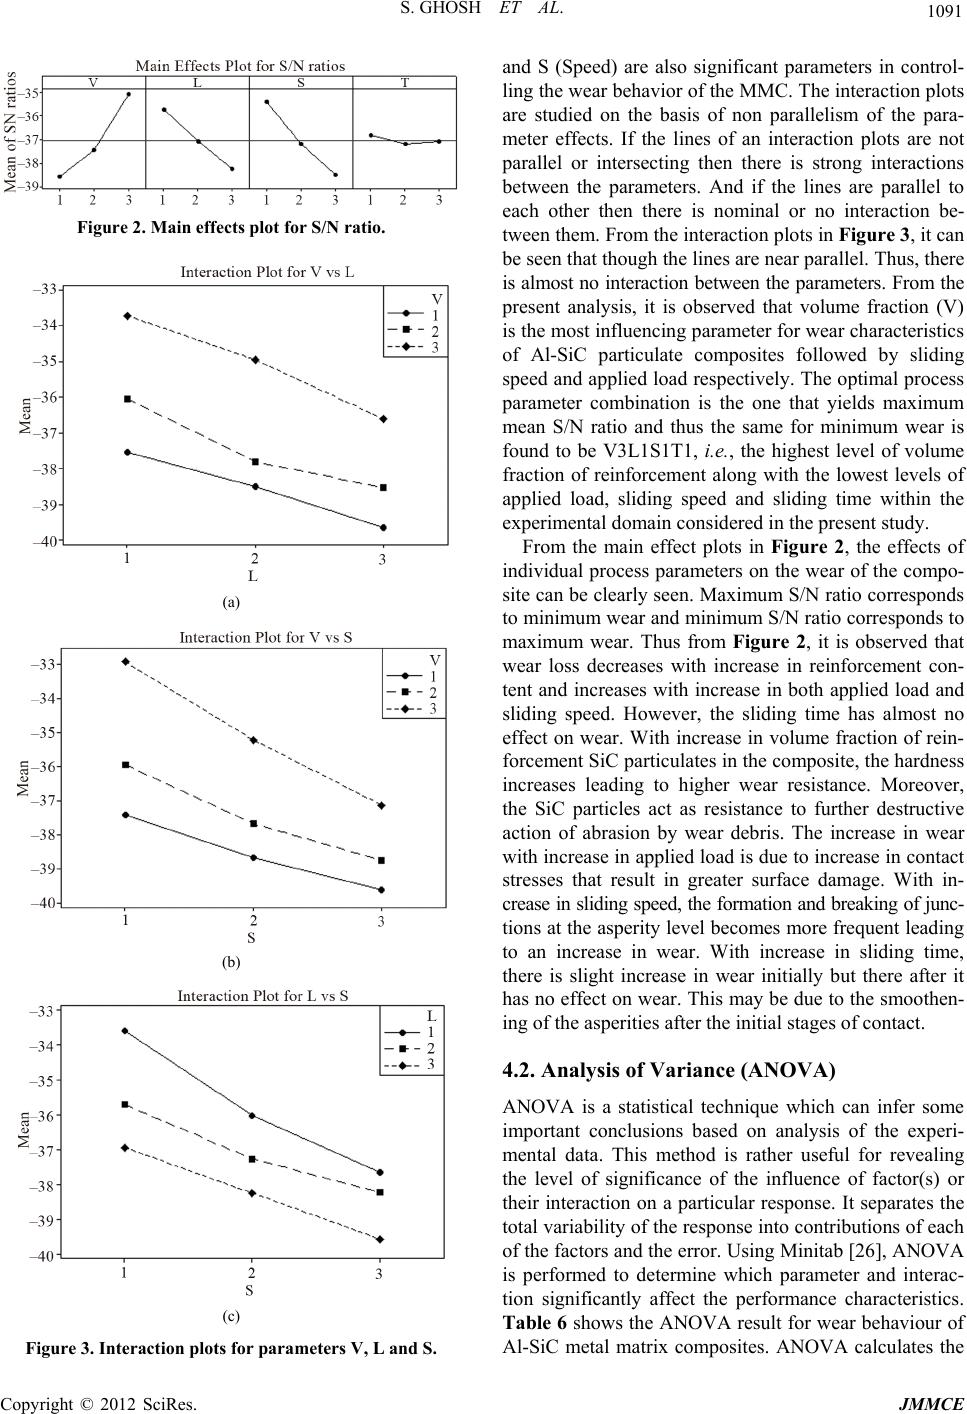 S. GHOSH ET AL. 1091 Figure 2. Main effects plot for S/N ratio. (a) (b) (c) Figure 3. Interaction plots for parameters V, L and S. and S (Speed) are also significant parameters in control- ling the wear behavior of the MMC. The interaction plots are studied on the basis of non parallelism of the para- meter effects. If the lines of an interaction plots are not parallel or intersecting then there is strong interactions between the parameters. And if the lines are parallel to each other then there is nominal or no interaction be- tween them. From the interaction plots in Figure 3, it can be seen that though the lines are near parallel. Thus, there is almost no in teraction between the paramet ers. From the present analysis, it is observed that volume fraction (V) is the most influencing parameter for wear characteristics of Al-SiC particulate composites followed by sliding speed and applied load respectively. The optimal process parameter combination is the one that yields maximum mean S/N ratio and thus the same for minimum wear is found to be V3L1S1T1, i.e., the highest level of volume fraction of reinforcement along with the lowest levels of applied load, sliding speed and sliding time within the experimental domain considered in the present study. From the main effect plots in Figure 2, the effects of individual process parameters on the wear of the compo- site can be clearly seen. Maximum S/N ratio corr esponds to mi ni mu m w e ar an d mi ni mu m S /N ra ti o co rr es po nd s t o maximum wear. Thus from Figure 2, it is observed that wear loss decreases with increase in reinforcement con- tent and increases with increase in both applied load and sliding speed. However, the sliding time has almost no effect on wear. With increase in volume fraction of rein- forcement SiC particulates in the composite, the hardness increases leading to higher wear resistance. Moreover, the SiC particles act as resistance to further destructive action of abrasion by wear debris. The increase in wear with increase in applied load is due to in crease in contact stresses that result in greater surface damage. With in- crease in sliding speed, the formation and breaking of junc- tions at the asperity level beco mes more frequent leading to an increase in wear. With increase in sliding time, there is slight increase in wear initially but there after it has no effect on wear. This may be due to the smoothen- ing of the asperities after the initial stages of contact. 4.2. Analysis of Variance (ANOVA) ANOVA is a statistical technique which can infer some important conclusions based on analysis of the experi- mental data. This method is rather useful for revealing the level of significance of the influence of factor(s) or their interaction on a particular response. It separates the total variability of the response into con tributions of each of the factors and the error. Using Minitab [26], ANOVA is performed to determine which parameter and interac- tion significantly affect the performance characteristics. Table 6 shows the A NOVA result for wear behaviour of Al-SiC metal matrix composites. ANOVA calculates the Copyright © 2012 SciRes. JMMCE  S. GHOSH ET AL. 1092 F-ratio, which is the ratio between the regression mean square and the mean square error. The F-ratio, also called the variance ratio, is the ratio of variance due to the ef- fect of a factor and variance due to the error term. This ratio is used to measure the significance of the parame- ters under investigation with respect to the variance of all the terms included in the error term at the desired sig- nificance level, α. If the calculated value of the F-ratio is higher than the tabulated value of the F-ratio, then the factor is significant at a desired α level. In general, when the F value increases the significance of the parameter also increases. The ANOVA table shows the percentage contribution of each parameter. From the ANOVA table it is seen that parameter V, i.e. volume fraction is the most significant parameter influencing the wear beha- viour at the confidence level of 99% while parameters L (applied load) and S (sliding speed) are also significant within the specific test range. Sliding time and the inter- action of parameters have almost no influence on wear property of the composite. 4.3. Confirmation Test After the optimal level of testing parameters have been found, it is necessary that verification tests are carried out in order to evaluate the accuracy of the analysis and to validate the experimental results. The estimated S/N ratio η, using the optimal level of the testing parameters can be calculated as: 1 ˆo mim i (2) where, m is the total mean S/N ratio, i is the mean S/N ratio at the optimal testing parameter level and o is the number of main design process parameters that signifi- cantly affect the wear behaviour of Al-SiC metal matrix composite. Table 7 shows the comparison of the esti- mated wear result with the actual wear using the optimal condition. It may be observed that good agreement takes place between the estimated and experimental results. There is improvement of S/N ratio from initial to op timal condition that yields nearly 17% decrease in wear from the initial condition. This is a significant improvement. 4.4. Wear Mechanism Microstructur e study of the wear tracks are carried out to analyze the wear mechanism that the composites undergo during tribological testing. Figure 4 shows wear tracks of samples having three different volume fraction of re- inforcement, Al-5%SiC, Al-7.5%SiC and Al-10%SiC. From the SEM micrographs, it can be observed that the worn surface mainly consists of longitudinal grooves and partially irregular pits. The presence of grooves indicates micro-cutting and micro-ploughing effect. Thus wear mech- anism is found to be dominated by abrasive wear. Also presence of pits and prows can be observed in the micro- graphs, thus occurrence of adhesive wear is also visible. So, from overall microstructure study it can be concluded that mostly abrasive wear has taken place with some traces of adhesive wear. In the present investigation the effect of four process parameters volume fraction, applied load, sliding speed and time on the wear behaviour of Al-SiC particulate composite is studied. Apart from these, other factors like heat treatment, temperature change and particle size of rein- forcement are assumed constant during this experimental study. In future, studies related to effects of these other factors on the wear behaviour of Al-SiC can be carried out. 5. Conclusion Wear behaviour of Al-SiCp metal matrix composite is studied for varying reinforcement content, applied load, sliding speed and time using Taguchi orthogonal array design. It is observed that parameter V, i.e. volume frac- tion of reinforcement is the most significant parameter influencing the wear behaviour at the confidence level of 99% while parameters L (applied load) and S (sliding speed) are also significant within the specific test range. Sliding time and the interaction of parameters have almost Table 6. ANOVA table for wear. SourceDFSS MS F Contribution % V 2 56.506 28.253 116.9# 41.50 L 2 28.126 14.063 58.19# 20.66 S 2 42.752 21.376 88.45# 31.40 T 2 0.658 0.329 1.36 00.48 V*L 4 1.070 0.267 1.11 00.79 V*S 4 3.221 0.805 3.33 2.37 L*S 4 2.376 0.594 2.46 1.75 Error 6 1.450 0.241 1.05 Total 26 136.1627 100 #Significant parameters (F 0.01, 2, 8 = 8.65) Table 7. Results of confirmation test. Optimal parameter Initial parameter Prediction Experimental Level V2L2S2T2 V3L1S1T1 V3L1S1T1 Wear (µm)82.24 68.46 S/N ratio (dB)–38.302 –31.975 –36.709 Copyright © 2012 SciRes. JMMCE  S. GHOSH ET AL. 1093 (a) (b) (c) Figure 4. SEM micrograph of worn surfaces of (a) Al-5% SiC, (b) Al-7.5%SiC, and (c) Al-10%SiC. no influence on wear property of the composite. From the Taguchi analysis the optimal combination of process parameter for minimum wear is found to be V3L1S1T1, i.e., the highest level of vo lume fraction of reinforcement along with the lowest levels of applied load, sliding speed and sliding time. Wear depth is reduced by nearly 17% from initial to optimal process parameter condition. From the present study it is revealed that a proper control of process parameters can result in improved design of the Al-SiC composite for tribological applications. From the microstructure study of worn surfaces, it is observed that mostly abrasive wear mechanism has occurred on the wear tracks with some traces of adhesive wear me- chanism. REFERENCES [1] H. Ahlatci, E. Candan and H. Cimenoglu, “Abrasive Wear Behaviour and Mechanical Properties of Al-Si/SiC Composites,” Wear, Vol. 257, No. 5-6, 2004, pp. 625-632. doi:10.1016/j.wear.2004.03.006 [2] K. S. Al-Rubaie, H. Goldenstein and J. D. Biasoli de Mello, “Three-Body Abrasion of Al-SiC Composites,” Wear, Vol. 225-229, 1999, pp. 163-173. doi:10.1016/S0043-1648(99)00009-5 [3] K. S. Al-Rubaie, H. N. Yoshimura and J. D. Biasoli de Mello, “Two-Body Abrasive Wear of Al-SiC Compos- ites,” Wear, Vol. 233-235, 1999, pp. 444-454. doi:10.1016/S0043-1648(99)00185-4 [4] M. Bai, Q. Xue, X. Wang, Y. Wan and W. Liu, “Wear Mechanism of SiC Whisker-Reinforced 2024 Aluminum Alloy Matrix Composites in Oscillating Sliding Wear Tests,” Wear, Vol. 185, No. 1-2, 1995, pp. 197-202. doi:10.1016/0043-1648(95)06617-9 [5] M. Bai, Q. Xue and Q. Ge, “Wear of 2024 Al-Mo-SiC Composites under Lubrication,” Wear, Vol. 195, No. 1-2, 1996, pp. 100-105. doi:10.1016/0043-1648(95)06808-2 [6] M. Bai and Q. Xue, “Investigation of Wear Mechanism of SiC Particulate-Reinforced Al-20Si-3Cu-1Mg Aluminium Matrix Composites under Dry Sliding and Water Lubri- cation,” Tribology International, Vol. 30, No. 4, 1997, pp. 261-269. doi:10.1016/S0301-679X(96)00047-3 [7] H. Chen and A. T. Alpas, “Wear of Aluminium Matrix Composites Reinforced with Nickel-Coated Carbon Fi- bers,” Wear, Vol. 192, No. 1-2, 1996, pp. 186-198. doi:10.1016/0043-1648(95)06795-7 [8] R. Chen, A. Iwabuchi, T. Shimizu, H. S. Shin and H. Mifune, “The Sliding Wear Resistance Behavior of NiAI and SiC Particles Reinforced Aluminum Alloy Matrix Com- posites”, Wear, Vol. 213, No. 1-2, 1997, pp. 175-184. doi:10.1016/S0043-1648(97)00123-3 [9] R. Chen, A. Iwabuchi and T. Shimizu, “The Effect of a T6 Heat Treatment on the Fretting Wear of a SiC Parti- cle-Reinforced A356 Aluminium Alloy Matrix Compo- site”, Wear, Vol. 238, No. 2, 2000, pp. 110-119. doi:10.1016/S0043-1648(99)00328-2 [10] S. K. Ghosh and P. Saha, “Crack and Wear Behaviour of Copyright © 2012 SciRes. JMMCE  S. GHOSH ET AL. Copyright © 2012 SciRes. JMMCE 1094 SiC Particulate Reinforced Aluminium Based Metal Ma- trix Composite Fabricated by Direct Metal Laser Sinter- ing Process,” Materials and Design, Vol. 32, No. 1, 2011, pp. 139-145. doi:10.1016/j.matdes.2010.06.020 [11] A. M. Hassan, A. Alrashdan, M. T. Hayajneh and A. T. Mayyas, “Wear Behaviour of Al-Mg-Cu-Based Compo- sites Containing SiC Particles,” Tribology International, Vol. 42, No. 8, 2009, pp. 1230-1238. doi:10.1016/j.triboint.2009.04.030 [12] Y. Iwai, H. Yoneda and T. Honda, “Sliding Wear Beha- viour of Sic Whisker-Reinforced Aluminium Composite,” Wear, Vol. 181-183, No. 2, 1995, pp. 594-602. [13] J. K. M. Kwok and S. C. Lim, “High-Speed Tribological Properties of Some Al/SiCp Composites: I. Frictional and Wear-Rate Characteristics”, Composites Science and Tech- nology, Vol. 59, No. 1, 1999, pp. 55-63. doi:10.1016/S0266-3538(98)00055-4 [14] G. Straffelini, M. Pellizzari and A. Molinari, “Influence of Load and Temperature on the Dry Sliding Behavior of Al-Based Metal-Matrix-Composites Against Friction Ma- terial”, Wear, Vol. 256, No. 7-8, 2004, pp. 754-763. doi:10.1016/S0043-1648(03)00529-5 [15] R. N. Rao and S. Das, “Effect of Matrix Alloy and Influ- ence of SiC Particle on the Sliding Wear Characteristics of Aluminium Alloy Composites,” Materials and Design, Vol. 31, No. 3, 2010, pp. 1200-1207. doi:10.1016/j.matdes.2009.09.032 [16] R. N. Rao and S. Das, “Effect of Sliding Distance on the Wear and Friction Behaviour of as Cast and Heat-Treated Al-SiCp Composites,” Materials and Design, Vol. 32, No. 5, 2011, pp. 3051-3058. doi:10.1016/j.matdes.2011.01.033 [17] S. C. Sharma, B. M. Girish, R. Kamath and B. M. Satish, “Effect of SiC Particle Reinforcement on the Unlubri- cated Sliding Wear Behaviour of ZA-27 Alloy Compo- sites”, Wear, Vol. 213, No. 1-2, 1997, pp. 33-40. doi:10.1016/S0043-1648(97)00185-3 [18] B. S. Unlu, “Investigation of Tribological and Mechanical Properties Al2O3-SiC Reinforced Al Composites Manu- factured by Casting or P/M Method,” Materials and De- sign, Vol. 29, No. 10, 2008, pp. 2002-2008. doi:10.1016/j.matdes.2008.04.014 [19] B. Venkataraman and G. Sundararajan, “The Sliding Wear Behaviour of Al-SiC Particulate Composite-I Macro Behaviour,” Acta Materialia, Vol. 44, No. 2, 1996, pp. 451-460. doi:10.1016/1359-6454(95)00217-0 [20] B. Venkataraman and G. Sundararajan, “The Sliding Wear Behaviour of Al-SiC Particulate Composite II—The Characterization of Subsurface Deformation and Correla- tion with Wear Behavior,” Acta Materialia, Vol. 44, No. 2, 1996, pp. 461-473. doi:10.1016/1359-6454(95)00218-9 [21] Y. Yalcin and H. Akbulut, “Dry Wear Properties of A356-SiC Particle Reinforced MMCs Produced by Two Melting Routes,” Materials and Design, Vol. 27, No. 10, 2006, pp. 872-881. doi:10.1016/j.matdes.2005.03.007 [22] Z. Hasan, R. Pandey and D. Sehgal, “Wear Characte- ristics in Al-SiC Particulate Composites and the Al-Si Piston Alloy,” Journal of Minerals and Materials Char- acterization and Engineering, Vol. 10, No. 14, 2011, pp. 1329-1335. [23] M. Singla, L. Singh and V. Chawla, “Study of Wear Properties of Al-SiC Composites,” Journal of Minerals and Materials Characterization and Engineering, Vol. 8, No. 10, 2009, pp. 813-821. [24] G. Taguchi, “Introduction to Quality Engineering,” Asian Productivity Organization, Tokyo, 1990. [25] P. J. Ross, “Taguchi Technique for Quality Engineering,” 2nd Edition, McGraw Hill, New York, 1996. [26] D. C. Montgomery, “D esign and Analysis of Experiments,” John Wiley Sons, New York, 2001. [27] R. A. Fisher, “Design of Experiments,” Oliver & Boyd, Edinburgh, 1951. [28] Minitab User Manual, “Making Data Analysis Easier,” Minitab Inc., Pennsylvania State University, Pennsylva- nia, 2001
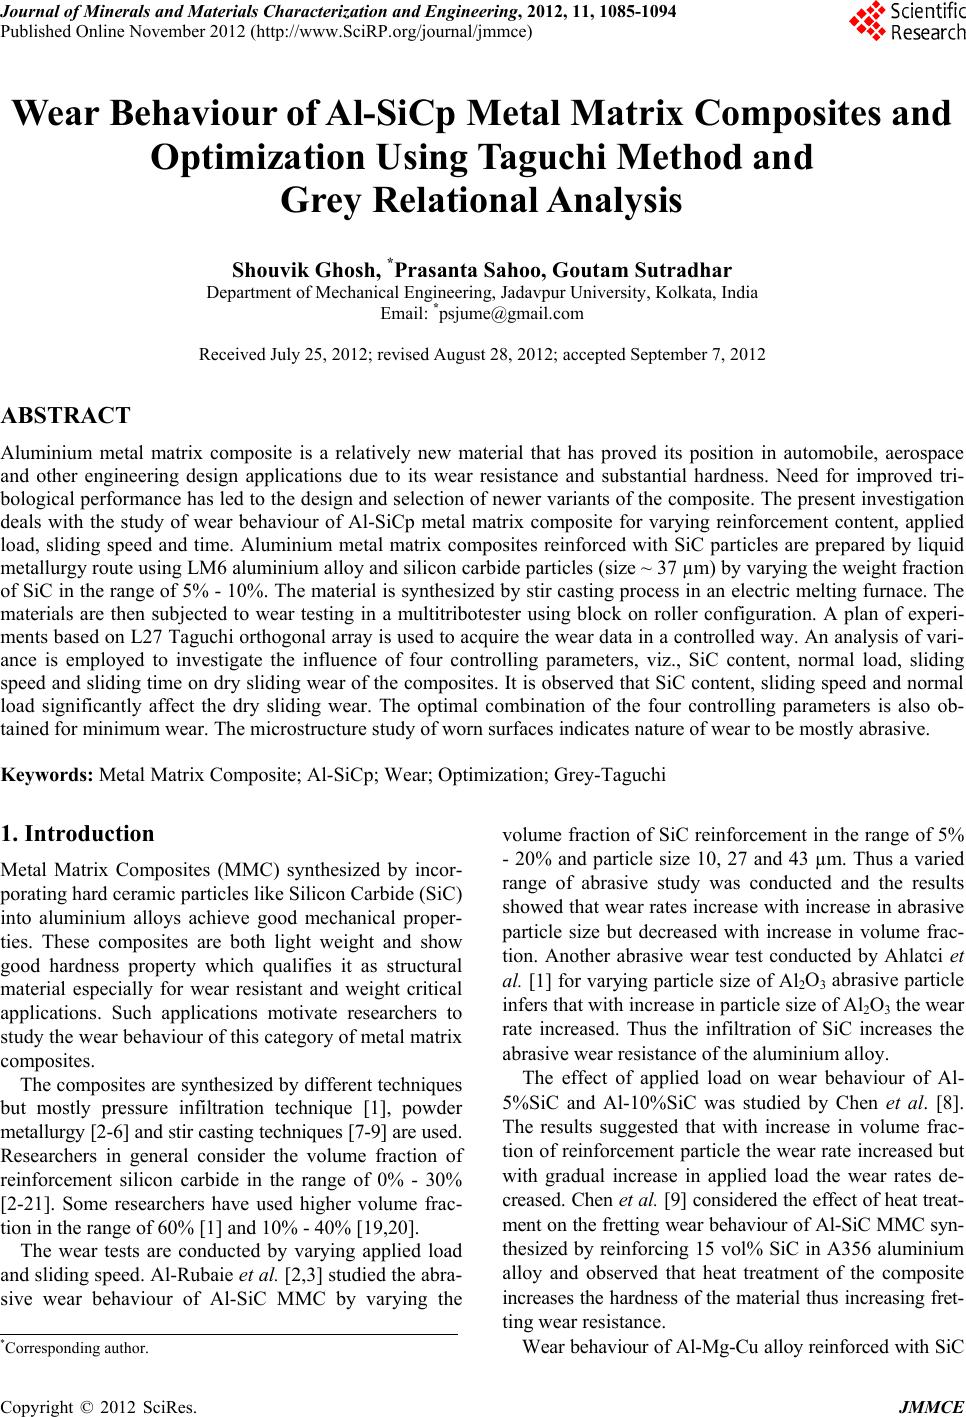
|