Paper Menu >>
Journal Menu >>
 Modern Economy, 2010, 1, 118-124 doi:10.4236/me.2010.12012 Published Online August 2010 (http://www. SciRP.org/journal/me) Copyright © 2010 SciRes. ME Research on the Relationship between Foreign Trade and the GDP Growth of East China—Empirical Analysis Based on Causality Yuhong Li, Zhongwen Chen*, Changjian San* Business School, Jinggangshan University, Ji’an, China E-mail: czw922@163.com Received April 19, 2010; revised June 8, 2010; accepted June 12, 2010 Abstract In open economy, development of foreign trade greatly impacts GDP growth. Adopt modern testing methods like unit root, time-series co-integration analysis and error correction model for researching the causalities between foreign trade including total export and import with the collected 28-year statistical data of east China from 1981 to 2008, including total export and total import and GDP growth of east China. The result suggests that there exist long term or short termcausality between GDP and total export and import as well as between GDP and export, foreign trade is the long term and short term reason of GDP growth, but no evi- dence can prove that there exists long term stationary causality between import trade and GDP. This paper finally provides with some instructive recommendations on how to develop the foreign trade of east China under the new global economy environment. Keywords: East China, GDP Growth, Foreign Trade, Causality Analysis 1. Introduction Since the reform and opening up, China’s foreign trade, which is playing a significance role in the world, has become more and more important. But the proportion of China's total import value in the GDP cannot match the average level of developed countries. Obviously, the for- eign trade is closely related to economic growth in China. The importance of foreign trade for a country is increas- ingly prominent, though many researchers like Xu Qifa and Jiang Cuixia (2002) focused on the research related to the contribution of foreign trade on GDP growth, re- searchers particularly only focused on one region[1], a province as an example, literature related to the research on the economic development of east China is rare. Since the reform and opening up, foreign trade in east has ex- perienced rapid development. From 1981 to 2008, ex- ports and imports in east increased from 8.564 billion dollars to 2289.189 billion dollars. The increase of fore- ign trade is faster than the increase of GDP, and the pro- portion of foreign trade in GDP is increasing too. Howe- ver, is there serious internal logical causality between GDP and foreign trade? or, is there long term or short termcausality between them? Thus, this paper will try to research and discover it. Due to the administrative division of China (2005) and the statement of financial department about graduates go- ing down to the grass-roots units (referring to the less developed areas of east China and the region of western China), now east China refers to the relevantly developed areas including Beijing city, Tianjin city, Shandong pro- vince, Liaoning province, Jiangsu province, Shanghai city, Zhejiang province, Fujian province and Guangdong province. However, some data of Beijing city are miss- ing, so the data cited in this paper will not include that of Beijing city. Although it will somewhat affect the rese- arch, it will not so much impact the research of the rela- tionship between GDP and foreign trade in east China in essence. According to the provincial yearbooks (1981-2008), the relevant data of east China (shown as Table 1), inc- luding (1981-2008) total foreign trade value (IE), the total export value (EXP) and the total import value (IMP) as well as GDP are collected and sorted out. From the result, it could be seen that the mentioned indexes repre- sent a trend to increase on the whole. In order to further grope for the relationship between GDP and certain in- dex, the concept of foreign trade dependency is cited to describe it [2]. It is just the ratio of certain index of for- eign trade and GDP, which can reflect the relationship of  Y. H. LI ET AL. Copyright © 2010 SciRes. ME 119 dependency between GDP and certain index. It can be written in a formula as, Dependence on foreign trade = certain index of foreign trade / GDP With the result calculated by the above formula, the de- pendency of each index of foreign trade represents a tre- nd to increase on the whole, while in some years, they occasionally represented fluctuations. With the result, we could see a trend of dependency (Figure 1). The ratio of dependence on foreign trade in east increased from 12.01% in 1981 to 69.37% in 2008. Especially, in 2006, it reached the top (80.88%); the ratio of dependence on export increased from10.74% in 1981 to 43.17% in 2008, it reached the top (48.60%) in 2006; the ratio of depend- ence on import increased from 1.27% in 1981 to 26.2% in 2008, it reached the top (32.27%) in 2006. These Fig- ures intuitively indicate that each index of foreign trade of east China contributes to GDP growth at different lev- els. But, whether there exists internal logical causality should be further tested. Therefore, the time-series data and latest more stationary analysis methods are adopted for testing the relationships of the indexes of foreign tra- de and GDP of east China. We will use unit root, time- series co-integration long term causality and short term- causality analyses to expect more stationary results [3]. Table 1. 1981-2008 relevant statistical data of GDP and foreign trade of east China. year GDP (100 million dollars) Foreign trade (10000 dollars) export (10000 dollars) import (10000 dollars) Dependence On foreign trade (%) Dependence on export trade (%) Dependence on import trade (%) 1981 1461.75 1755308 1569233 186075 12.01 10.74 1.27 1982 1455.68 1706645 1517628 189017 11.72 10.43 1.30 1983 1549.11 1765104 1540626 224478 11.39 9.95 1.45 1984 1603.69 2119018 1699111 419907 13.21 10.59 2.62 1985 1597.52 2558642 1793590 765052 16.02 11.23 4.79 1986 1571.12 2598819 1773466 825353 16.54 11.29 5.25 1987 1768.34 4303466 2675955 1627511 24.34 15.13 9.20 1988 2317.23 5901747 3339995 2561752 25.47 14.41 11.06 1989 2604.58 6692030 3878348 2813682 25.69 14.89 10.80 1990 2271.60 7339161 4593243 2745918 32.31 20.22 12.09 1991 2380.09 8907810 5342241 3565569 37.43 22.45 14.98 1992 3022.14 11334101 6424146 4909955 37.50 21.26 16.25 1993 4096.97 13560294 7136708 6423586 33.10 17.42 15.68 1994 3733.62 16810653 9362583 7448070 45.03 25.08 19.95 1995 4851.21 19671665 11297396 8374269 40.55 23.29 17.26 1996 5653.93 21668124 12217895 9450229 38.32 21.61 16.71 1997 6342.48 25125789 14851481 10274308 39.62 23.42 16.20 1998 6808.93 25955390 15194880 10760510 38.12 22.32 15.80 1999 7240.87 29076356 16413372 12662984 40.16 22.67 17.49 2000 8122.25 38067988 21040036 17027952 46.87 25.90 20.96 2001 8974.95 41122470 22756708 18365762 45.82 25.36 20.46 2002 9931.45 51292334 28085051 23207283 51.65 28.28 23.37 2003 11675.58 70691612 37877449 32814163 60.55 32.44 28.10 2004 14049.33 95750072 51540201 44209871 68.15 36.69 31.47 2005 16780.12 117542900 66064400 51478500 70.05 39.37 30.68 2006 20401.49 165002100 99160700 65841400 80.88 48.60 32.27 2007 26651.01 200954500 122842100 78112400 75.40 46.09 29.31 2008 33000.07 228918900 142452200 86466700 69.37 43.17 26.20 Data sources: 1981-2008 Provincial Yearbooks Figure 1. the Trend of dependence of GDP on foreign trade.  Y. H. LI ET AL. Copyright © 2010 SciRes. ME 120 2. Literature Review Economists who concern about foreign trade mainly fo- cus on the effects of foreign trade on national economy, and it has been a focus to discuss the theory about the relationship between foreign trade and economic growth. It is Adam Smith who first studies the relationship bet- ween international trade and economic growth. In his view, the development of division is the principal factor to improve the long-time growth of productivity, and the degree of division is constrained by the scope of market. Expansion of market will naturally deepen the division and improve the productivity, and then improve econo- mic growth; David Ricardo and J. S. Mill as well as D. R. Nurkse all possess the mentioned views shown in their works; while the special dispute starts at Robertson’s pro- position of that foreign trade is the engine of economic growth (1973) he mainly focus on the theory, which is co- mplemented and developed by Nurkse (the 1950s), that lagging countries can improve their economic growth by foreign trade ,especially, by export growth. He suggests that foreign trade is the crucial factor of economic grow- th engine. The engine theory causes controversial disputes [4], many economists suggest that trade growth of develop- ing countries is correlated to their own economic growth, their export growths are constrained by the economic gr- owth of developed countries[5]. William. Lewis is the representative personage of such economists. Irving Kra- vis (1970) puts forward new viewpoint, which is later accepted by lots of western economists, that foreign trade is a maid of economic growth rather than an engine. Cla- ssical school, Marxian school and New classical school all suggest that foreign trade has just indirect impact on accumulation and economic growth, in fact, foreign trade impacts on them through profit margin. Further, some La- tin American economists like Prebisch and Singer have completely negative attitude on engine theory, they sugg- est that ,in modern global economy regime, developed capitalism countries are the core which is regulating the outer consisting of developing countries, the outer coun- tries must comply with the core countries. This kind of depending relation makes foreign trade the reason of we- akening the economy of the developing countries rather than the reason of improving the economy of the devel- oping countries. Difference of opinions on the relation between foreign trade and economic growth has activated scholars to gro- pe for answers through empirical studies. Such as Jeff- rey.Sach and Andrew Warner find that the economic gro- wth rate of those developing countries which carry out opening economies reaches 4.5%, while that of those co- untries which carry out closed economies only researches 0.7%; in the mean time, they find the economic growth rate of those developed countries which carry out open economies reaches 2.3%, while that of the countries whi- ch carry out closed economy only reaches 0.7%. Some of the scholars mainly focus on co-integration analysis. For instance, Jung and Marshal (1985), Chow (1987), Love (1994), Dhawan and Biswa (1999) have done much of co-integration analyses [6]; Improved me- thods with error correction model were adopted by some Chinese scholars for doing a lot of empirical studies on trade and economic growth. The empirical analyses done by Shi Chuangyu (2003) and Wang Xianzhu (2007) sug- gest that growth of export could greatly promote econ- omic growth in short time, while that of import didn’t impact economic significancely. Liu Xiaopeng (2001) as well as Li Yuhong and Wang Xiaoyin (2009) do co-in- tegration analyses with the data of import, export and economic, and the results suggests that growth of import greatly promotes economic growth of China, while that of export performs an opposite one; Some of the scholars mainly focus on contribution ra- tio of foreign trade. Wei Weixian (1999) drew the concl- usion through co-integration analysis and variance ana- lysis that 31% of economic growth of China ascribes to the export -oriented strategy, while the contribution of economic growth to that of export is less than 10%, this accounts for that the fast growth of China’s economic growth doesn't realize the scale effect of the growth of export. Lin Yifu and Li Zhengjun improved the tradi- tional single equation model and built simultaneous equ- ations to calculate the contribution of foreign trade to economic growth. The result suggests that 10% of the export growth can lead to 1% of economic growth. Still, there are many scholars mainly focus on correla- tion analysis. For instance, Dong Migang (2000) indica- ted that, in 1978-1998, the correlation of China’s foreign trade and economic growth was significant, the coeffici- ent was r > 94%. Guo Xin (2004) drew the conclusion by recursion model, which indicates there exists a signifi- cant positive correlation between foreign trade and econ- omic growth. That is to say, the contribution of foreign trade to economic growth is considerable; While some of the scholars mainly focus on regression analysis to study foreign trade and economic growth. Su- ch as, Yi Xiangshuo (1997) found that the pull effect of export on non-export sectors or the whole economic growth was not strong at all; Yang Quanfa (1998) took a regression analysis with the data (1978-1995) of relevant indexes through the model built by Balasa and Vedur, and he drew a conclusion that growth of export didn’t meet the expectation of promoting the economic growth. Sun Lin, Wang Qifan (2003) researched, by the impro- ved Vedur Model, and pointed out that the mechanism and approaches of the effect of China’s foreign trade on economic growth has strong time tag. The above methods all have separate advantages and defects, especially, when single cross-set (time series)  Y. H. LI ET AL. Copyright © 2010 SciRes. ME 121 data analyses are adopted for testing. These methods all have the problem of potential on the low side, and they might lead to errors while calculating long term causali- ties and the instabilities. In addition, simply dealing with the data is just equal to considering them to be coessen- tial, so their heterogeneity was ignored. But in this paper, the authors will adopt improved co- integration analysis with error correction model for test- ing time series data of foreign trade and GDP to research the relationship between foreign trade and GDP growth of east China. 3. Models and Methods Co-integration analysis, which is mentioned above, with time-seriesis is adopted in this paper for testing whether there exists long term or short term stationary causality between foreign trade and GDP growth, and for testing the unit root of each variable to confirm their stationari- ties. The following would be the desired time-sequence data model [7], yit =ρi yi,t - 1 + Xitδi +εit where i = 1,…, N represent the number of time-series data; t = 1,…,T represents time span; xit are the exoge- nous variables in the model including fixed effect or time trend of each time-series unit; ρi is autoregressive coeffi- cient, suppose that disturbance terms εit are mutual inde- pendence. If | ρi | < 1, yit represents the stationary process; if | ρi | = 1, yit represents the process of unit root. Take the logarithms of the gross domestic products (GDP), total import and export value (IE), total export value (EXP) and total import value (IMP) separately, and they are LnGDP, LnIE, LnIMP, LnEXP. Then test their logarithm values and first difference values through time- series unit root. Logarithm cited here is for convenience to get stationarity more easily, and is helpful to eliminate the heteroscedasticity of time series and the characterist- ics of time series and relationships would not be changed. The relationships between relevant indexes would be tested in this paper by three steps. First of all, test throu- gh unit root using time-series data[8]; then, use two-step method put forward by Engle and Granger (1987) to test the mutual long term causalities of relevant indexes; if the long term causality exists, then further test their short term causalities. 3.1. Test of Time-Series Data by Unit Root In order to overcome the deviation brought out by only one method, LLC test, B test and IPS test are all used in this paper to test the relationships between GDP and relevant indexes (IE, EXP and IMP) of foreign trade of east China by unit root. 3.2. Co-Integration Analysis of Time-Series Data and Long Term Causality Test In order to test the long term cassations between variab- les, two-step test method put forward by Engle and Gra- nger (1987) is used. When measuring the long term cau- salities between GDP and relevant indexes of foreign trade, the measured variables are mutually simple inte- grated, and then the regression through the following time-series Equation (1) can be processed. Further, re- sidual errors Eit comes out and it’s tested through unit root to determine their stabilities. If Eit is stationary, the mutual long term causalities are proved to exist. Ln (*) = α + β Ln (**) + εit (1) where (*) and (**) separately represent GDP, IE, EXP and IMP. 3.3. Time-Series Data Error Correcting Model and Short Term Causality Test Co-integration relationships just reflect the long term balanced relations between relevant variables. In order to cover the shortage, correcting mechanism of short term- deviation from long term balance could be cited. At the same time, as the limited number of years, the above test result may cause disputes (Christpoulos and Tsionas, 2004). Therefore, under the circumstance of long term causalities, short termcausalities should be further tested as well. The error correcting models could be built as, d LnGDPit = ηi + Σα1d Ln GDPi, t – 1 + Σβ1d LnIEi, t-1 + λ ECMit + εit (2) d LnGDPit = ηi + Σα1d LnGDPi, t – 1 + Σβ1d LnEXPi, t-1 + λ ECMit + εit (3) d LnGDPit = ηi + Σα1d LnGDPi, t – 1 + Σβ1d LnIMPi, t-1 + λ ECMit + εit (4) d LnIEit = ηi + Σα1d LnIEi, t-1 + Σβ1d LnGDPi, t-1 + λ ECMit + εit (5) d LnEXPit = ηi + Σα1d LnEXPi, t-1 + Σβ1d LnGDPi, t-1 + λ ECMit + εit (6) d LnIMPit =ηi + Σα1d LnIMP i, t-1 + Σβ1d LnGDPi, t-1 + λ ECMit + εit (7) where t represents year, d rerepresents first difference calculation, ECMit represents the errors of long term balance. If λ = 0 is rejected, error correcting mechanism happens, and the tested long term causality is reliable, it  Y. H. LI ET AL. Copyright © 2010 SciRes. ME 122 could be unreliable. If β1 = 0 is rejected, and then the short termcausality is not proved to exist. 4. Result and Analysis 4.1. Test of Time-Series Data by Unit Root Software Eview 5.0 is herewith used and the four variab- les LnGDP, LnIE, LnEXP and LnIMP by LLC test, B test, IPS test are calculated and processed separately(see Table 2). The result indicates that LnGDP, LnIE, LnEXP and LnIMP all perform non-stationary state through the tests by the mentioned method. However, after first order difference, through the same methods, it’s found that all of them passed the significance test by 1%. So we can say GDP growth, total foreign trade value, total export va- lue and total import value are all integrated of order one. 4.2. Co-Integration Analysis of Time-Series Data and Long Term Causality Test Through the test by unit root, GDP, IE, EXP and IMP all perform one-order simple-integration I (1), there may exist mutual co-integration between relevant variables. The results of their long term causalities and correspond- ding residual errors Eit can be shown as Table 3. From Table 3, it’s found that there exists mutual long term causality between LnGDP and LnEXP, two of the three tests (LLC test, B test and IPS test) passed by 90% significance level. Nothing can prove that there exists long term mutual causality between GDP and LnIMP. Corresponding co-integration equations are the following: LnGDP =6.836721 + 0.672795LnEXP (28.49411) (45.37549) [0.0000] [0.0000] F = 2058.395, R2 = 0.987530 LnEXP = –9.933901 +1.467801LnGDP (–17.16705) (45.37549) [0.0000] [0.0000] F = 2058.935 R2 = 0.987530 (Notation: Figures in ( ) and [ ] are separately t-test values and p values of t-test) The above equations all passed t-test and F-test by 95% level. From the co-integration equations, it’s clear that, in the long term, LnGDP and Ln EXP are positive. And the elasticity between them is 0.672795; this means one unit of LnIE increment will lead to 0.672795 units of LnGDP increment. Similarly, one unit of LnGDP incre- ment will lead to 1.467801 units of LnEXP increment. 4.3. Time-Series Data Error Correcting Model and Short Term Causality Test It’s found, according to the co-integration test of time-se- ries data, that there exist mutual long term causality be- tween LnGDP and LnEXP. For the limited number of ye- ars, short causality between them should be used to test their stationarities (see Table 4). The result in Table 4 states the following clear: ECM in model 1, of which test equation is Equation (6), is positive and passes the test by 0.05 level, indicating cor- recting error mechanism happens, and long term pull effect of export trade on GDP has been proved. ECM in model 6 is also positive and passes the test by 0.05 levels, further indicating that export always promote GDP to Table 2. Result of Time-series data test by unit root. LnGDP LnEXP LnIMP LnIE Time span: 28 Level test first difference Level test first differenceLevel testfirst difference Level test first difference ADF test 2.1999 (0.999) –4.2547** (0.0028) 2.2935 (0.999) –4.1016** (0.0040) –2.902* (0.059) –3.7241** (0.0085) 1.0197 (0.996) –4.5716** (0.0013) PP test 7.4563 (1.000) –4.2076** (0.0031) 2.2935 (0.999) –4.0796** (0.0042) –1.701 (0.418) –4.0464** (0.0045) –1.001 (0.995) –4.5902** (0.0012) Notation: 1) the Figures in the brackets are p values; 2) *indicates panel data pass of the significance test by 95% level, **indicates panel data pass of the significance test by 99% level; 3) testing form is only intercept, lagging exponent number is chosen as Schwarz rules. Table 3. Result of Time-series Co-integration test (test of residual errors by unit root). Variables ADF test PP test LnGDP is the induced variable of LnIE LnIE is the induced variable of LnGDP –1.6497(0.4444) –1.8836(0.3345) –1.5748(0.4813) –1.8023(0.3714) LnGDP is the induced variable of LnIMP LnIMP is the induced variable of LnGDP –0.9914(0.7416) –1.9525(0.3047) –1.3153(0.6075) –2.0177(0.2779) LnGDP is the induced variable of LnEXP LnEXPis the induced variable of LnGDP –2.9299*(0.0550) –2.9830**(0.0493) –2.8616*(0.0632) –2.9036*(0.0581) Notation: *indicates panel data pass of the significance test by 95% level, **indicates panel data pass of the significance test by 99% level. 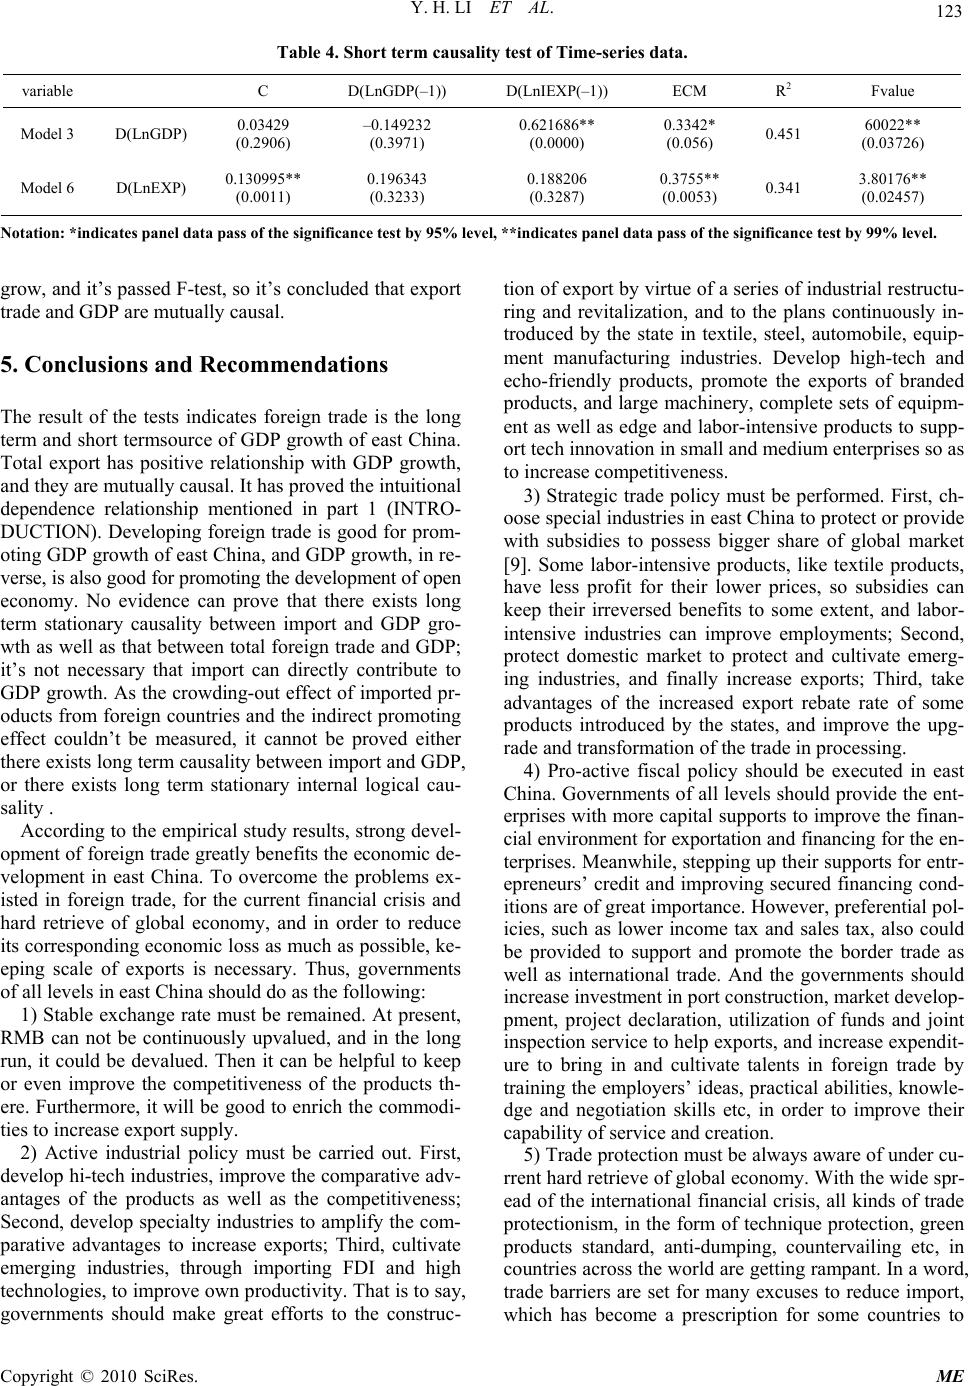 Y. H. LI ET AL. Copyright © 2010 SciRes. ME 123 Table 4. Short term causality test of Time-series data. variable C D(LnGDP(–1)) D(LnIEXP(–1)) ECM R2 Fvalue Model 3 D(LnGDP) 0.03429 (0.2906) –0.149232 (0.3971) 0.621686** (0.0000) 0.3342* (0.056) 0.451 60022** (0.03726) Model 6 D(LnEXP) 0.130995** (0.0011) 0.196343 (0.3233) 0.188206 (0.3287) 0.3755** (0.0053) 0.341 3.80176** (0.02457) Notation: *indicates panel data pass of the significance test by 95% level, **indicates panel data pass of the significance test by 99% level. grow, and it’s passed F-test, so it’s concluded that export trade and GDP are mutually causal. 5. Conclusions and Recommendations The result of the tests indicates foreign trade is the long term and short termsource of GDP growth of east China. Total export has positive relationship with GDP growth, and they are mutually causal. It has proved the intuitional dependence relationship mentioned in part 1 (INTRO- DUCTION). Developing foreign trade is good for prom- oting GDP growth of east China, and GDP growth, in re- verse, is also good for promoting the development of open economy. No evidence can prove that there exists long term stationary causality between import and GDP gro- wth as well as that between total foreign trade and GDP; it’s not necessary that import can directly contribute to GDP growth. As the crowding-out effect of imported pr- oducts from foreign countries and the indirect promoting effect couldn’t be measured, it cannot be proved either there exists long term causality between import and GDP, or there exists long term stationary internal logical cau- sality . According to the empirical study results, strong devel- opment of foreign trade greatly benefits the economic de- velopment in east China. To overcome the problems ex- isted in foreign trade, for the current financial crisis and hard retrieve of global economy, and in order to reduce its corresponding economic loss as much as possible, ke- eping scale of exports is necessary. Thus, governments of all levels in east China should do as the following: 1) Stable exchange rate must be remained. At present, RMB can not be continuously upvalued, and in the long run, it could be devalued. Then it can be helpful to keep or even improve the competitiveness of the products th- ere. Furthermore, it will be good to enrich the commodi- ties to increase export supply. 2) Active industrial policy must be carried out. First, develop hi-tech industries, improve the comparative adv- antages of the products as well as the competitiveness; Second, develop specialty industries to amplify the com- parative advantages to increase exports; Third, cultivate emerging industries, through importing FDI and high technologies, to improve own productivity. That is to say, governments should make great efforts to the construc- tion of export by virtue of a series of industrial restructu- ring and revitalization, and to the plans continuously in- troduced by the state in textile, steel, automobile, equip- ment manufacturing industries. Develop high-tech and echo-friendly products, promote the exports of branded products, and large machinery, complete sets of equipm- ent as well as edge and labor-intensive products to supp- ort tech innovation in small and medium enterprises so as to increase competitiveness. 3) Strategic trade policy must be performed. First, ch- oose special industries in east China to protect or provide with subsidies to possess bigger share of global market [9]. Some labor-intensive products, like textile products, have less profit for their lower prices, so subsidies can keep their irreversed benefits to some extent, and labor- intensive industries can improve employments; Second, protect domestic market to protect and cultivate emerg- ing industries, and finally increase exports; Third, take advantages of the increased export rebate rate of some products introduced by the states, and improve the upg- rade and transformation of the trade in processing. 4) Pro-active fiscal policy should be executed in east China. Governments of all levels should provide the ent- erprises with more capital supports to improve the finan- cial environment for exportation and financing for the en- terprises. Meanwhile, stepping up their supports for entr- epreneurs’ credit and improving secured financing cond- itions are of great importance. However, preferential pol- icies, such as lower income tax and sales tax, also could be provided to support and promote the border trade as well as international trade. And the governments should increase investment in port construction, market develop- pment, project declaration, utilization of funds and joint inspection service to help exports, and increase expendit- ure to bring in and cultivate talents in foreign trade by training the employers’ ideas, practical abilities, knowle- dge and negotiation skills etc, in order to improve their capability of service and creation. 5) Trade protection must be always aware of under cu- rrent hard retrieve of global economy. With the wide spr- ead of the international financial crisis, all kinds of trade protectionism, in the form of technique protection, green products standard, anti-dumping, countervailing etc, in countries across the world are getting rampant. In a word, trade barriers are set for many excuses to reduce import, which has become a prescription for some countries to  Y. H. LI ET AL. Copyright © 2010 SciRes. ME 124 get rid of crisis. Therefore, governments in east China must be highly aware of it and ready to face provocation of protectionism in foreign trade. 6. Acknowledgements This paper is assisted by the projects: Jiangxi provincial Co-operated Social Science Projects,A Study on the Dev- elopment of Service Industry and Trade in Service in Jiangxi Province (Project ID: 09YJ249)and A Research on the Evolution of the Spatial Economy in Jiangxi and Agglomeration of Industry (Project ID: 09YJ245 ); A St- udy on the Development of Logistics in Ji’an City Based on the Theory of Industry Cluster (Project ID: JR0816). 7. References [1] Y. H. Li and X. Y. Wang, “Research on the Relation- ship between Foreign Trade and the GDP Growth of So- uthwest Minority Region of China-Empirical Analysis Based on the Panel Causality,” IEEE International Con- ference on Industrial Engineering and Engineering Management, Hongkong, December 2009, pp. 798-802. [2] Y. H. Li and K. Y. Deng, “An Empirical Study on the Contribution of Foreign Trade to the Economic Growth of Southwest Minority Region of China,” International Conference on Computational Intelligence and Software Engineering, Wuhan, December 2009, pp. 1-4. [3] A. Levin, C.-F. Lin and C. Chu, “Unit Root Tests in Panel Data: Asymptotic and Finite Sample Properties,” Journal of Econometrics, Vol. 108, No. 1, 2002, pp. 1-24. [4] J. Love, “Engines of Growth: the Exports and Govern- ment Sectors,” World Economy, Vol. 17, No. 2, 1994, pp. 203-218. [5] W. S. Jung and P. J. Marshall, “Export, Growth and Cau- sality in Developing Countries,” Journal of Development Economics, Vol. 18, No. 2, 1985, pp. 1-12. [6] P. C. Y. Chow, “Causality between Export and Industrial Development: Empirical Evidence from NICs,” Journal of Development Economics, Vol. 26, No. 1, 1987, pp. 55- 63. [7] C. Kao, “Spurious Regression and ResiduaL2based Tests f or Co-integration in Panel Data,” Journal of Economet- rics, Vol. 90, No. 1, 1999, pp. 1-44. [8] K. S. Im, H. Pesaran and Y. Shin, “Testing f or Unit Roots in Heterogeneous Panels,” Journal of Economet- rics, Vol. 115, No. 1, 2003, pp. 53-74. [9] E. Helpman and P. R. Krugman, “Market Structure and Foreign Trade,” MIT Press, Cambridge, 1985. |